


Social science researchers seek to establish causal relationships that are generalizable—that is, they try to maximize internal and external validity. Survey experiments are becoming more popular among scholars because they seem to possess both properties. The random assignment of respondents to treatment and control conditions reveals whether one factor causes another, whereas the use of a representative sample allows generalization to the larger population.
However, even in nationally representative survey experiments, external validity may still be a concern if the treatments do not resemble the relevant phenomena in question or if the experimental setting exaggerates the effect of the stimulus. This article investigates a question that recent studies have raised (e.g., Gaines, Kuklinski, and Quirk Reference Gaines, Kuklinski and Quirk2007; Kinder Reference Kinder2007) but that has not been examined empirically: are the causal findings of survey experiments reliable predictors of how opinion changes in the wake of actual political events?
For researchers using survey experiments, the implicit assumption is that a significant treatment effect says something about the direction, if not the rough magnitude, of effects that might be expected to occur in the real world (Gaines, Kuklinski, and Quirk Reference Gaines, Kuklinski and Quirk2007, 5). Our study investigates this assumption. We do so by comparing the effects of two naturally occurring political events to contemporaneous survey experiments that delivered similar information to diverse samples of the American public. In the first study, we examine the effects of news coverage of the 2007 Medicare trust fund warning and compare it to a survey experiment that provided the same key facts about Medicare's financial status. In the second study, we analyze media coverage of a new citizenship test launched by the U.S. Citizenship and Immigration Services (USCIS) in the fall of 2008. Once again, we conducted a concurrent survey experiment that delivered similar information to an adult national sample. Taken together, the two studies offer a rare opportunity to compare the treatment effects from survey experiments with the effects of real-world political events.
This research is timely, if only because survey experiments have overturned much of the conventional wisdom on the nature of public opinion (e.g., Gibson Reference Gibson1998; Kinder and Sanders Reference Kinder and Sanders1996; Krosnick and Schuman Reference Krosnick and Schuman1988; Prior and Lupia Reference Prior and Lupia2008; Sniderman and Piazza Reference Sniderman and Piazza1993; Zaller and Feldman Reference Zaller and Feldman1992). Indeed, one scholar recently proclaimed, “survey experiments that integrate representative samples with the experimental control of questions represent the most valuable tool for gaining access to the processes that underlie opinion formation” (Lavine Reference Lavine and Monroe2002, 242). With the expansion of Internet surveys and multi-investigator studies such as Time-sharing Experiments in the Social Sciences, researchers from a variety of subfields are now using survey experiments (Druckman et al. Reference Druckman, Green, Kuklinski and Lupia2006). Thus, the number of scholars affected by this issue is large and growing.Footnote 1
We draw two lessons from our study—one is primarily methodological, the other is more substantive. Methodologically, we show that survey experiments generate effects that are observable among particular subgroups, not necessarily the entire population. Insofar as researchers keep this point in mind, we believe that survey experiments can be a valuable tool for studying public opinion. Substantively, we find that people in the natural experiments do not integrate new information and adjust their political beliefs to the degree that they do in survey experiments. Thus, scholars might come to different conclusions about the nature of public opinion depending on the manner in which they study it.
VARIETIES OF EXPERIMENTS AND VALIDITY
Years ago, scholars rarely undertook social science experiments (Kinder and Palfrey Reference Kinder and Palfrey1993). Today, experimental research is conducted in many different ways (McDermott Reference McDermott2002): laboratory experiments, carried out in controlled settings with students or members of the local community as subjects (e.g., Grosser and Schram Reference Grosser and Schram2006; Iyengar and Kinder Reference Iyengar and Kinder1987; Kam, Wilking, and Zechmeister Reference Kam, Wilking and Zechmeister2007; Mutz and Reeves Reference Mutz and Reeves2005); field experiments, in which randomized treatments are delivered outside the lab (e.g., Arceneaux and Kolodny Reference Arceneaux and Kolodny2009; Gerber and Green Reference Gerber and Green2000); and natural experiments, where analysts take advantage of variation in real-world phenomena (e.g., Huber and Arceneaux Reference Huber and Arceneaux2007; Lassen Reference Lassen2005; Mondak Reference Mondak1995).Footnote 2 Increasingly, public opinion researchers employ survey experiments that deliver randomized treatments in telephone or Internet polls. This approach is common in the area of citizen competence, where researchers use survey experiments to examine whether people are capable of learning (e.g., Kuklinski et al. Reference Kuklinski, Quirk, Jerit, Schwieder and Rich2000) and to analyze how the presentation of information alters beliefs or opinions (e.g., Berinsky Reference Berinsky2007; Kuklinski et al. Reference Kuklinski, Quirk, Jerit and Rich2001; Lupia et al. n.d.; Sniderman and Theriault Reference Sniderman, Theriault, Saris and Sniderman2004; Turgeon Reference Turgeon2009).
Because of their randomized treatments, experiments have the advantage of a high degree of internal validity. Survey experimenters, who typically rely on nationally representative adult samples, often claim the mantle of external validity as well (for discussion, see Kellstedt and Whitten Reference Kellstedt and Whitten2009, 75). But the issue goes beyond the representativeness of the subjects. According to Shadish, Cook, and Campbell (Reference Shadish, Cook and Campbell2002), “External validity concerns inferences about the extent to which a causal relationship holds over variations in persons, settings, treatments, and outcomes” (83; also see Campbell and Stanley Reference Campbell and Stanley1963). Thus, when scholars embed experiments in opinion surveys, they must consider whether the treatments themselves are externally valid (see Druckman Reference Druckman2004, 684—85 or Gilens Reference Gilens, Manza, Cook and Page2002, 248). Kinder and Palfrey (Reference Kinder and Palfrey1993, 27) worry that a study's findings may be “the product of an unrealistically powerful manipulation, one that rarely occurs in natural settings.” For example, in a critique of the framing literature, Sniderman and Theriault (Reference Sniderman, Theriault, Saris and Sniderman2004) argue that it is unrealistic to examine the effects of a single frame when citizens typically experience competing frames (also see Chong and Druckman Reference Chong and Druckman2007). To the extent that treatments in survey experiments are overly strong or atypical, the observed effects may not generalize beyond the particular study at hand.
A second and related issue is the manner in which treatments are received (i.e., the experimental setting). Kinder (Reference Kinder2007, 157) is concerned that
experimental results can always be questioned on their generalizability, and framing effects are no exception. The major worry in this respect is that framing experiments—like experiments in mass communication generally—typically obliterate the distinction between the supply of information, on the one hand, and its consumption, on the other. That is, experiments are normally carried out in such a way that virtually everyone receives the message. The typical experiment thereby avoids a major obstacle standing in the way of communication effects, namely, an inattentive audience, lost in the affairs of private life. By ensuring that frames reach their intended audiences, experiments may exaggerate their power.
Likewise, in their framework, Gaines, Kuklinski, and Quirk (Reference Gaines, Kuklinski and Quirk2007, 16) introduce an “inflation parameter” in recognition of the fact that “the artificially clean environment of the survey question makes treatment easier to receive than in real life.” Unlike the natural world, which contains competing messages and other distractions that make exposure to the treatment probabilistic, exposure is essentially forced in a survey experiment. This feature may also limit the extent to which the findings are generalizable, even with nationally representative samples.
EXPECTATIONS
Based on the preceding discussion, we expect that the treatment effects in our survey experiments will be larger than those observed among the public as a whole in the wake of actual political events on the same topic. In other words, the effects should be in the same direction but magnified. Yet, this comparison is only a starting point—one that we will refine momentarily. We begin with the contrast between survey experiment and general population because we believe that this is the comparison researchers have in mind when they interpret the results of a survey experiment. After all, why implement a survey experiment on a nationally representative adult sample—a costly and time-consuming endeavor—unless one intended to generalize to that population? As Gaines, Kuklinski, and Quirk (Reference Gaines, Kuklinski and Quirk2007) observe, “If those in the treatment group differ, on average, from those in the control group, the researcher normally concludes that the treatment works in a politically significant way in the real world” (5).
However, individuals are affected by messages in the mass media to the degree that they are exposed to that information (Zaller Reference Zaller1992). Thus, we expect that the treatment effects in the natural setting will be largest for those who were exposed to media coverage. Indeed, it is possible that the difference in effect sizes across the two contexts (i.e., survey and natural world) may disappear completely once we focus on people who were exposed to the stimulus in the natural setting. Such a pattern would provide guidance for interpreting the results of survey-based experiments. It would suggest that the typical survey experiment generates effects likely to be observed only among the highly attentive in the real world (also see Hovland Reference Hovland1959). We test these expectations in two separate studies on different political issues.
STUDY 1: MEDICARE TRUST FUND WARNING
Each spring in the United States, the board of trustees overseeing Medicare and Social Security releases its future funding estimates. Unlike past years, the 2007 report triggered a warning calling for legislation to be introduced because Medicare's finances fell below a specific threshold.Footnote 3 This major policy event focused national attention on Medicare in the spring of 2007. We leveraged this situation by combining a natural experiment—a comparison of public opinion before and after the trustees’ 2007 report—with survey experiments that delivered information about Medicare's finances. The survey treatments were similar to the real-world government announcement. As a result, this design allows us to contrast treatment effects from Medicare information provided in the real world with the treatment effects from survey experiments providing the same key facts about Medicare.
Study 1 uses data from two separate survey firms, Polimetrix and Knowledge Networks (KN), which administered national opinion surveys in the spring of 2007.Footnote 4 The Polimetrix and KN studies both feature Internet-based survey experiments, as well as comparisons before and after the Medicare announcement (see the Appendix for details on the two surveys). Because several features of Studies 1 and 2 are the same, we provide a detailed discussion of the research design in the context of the Medicare announcement and then briefly review the design when we get to Study 2.
Overview of Research Design
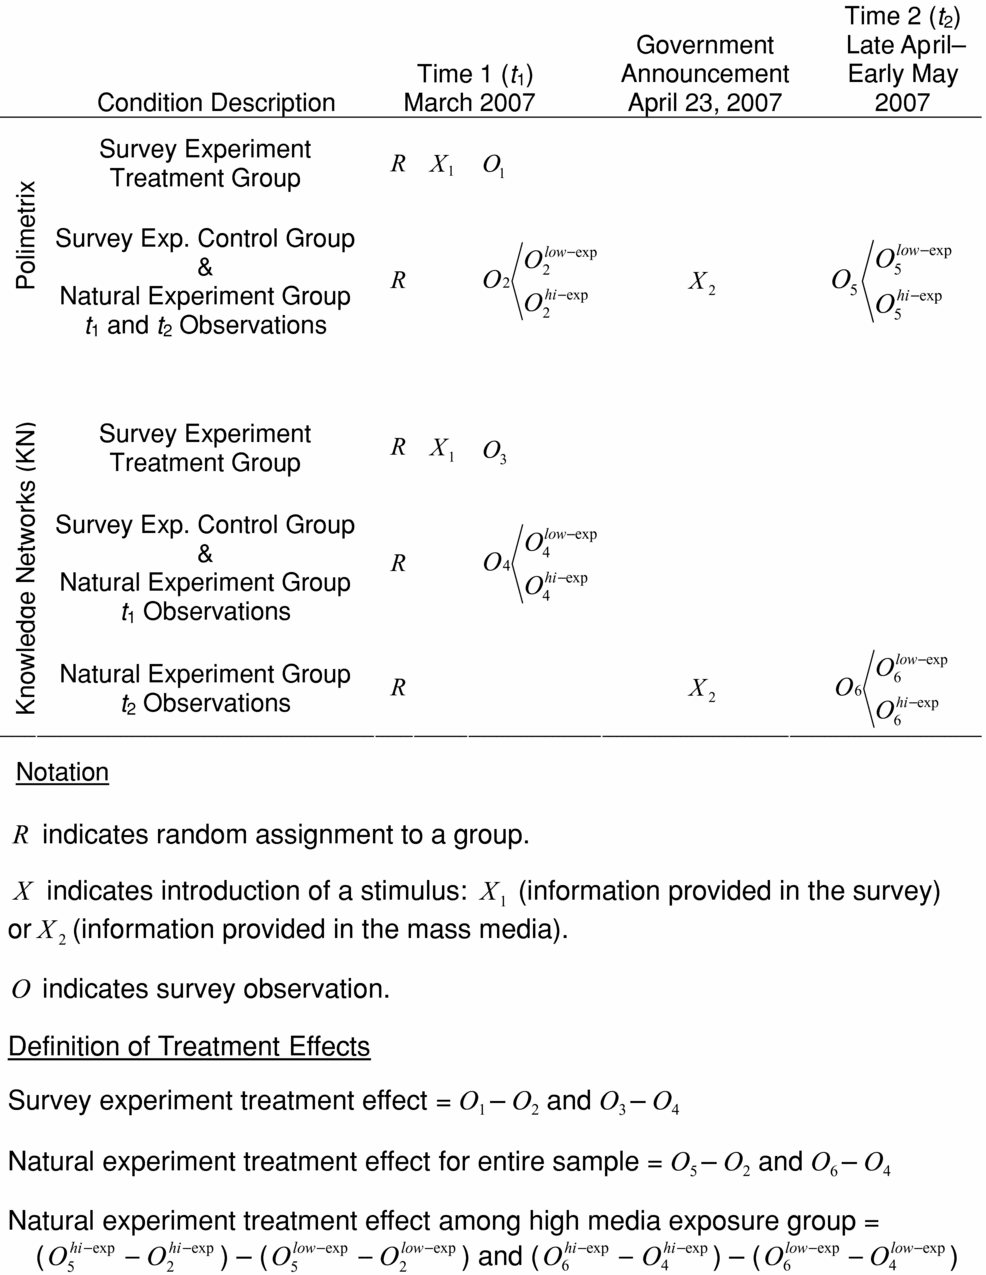
Figure 1 summarizes the design, relying on the symbolic notation for experimental designs from Campbell and Stanley (Reference Campbell and Stanley1963; also see Shadish, Cook, and Campbell Reference Shadish, Cook and Campbell2002). Between March 1 and 21, 2007, researchers at Polimetrix randomly assigned 346 individuals to a treatment group. This group received a survey treatment consisting of information about the relative financial status of Medicare and Social Security (a stimulus denoted X 1 in Figure 1). The survey treatment was designed to present the most pertinent facts expected to be announced by the government—in particular, information about the projected exhaustion dates of Medicare and Social Security.Footnote 5 An additional 163 respondents were randomly assigned to the control group that did not receive this information. Respondents in both groups answered questions about their knowledge and opinions regarding Medicare. These observations are represented by the O symbols in Figure 1. We determine the effect of the survey treatment by comparing treatment group responses (denoted O 1 in Figure 1) with control group responses (O 2).Footnote 6
Research Design Overview

A similar design was used in a survey experiment administered by KN. From March 2 to March 10, 2007, a randomly assigned group of 201 adults received the same Medicare information stimulus used in the Polimetrix study (X 1) and were then asked a similar set of questions about Medicare. Their responses (denoted O 3) are compared with those of a control group (O 4), offering a second measure of the survey treatment effect. The control group (n = 604) is bigger than the treatment group because we combine several conditions from the larger study.Footnote 7
The trustees overseeing Medicare and Social Security made their announcement on April 23, 2007. Media coverage of this announcement is the second stimulus, a natural treatment, given to individuals in the adult population from which both Polimetrix and KN samples were drawn. Following the government announcement, both organizations conducted postannouncement surveys asking the same questions that were posed in the first time period; these began in late April and continued through early May.Footnote 8 Polimetrix reinterviewed the subjects that were in the control group at time 1. This permits us to compare the preannouncement survey responses of the individuals not receiving the survey treatment, O 2, with the responses of these same individuals after the natural treatment—denoted O 5—to measure the effect of the natural treatment. KN did not reinterview individuals in the control group from time 1, but the firm did interview a new nationally representative sample after the Medicare announcement. The responses of this group—denoted in the figure as O 6—can be compared with the responses of the time 1 control group, O 4, for a second measurement of the effect of the natural treatment.
We assume that respondents who were subjected to the survey treatment (X 1) received the stimulus. We cannot make the same assumption when it comes to media coverage of the government's Medicare announcement, our natural treatment (X 2). Some individuals saw media coverage; others did not. The Polimetrix and KN surveys included questions that permit us to distinguish individuals who are likely to have seen the media coverage (a “high exposure” group) from those who are unlikely to have been exposed (a “low exposure” group). (This is why, in Figure 1, we disaggregate O 2, O 5, O 4, and O 6 into two components, denoting survey responses for the low exposure and high exposure groups separately.) Consider Polimetrix respondents in the natural experiment. By comparing the change in survey responses experienced by individuals in the high exposure group (O hi−exp5 − O hi−exp2) with the same change by subjects in the low exposure group (O low−exp5 − O low−exp2), we are able to measure the effect of the natural treatment on the subset of the population most likely to have actually experienced the treatment. In the KN study, we measure treatment effects in the same manner [i.e., (O hi−exp6 − O hi−exp4) − (O low−exp6 − O low−exp4)], providing another measure of the effect of the natural treatment on individuals most likely to have heard or seen media coverage of the Medicare announcement.Footnote 9
Survey Experiment Treatment
The same stimulus appeared in the Polimetrix and KN studies. It was the following factual information on the fiscal situations confronting Medicare and Social Security:
As you may know, the board of trustees overseeing the Medicare and Social Security programs regularly releases financial estimates. These estimates provide information about the condition of both programs over the next several decades and often are featured in the media. The following passage is from a news story on the financial estimates from the most recent report: [Farther down on the same screen] According to the trustees, the financial status of Medicare is particularly problematic. Due to the growing size of the elderly population, trust fund reserves will be exhausted in the year 2018. Social Security also faces financial problems, but the trust fund for Social Security is projected to be exhausted in the year 2040.
This information captured the true state of the world as of March 2007, according to the panel of experts overseeing the programs.Footnote 10 The treatment in our study is similar in length and level of detail to stimuli in past studies providing factual information in survey experiments (e.g., Berinsky Reference Berinsky2007; Gilens Reference Gilens2001; Kuklinski et al. Reference Kuklinski, Quirk, Jerit, Schwieder and Rich2000). More important, it conveys the same essential facts as news reports of the Medicare announcement (i.e., X 1 ≈ X 2).Footnote 11
Measuring Medicare Knowledge and Opinions
The empirical analysis focuses on two outcome measures. The first is knowledge, determined by a question that asked, “According to news reports, both Social Security and Medicare are facing financial problems in the future. If Congress doesn't take any action, which of these two programs is expected to be the first to not have enough money to cover all benefits—Medicare or Social Security?” The answer choices provided in random order were “Medicare,” “Social Security,” or “Both programs will exhaust their funds within the same year.” The correct answer at the time of the first study was unambiguously Medicare. According to widely cited funding estimates, Medicare's trust fund was projected to run out of funds in 2018, and Social Security's in 2040. The knowledge outcome question asks for the relative status of the programs, not specific dates, because a primary concern among policy makers is that Medicare, not Social Security, will be the first to face a funding dilemma.
The second measure is respondents’ beliefs about Medicare's fiscal health. In the Polimetrix survey, this item read: “Which of the following four statements comes closest to your own view of the Medicare program.” The answer choices were: “The program is in crisis,” “The program has major problems, but is not in crisis,” “The program has minor problems,” or “The program has no problems.” In contrast, the KN sample was asked: “How confident are you that the Medicare program will continue to provide benefits of at least equal value to the benefits received by retirees today?” The response options were “Very confident,” “Somewhat confident,” “Not too confident,” or “Not at all confident.” Both questions were intended to assess beliefs about Medicare's fiscal health, and this is the only time in which the outcome measures for Polimetrix and KN respondents are not identical. Questions like these appear regularly in surveys about Medicare and Social Security (e.g., Cook, Jacobs, and Kim Reference Cook, Jacobs and Kim2010; Page Reference Page, Burke, Kingson and Reinhardt2000; Shaw and Mysiewicz Reference Shaw and Mysiewicz2004), and they tap into the underlying notion of whether a problem exists apart from what reforms, if any, an individual supports.Footnote 12
Study 1 Empirical Results
How well do survey treatment effects correspond to what occurs in the real world? To answer that question, we must first characterize news coverage of the Medicare announcement.
The trustees’ 2007 report triggered a funding warning, the first in the program's history. Nevertheless, the warning generated a moderate amount of media coverage, in part because of other competing news events such as the death of former Russian President Boris Yeltsin and ongoing coverage of the Bush Administration's firing of U.S. attorneys. Whatever the source of the editorial decisions on the newsworthiness of the Medicare event (Bennett Reference Bennett2006), 54 stories appeared in newspapers and television newscasts during a 5-week period surrounding the Medicare announcement.Footnote 13 Nearly all media coverage was concentrated in a one-week period beginning on the day of the announcement. Therefore, although the coverage was fairly broad in that it appeared in a wide range of news outlets (Barabas and Jerit Reference Barabas and Jerit2009), the event did not generate multiple stories in the same news source over several weeks. The important point, from our perspective, is that nearly every story led with the Medicare trust fund warning and conveyed information about the relative financial condition of Medicare and Social Security, specifying that Medicare was going to run out of money sooner than Social Security.Footnote 14
Treatment Effects in Survey and Natural Experiments
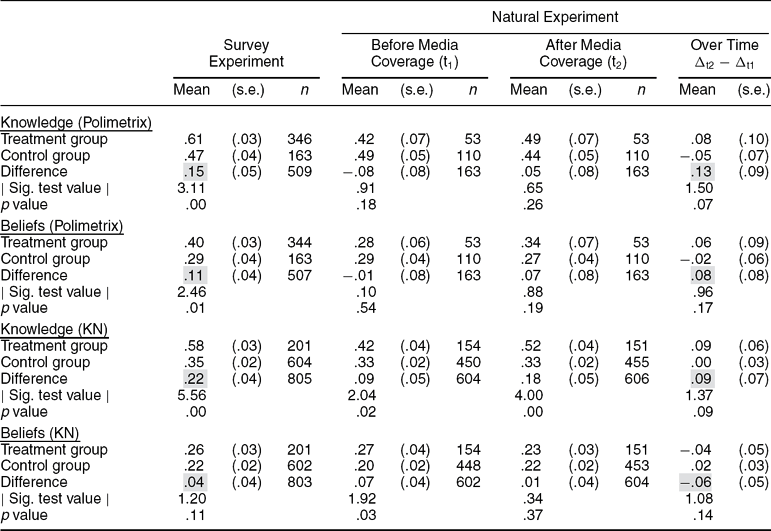
Table 1 shows the treatment effects from our two survey experiments and the natural experiment. Cell entries represent values on the knowledge and belief outcome measures across treatment and control conditions (all scaled to the 0–1 interval); standard errors and ns appear in the adjacent columns. Beginning with the upper-left portion of the table, we report the results from the survey experiment administered by Polimetrix. Subjects in the treatment group received information on the exhaustion dates for Medicare and Social Security. Subjects in the control conditions received no information before answering the outcome measures. Both groups were asked which program, Medicare or Social Security, would be the first to be unable to cover all benefits. The survey experiment treatment effect is represented by O 1 − O 2 from Figure 1.
Survey and Natural Experiment Effects: 2007 Medicare Announcement

Notes: Cell entries represent values on the outcome measures for the treatment and control groups, with standard errors in parentheses. The entries in gray shading highlight the survey experiment and natural experiment comparisons across each outcome. All variables are scaled on a zero-to-one interval so that the highest value of 1 represents knowing that Medicare will exhaust its trust fund before Social Security (knowledge), believing that Medicare is in a crisis (Beliefs-Polimetrix), or having no confidence that Medicare will continue to provide benefits of at least equal value to the benefits received by retirees today (Beliefs-Knowledge Networks). One-tailed p values are shown. Entries may not sum perfectly due to rounding. The significance tests are differences in proportions, except in the case of the over time difference-in-differences estimates, which are the marginal effects from the t 2Xexposure interaction in probit models (see Wooldridge Reference Wooldridge2009, 450–55). The standard errors for the models with interactions have been clustered to account for repeated observations of the panel respondents.
In the Polimetrix data, there is a statistically significant treatment effect, with a higher proportion of treated respondents providing the correct answer than control group respondents. Much as one would expect, when respondents are given the exhaustion date information, roughly 6 in 10 can later recall which program will run out of money first. The box in gray shading shows the 15 point difference in knowledge between the treatment and control conditions (.61 − .47 = .15; | z | = 3.11; p < .01).Footnote 15
We look for evidence of a treatment effect in the natural experiment in two ways. We begin by examining the undifferentiated control group, which entails comparing the preannouncement survey responses of the 163 people not receiving the survey treatment, O 2, with the responses of these same individuals after the natural treatment (O 5). When we do this, we find little evidence of learning (results not shown).Footnote 16 Forty-seven percent of respondents provided a correct answer to the knowledge item before the Medicare announcement; only 45% were able to do so afterward. The change over time is insignificant (| z | = .22; p ≤ .59).
Recall, though, that we can refine our analysis of the natural experiment by examining the change in survey responses experienced by people in the high exposure group (O hi−exp5 − O hi−exp2) relative to those in the low exposure group (O low−exp5 − O low−exp2). We distinguish levels of media exposure with a question that asked respondents which media source they used most.Footnote 17 Drawing on the media content analysis described previously, we created a term, High Exposure, that was scored as 1 if a respondent's news source mentioned the Social Security and Medicare dates (i.e., they were exposed to the exhaustion date information like the subjects in the survey experiment). All other responses were given a zero.Footnote 18
The results of the subgroup analyses appear in the remaining portion of the top rows of Table 1, where we compare changes in knowledge for high and low exposure individuals in the natural experiment.Footnote 19 High exposure people experienced a .08 change in their level of knowledge across the two time points (going from .42 to .49), whereas low exposure people moved in the opposite direction (−.05). The difference between these two differences, known as a “difference-in-differences” estimate (see Wooldridge Reference Wooldridge2009, 451), is .13, and it is statistically significant (p ≤ .07). Even though our analysis of the undifferentiated control group turned up little in the way of learning effects, significant effects emerge when we examine a subset of people in the natural world who are highly attentive and therefore are most likely to be exposed to information carried in the mass media. In this instance, then, the survey experiment is a reasonable guide to what learning might look like in the real world among those who are exposed to naturally occurring media treatments. The question is whether we see a similar pattern with our attitudinal measure.
The survey experiment revealed evidence of belief change when respondents received information on the fiscal status of the two programs. The control group mean is .29, whereas it is .40 in the treatment group (resulting in the .11 treatment effect reported in Table 1). Relative to the controls, individuals in the treatment condition were more likely to state that the program was in a crisis (| z | = 2.46; p < .01). In contrast, the evidence for belief change in the natural experiment is weaker, regardless of whether we examine the undifferentiated control group (.29 − .29 = 0; | z | = .12; p < .45), or compare high and low exposure people over time (the remaining portion of the Polimetrix belief entries in Table 1). Focusing on the comparison between high and low exposure respondents, the difference-in-differences estimate is .08, and it is statistically insignificant (p < .17).
The null results from the natural experiment imply that in the real world, beliefs were unaffected by the Medicare announcement. Caution is warranted, however, because the comparison groups are small (n = 53 and n = 110). Indeed, if one looks at the direction of change for high and low exposure individuals, the pattern in the natural experiment mimics that of the survey experiment (with high exposure individuals becoming more likely to state Medicare is in a crisis). This raises the question of whether there is sufficient power to establish statistical insignificance in the natural experiment. Auxiliary power analyses show that the probability of detecting a significant belief effect in the natural experiment, given an effect of the size found in the survey experiment, is .54.Footnote 20 Standards vary, but researchers generally strive for a power level of .90 (see Cohen Reference Cohen1988). Thus, statistical power is a concern in the natural experiment.
In light of the potential power issues in the Polimetrix survey, it is useful to turn to our second data source. The KN survey was administered at roughly the same time as the Polimetrix survey and has the advantage of larger comparison groups. Unfortunately, the KN survey lacks a measure of media exposure, and so we use a person's level of education as a proxy (e.g., Abrajano Reference Abrajano2005; Nadeau and Niemi Reference Nadeau and Niemi1995). Respondents with a college degree or above (25% of the sample) were treated as having “high media exposure,” whereas those with less than a college degree were coded as “low media exposure.” The results for the KN survey are shown in the bottom half of Table 1. Here we observe a statistically significant treatment effect for knowledge in the survey experiment (.58 − .35 = .22 after rounding; | z | = 5.56; p < .01). Like the pattern observed in the Polimetrix data, subjects who were treated with exhaustion date information were able to state which program would be the first to not provide full benefits.Footnote 21
Moving on to the pattern in the natural experiment, there is little evidence of learning in the undifferentiated control group over time (.35 − .38 = .03; | z | = .91; p < .18). Once again, however, there is greater correspondence between the survey and natural experiments when we focus on high exposure respondents. The high exposure group in the KN survey increased their level of knowledge from .42 to .52, which translates into a .09 change (with rounding). The corresponding change for low exposure individuals was zero (i.e., their level of knowledge was the same [.33] at both time points). The difference-in-differences estimate is .09 (p < .09).
Despite the variation in how we operationalize media exposure, the results for belief change in the KN data follow the general pattern established in the Polimetrix data: a survey treatment effect that is not easily replicated in the natural experiment. Among respondents in the survey experiment, the treatment makes a person more likely to state that they are not confident Medicare will continue to provide benefits (.26 − .22 = .04; | z | = 1.20; p ≤ .11). In the natural experiment, there is no change in beliefs when one examines the undifferentiated control group over time (.22 − .22 = 0; | z | = .18; p < .43). Similarly, we cannot reproduce the survey treatment effect among high exposure respondents—in fact, the highly exposed are less likely to voice concerns about Medicare's ability to provide benefits, leading to a difference-in-differences estimate of −.06 that is nearly significant in the “wrong” direction (p ≤ .14; power = .38).Footnote 22
Taken together, the analyses of the survey experiments suggest that when people are given factual information about the relative status of Medicare and Social Security, they exhibit higher levels of knowledge and adjust their beliefs about the fiscal health of the two programs. The picture that emerges from the natural experiment is more complicated. When it comes to the undifferentiated control group, there is no evidence that the public registered the kinds of changes we observed in the survey experiment. In fact, there are rather large differences between the size of the treatment effects in the survey experiment and the overall control group for both outcome measures. There is greater correspondence between the survey and natural experiments when we focus on the high exposure group in the natural experiment. Here, however, the correspondence is limited to the knowledge item. The highly exposed were able to recall the essential fact that appeared in real-world news stories about the trustees’ 2007 report. But coverage of the Medicare announcement did not have a corresponding effect on respondents’ beliefs. Thus, our two survey experiments seem to induce a wider range of effects—in this case, belief effects—than were observed in the natural world. We explore this idea further with one final set of analyses.
Beliefs are commonly thought of as the “building blocks” of attitudes (Eagly and Chaiken Reference Eagly and Chaiken1993, 103). Thus, we probed for additional belief effects in the survey experiment with a third outcome measure, one that gauges willingness to make Medicare more like private sector managed care. The question asks: “There is a proposal to make Medicare health insurance benefits more like a private health plan, such as a PPO (preferred provider organization) or an HMO (health maintenance organization)? How do you feel about this proposal?” The four choices were: “I strongly support it,” “I support it somewhat,” “I oppose it somewhat,” or “I strongly oppose it.” Our expectation, based on past research (e.g., Jacobs and Shapiro Reference Jacobs, Shapiro, Arnold, Graetz and Munnell1998; Jerit and Barabas Reference Jerit and Barabas2006; Oberlander Reference Oberlander2003; Page Reference Page, Burke, Kingson and Reinhardt2000), was that individuals who believed Medicare was in a state of crisis would be more likely to embrace large-scale policy change, such as privatization.
The key question is whether there is a difference in the belief–opinion relationship among respondents in the treatment and control conditions of the survey experiment. To the extent that the survey experiment primed respondents to think of Medicare in a state of crisis, it also might have brought individual's crisis beliefs into alignment with their policy preferences—in effect, making their Medicare attitudes more constrained (Converse Reference Converse and Apter1964). Such a pattern would be consistent with research showing that the determinants of a person's attitude can change, depending on the considerations that are most accessible (e.g., Zaller Reference Zaller1992, 80–84).
In the final analysis of Study 1, we explore whether crisis beliefs became more strongly associated with Medicare policy preferences for respondents in the treatment condition. We observe the expected pattern in both survey experiments, with crisis beliefs positively and significantly related to privatization opinions in the treatment conditions of the Polimetrix and KN surveys (p < .01 and p < .09, respectively).Footnote 23 These results suggest that when presented with new information, respondents adjusted their beliefs in a way that made sense in light of the stimulus. Their beliefs and policy preferences also became more closely linked.
In the natural experiment, we looked for changes in belief integration in the undifferentiated control group as well as in the subset of highly exposed respondents. In both instances, there was no increase in constraint following the Medicare announcement. In the Polimetrix and KN surveys, crisis beliefs were generally unrelated to Medicare reform preferences. The only exception occurred in KN among the high exposure respondents, where we observed a significant but negative relationship between beliefs and policy preferences (coeff. = −.41, s.e. = .21). We believe that this last finding underscores our basic point—that beliefs and opinions became integrated as a result of the survey experiment, but that it was difficult to observe the same degree of belief integration in the natural setting.
When it comes to the correspondence between our survey experiments and the natural experiment, the analyses in Study 1 suggest that the survey experiment would be a good guide to predicting how levels of knowledge might change in response to real-world information flows. In particular, the group of people most likely to be exposed to news about the trustees’ report were affected by it and showed significant gains in knowledge. At the same time, however, survey experiments seem to induce a wider range of effects than were observed in the natural world. To determine whether we could replicate these patterns, we conducted a second study.
Study 2: New Citizenship Test
In our second study, we turn to data that we collected as part of the 2008 Cooperative Campaign Analysis Project (CCAP), an Internet survey administered by YouGov/Polimetrix (see the Appendix for additional details). These data have many of the same features as our original study—in particular, a survey experiment designed to coincide with a naturally occurring political event. However, Study 2 has the advantage of larger comparisons groups and, hence, greater statistical power. It also considers another political issue at a different moment in time.
On October 1, 2008, the USCIS rolled out a new version of the test that immigrants must take in order to become U.S. citizens. The redesign of the test, the first since 1986, followed years of criticism of the old test, which critics believed was too easy. Instead of focusing on civics facts and trivia about the United States, the new test probed immigrants’ understanding of concepts and key moments in the country's history (e.g., the Cold War). At the crux of the debate surrounding this event was the content of the questions on the new test. Officials at the USCIS said the goal was to encourage immigrants to learn about the country's civic values, but critics said the new test required a more sophisticated understanding of the United States, and they worried that it might be too hard.
As was the case with Study 1, we conducted a content analysis, this time examining coverage of the new citizenship test. The event was covered in approximately 50 news stories across a variety of media outlets.Footnote 24 During this time, the mass media also were covering the 2008 presidential election and the federal government's $700-billion rescue package for the financial industry. Like the trustees’ 2007 report, then, the citizenship test had to compete with several other newsworthy events and therefore received a moderate amount of news coverage. There was, however, one notable difference across the two issues. In the case of the trustees’ 2007 report, nearly all news coverage was concentrated in the one-week period surrounding the Medicare announcement. In contrast, stories about the new citizenship test appeared throughout the entire 5-week content analysis period. Thus, even though the number of stories was similar across the two studies, coverage of the citizenship test was distributed over a longer time period.
Overview of Research Design
We estimate survey treatment effects by comparing the responses of individuals randomly assigned into treatment and control conditions (n = 280 and n = 304, respectively) in the September wave of the CCAP study. This corresponds to the survey experiment treatment effect estimated in Study 1 (O 1 − O 2 in Figure 1). Like the first study, the survey treatment was designed to present information that we expected to appear in media coverage about the citizenship test—namely, that there was going to be a new version of the test and that the content of the questions was going to change from a focus on civics facts to more abstract concepts.
The USCIS launched the new test on October 1, between the September and October waves of the CCAP study. Because this is a panel study, we can compare the responses of individuals in the control group in September (time 1) with the responses of these same people in the October wave (time 2). This quantity of interest corresponds to the O 2 vs. O 5 comparison from Study 1 (Figure 1).Footnote 25 We also have a series of media exposure questions that allow us to identify respondents who were using news sources that provided information about the new citizenship test. The question wording was “How have you been getting most of your information about current events?” Answer choices were television, newspapers, radio, the Internet, discussion, and other. Individuals were then asked, “Please provide the name of your most used media source. Try to be as specific as possible (i.e., provide the name of your television station, newspaper, radio station, website, etc.).” We used the open-ended responses to this second question and a detailed content analysis to determine whether a respondent's news source provided the correct information to the knowledge question. We created a term, High Exposure, that was scored as 1 if a respondent's news source mentioned that the USCIS was administering a new citizenship test. All other responses were given a zero.
Survey Experiment Treatment
The treatment in the survey experiment was designed to look like a news story. There was a title at the top of the screen that read, “New Tests Asks: What Does American Mean?” The stimulus also included a color photograph taken from an actual news story about the new citizenship test. The image showed 9 adults reading the oath of allegiance, with a caption beneath the picture (“New citizens taking the oath of allegiance.”). Further down on the same screen was the following text:
Federal authorities unveiled new questions immigrants will have to answer to become naturalized American citizens. The redesign of the test follows years of criticism. Immigration officials want to move away from civics to emphasize basics on the structure of government, American history, and geography.
As was the case with Study 1, the survey treatment presented the same basic information as media coverage about the new citizenship test.
Measuring Immigration Knowledge and Beliefs
Study 2 features two outcome measures. Knowledge is assessed with a question that asked, “The U.S. Citizenship and Immigration Services (USCIS) is in charge of the naturalization process and applications to become an American citizen. Did this government agency take any of the following actions recently: Design a new naturalization test for immigrants to become U.S. citizens?” Response options were “Yes” (the correct answer), “No,” and “Don't Know.” On the very next screen was an item that measured respondents’ beliefs. The question read: “Now I'd like to ask you about immigration in recent years. How likely is it that recent immigration levels will take jobs away from people already here?” Answer choices were: “Extremely likely,” “Very likely,” “Somewhat likely,” and “Not at all likely.” Answer choices for both outcomes were dichotomized as in Study 1 (i.e., correct vs. all other responses and a median split on beliefs).
Study 2 Empirical Results
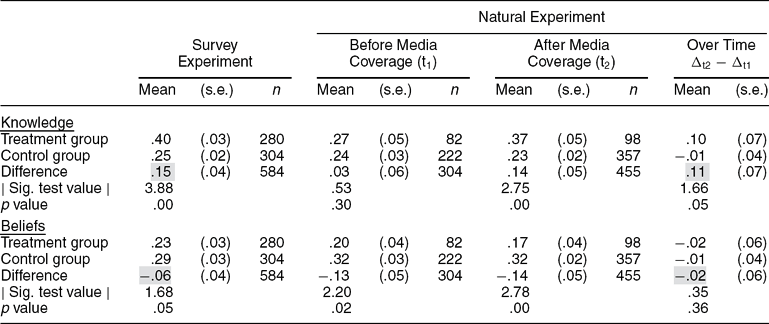
In Table 2, we report the treatment effects from the survey and natural experiments. Like the presentation in Table 1, cell entries represent values on the knowledge and belief outcome measures across treatment and control conditions (scaled to the 0–1 interval), with standard errors and ns appearing in the remaining columns.
Survey and Natural Experiment Effects: 2008 Immigration Announcement

Notes: Cell entries represent values on the outcome measures for the treatment and control groups, with standard errors in parentheses. The entries in gray shading highlight the survey experiment and natural experiment comparisons across each outcome. All variables are scaled on a zero-to-one interval so that the highest value of 1 represents knowing that the U.S. Citizenship and Immigration Service (USCIS) developed a new test for citizenship or believing that immigrants are taking away jobs. One-tailed p values are shown. Entries may not sum perfectly due to rounding. The significance tests are differences in proportions, except in the case of the over time difference-in-differences estimates, which are the marginal effects from the t 2Xexposure interaction in probit models (see Wooldridge Reference Wooldridge2009, 450–55). The standard errors for the models with interactions have been clustered to account for repeated observations of the panel respondents.
Beginning with knowledge, there is a 15-point treatment effect in the survey experiment (.40 − .25 = .15; | z | = 3.88; p < .01). Respondents who were exposed to the stimulus had a greater chance of providing the correct answer to the knowledge question. At the same time, knowledge among treated subjects did not reach the levels observed in Study 1. The baseline level of knowledge (.25) also was lower, suggesting that immigration was a more difficult issue.
We again look for treatment effects in the natural world in two ways: first by considering the undifferentiated control group over time, and then by comparing high and low exposure respondents in the natural experiment. When we examine the overall control group over time, there is little evidence of learning: 25% of the controls were able to provide the correct answer to the question at time 1, whereas 26% were able to do so in the second wave (| z | = .39; p < .35; not shown in Table 2). The comparison between high and low exposure respondents appears in the remaining portion of the top rows of Table 2. High exposure individuals experienced a .10 change in their level of knowledge across the two time points (going from .27 to .37), whereas low exposure people moved in the opposite direction (−.01). The difference between these two differences is .11, and it is statistically significant (p < .05). Consistent with the results from Study 1, there is correspondence between the survey and natural experiments when it comes to learning effects. Like the first study, however, significant learning effects emerge only when we examine the subgroup of people in the natural world who were most likely to be exposed to information about the new citizenship test.
When it comes to beliefs, the treatment in the survey experiment made respondents less likely to state that immigrants take jobs away from people (.23 vs. .29 for a −.06 treatment effect; p ≤ .05). This is to be expected because the stimulus presented a positive view of immigrants (e.g., people taking the oath of allegiance, an American flag in the foreground). Having just been exposed to an image that highlights legal (as opposed to illegal) immigrants, respondents in the treatment group were less likely to voice concern about job loss.
Consistent with the pattern in Study 1, though, there was little evidence that real-world media coverage of the new citizenship test altered people's beliefs. In the overall control group, beliefs remained constant across the time periods at .29 (| z | = .11; p < .54). Even among highly exposed respondents, the change in beliefs was slight (.20–.17), with no corresponding movement for the unexposed. This results in a difference-in-differences estimate of −.02, which is statistically insignificant (p ≤ .36).
Even with the larger comparison groups in the CCAP survey, statistical power may still be a concern given the size of the treatment effect in the survey experiment (.06). Auxiliary analyses indicate that the power of our natural experiment to detect changes of the magnitude found in the survey experiment is low (power = .40). Fortunately, the fact that we conducted three independent comparisons in the natural setting provides additional leverage. The likelihood that the null belief effects from Studies 1 and 2 are due to inadequate power is low (i.e., less than 20%). More specifically, we can represent this probability as (1 − .54) * (1 − .38) * (1 − .40) = .17, where .54, .38, and .40 are the power levels in Study 1 (Polimetrix and KN) and Study 2, respectively (see Keppel Reference Keppel1982, ch. 4). When viewed across multiple studies, the null belief effects are unlikely to be an artifact of low statistical power.Footnote 26
We also replicated the constraint analyses from Study 1. In the case of immigration, there was no evidence that the survey experiment induced constraint among respondents. Beliefs were closely related to immigration policy opinions, even among individuals in the control group. Absent a significant treatment effect for constraint in the survey experiment, there is no expectation that one would be found in the real world—and that is exactly what the data show.
All in all, the findings were consistent with those from Study 1. Across separate analyses, we observed statistically significant information and belief effects in the survey experiments. In contrast, the natural experiments showed evidence of learning only. This implies that in the real world, it is possible to get people to absorb information, but they do not process this information in the same manner as the survey experiment. Indeed, survey experiments appear to induce a series of downstream attitudinal effects (e.g., belief change, increased constraint) that have no apparent counterpart in the real world. Thus, scholars might come to different conclusions about citizen competence depending on how they examine public opinion.
Overview of Findings in Studies 1 and 2
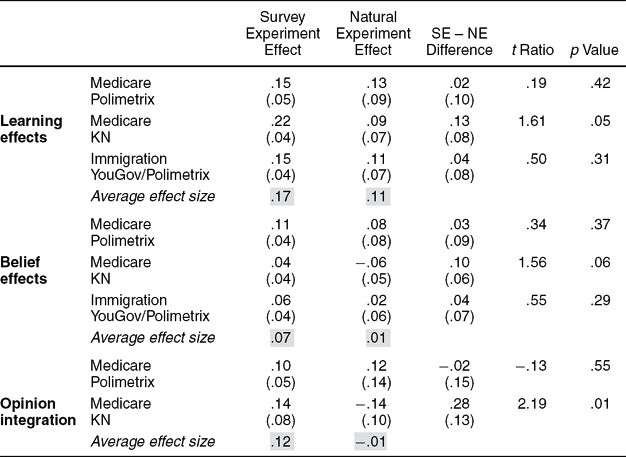
We close by summarizing the findings from both studies. Table 3 reproduces the effect sizes from the survey and natural experiments (based on the analyses reported in Tables 1 and 2). For ease of interpretation, all effects are on the 0–1 interval.Footnote 27
Comparison of Survey and Natural Experiment Effects

Notes: Cell entries for learning and belief effects in the first two columns reproduce the effect sizes reported in Tables 1 and 2. Standard errors appear in the parentheses. The bottom portion of Table 3 shows the marginal effects from the constraint analyses described in the text. For ease of presentation, the marginal effects are based on a dichotomous dependent variable. Average effect sizes are shown in the boxes with gray shading.
As the top panel shows, the average learning effect in the survey experiment was .17, roughly 50% larger than the average effect in the natural experiment (avg. = .11). The middle panel shows that, on average, respondents changed their policy beliefs by about .07 units in the survey experiment, but exhibited virtually no belief change in the natural experiments. Similarly, in the bottom panel of Table 3, respondents increased the association among policy-relevant beliefs by about .12 units in the survey experiment, whereas individuals in the natural experiment show essentially no average increase in opinion integration.
Of course, it is one thing to show a difference in effect size across the two contexts; it is quite another to demonstrate that those differences are statistically significant. We address this issue in the right-hand side of Table 3, where we present the difference in effect size across the survey and natural experiments (third column) and the corresponding t ratios and p values (fourth and fifth columns). For illustrative purposes, we focus on learning effects in the Polimetrix survey (Medicare). Here the difference between the survey and natural experiments is .02, with a t ratio and one-tailed p value of .19 and .42, respectively. This level of statistical significance is low. The difference between the survey and natural experiments is larger for the other two learning comparisons, achieving statistical significance in the KN survey (difference in effect size = .13; p = .05). Taken together, we conducted three independent tests of learning, and all show the same pattern. According to a sign test, the probability of obtaining these three results by chance alone is .125. Overall, then, we have differences between the survey and natural experiments that are substantively large but statistically marginal.Footnote 28 Although we have documented discrepancies in effect size across three domains (learning effects, belief effects, and opinion integration), additional research with large samples will be needed to confirm that the differences between survey and natural experiments are real.Footnote 29
Before placing the findings from Studies 1 and 2 in broader context, it is important to comment on the robustness of our results. In the case of learning, the findings from the survey experiment always exceed high levels of statistical significance (i.e., z test critical values of 1.96, the benchmark for a two-tailed test at alpha = .05). The results from the natural experiment are more tenuous in that the learning findings are statistically significant but at a lower threshold (i.e., z values of 1.28, the p < .10 critical value for a one-tailed test). In that sense, different choices regarding the data and analysis could weaken the information effects in the natural experiment. In an attempt to determine whether differences in sample composition play a role in the findings we observe, we include controls for background characteristics (e.g., gender, race, income, age, education, partisanship) along with the treatment indicators. In those auxiliary analyses, we obtain the same pattern of results. That is, we find strong learning and belief effects in the survey experiments, but in the natural experiments, we find learning among the highly exposed with no corresponding belief effects.
DISCUSSION
Although the real world does not look so different as to throw into doubt the validity of survey experiments, there is drop-off in terms of both the size of treatment effects and the population experiencing those effects (i.e., the significant findings are observed only among a subgroup highly exposed to the media). This attenuation may stem from several sources: (1) the relatively modest level of attention the national media devoted to our two government announcements; (2) the differences in reception of the treatment across the survey and natural experiments; or (3) because of competing stimuli, real-world media treatments may have a lower impact than those appearing in a survey experiment. In the rest of this section, we consider each source in more detail.Footnote 30
Coverage of our two news events appeared in dozens of news stories. This is not a trivial amount of coverage, but it also did not reach the level of the 2009–10 debate over health care reform or the run-up to the 2003 Iraq war. Instead, and as noted previously, the trustees’ 2007 report and the new citizenship test received about the same level of media coverage as other routine political events. It is important to study the effects of ordinary news events because they, along with extraordinary events, form the raw ingredients of public opinion. The variation in effect sizes across the survey and natural experiments (Table 3) suggests that the typical treatment in a survey experiment might better approximate news events receiving a substantial amount of coverage (i.e., in multiple outlets and over a period of weeks, not days).Footnote 31
Another source of attenuation is the lower levels of exposure that occur in the real world when compared with the experimental setting. As we documented in Study 1, only a minority of the Polimetrix sample (about 30%) reported using a source that included the exhaustion date information (the corresponding figure for Study 2 is 27%). In the experiment, in contrast, exposure to the information treatment was forced. In general, we expect the level of exposure in a survey experiment to exceed that found in the real world. This expectation implies that when researchers compare experimental and observational studies, there is likely to be a discrepancy in effect size (e.g., Hovland Reference Hovland1959). The challenge then becomes how to translate significant experimental findings into statements about the effects of similar treatments in a natural setting (e.g., Brader Reference Brader2005, 402). In our study, for example, how do we interpret the significant treatment effects we observed in our survey experiments? The obvious answer is that they indicate the likely effect among people receiving similar messages in the real world. But how many researchers acknowledge that the treatment effects they observe in a nationally representative survey experiment may be present only among a subset of the population?Footnote 32
A third source of attenuation is that for any given level of exposure, real-world media treatments may have a lower impact than those appearing in a survey experiment. Here the comparison of learning effects in Table 3 is instructive. Recall that the knowledge questions were the closest, in terms of substance, to the treatment. We were also able to identify subgroups of the public that were exposed to the report and found significant learning effects among this group. One might then expect high levels of correspondence between the survey and natural experiments on the knowledge questions. Yet, this was where we observed one of the largest differences in treatment effect size (.22 − .09 = .13 in KN; Table 3). In this instance, one cannot attribute the divergence to differences in exposure because we were able to identify respondents whose news source carried the exhaustion date information. Instead, we suspect that attenuation may stem from the multiple stimuli (competing messages) in the real world that reduce the effect of any given message. In contrast, the more pristine experimental setting may exaggerate the power of the stimulus (Kinder Reference Kinder2007). From this perspective, survey experiments might operate in a way that is analogous to an existence proof, demonstrating what treatment effects in the real world might look like if the entire population received a particular message.Footnote 33
Another important finding to emerge from this study is the differential pattern for information and belief effects. In the survey experiment, we observed changes in knowledge, beliefs, and (on the Medicare issue) attitude constraint; in the natural experiment, individuals were able to recall the key facts reported by the two government announcements, but the content and organization of their beliefs remained unchanged. What accounts for this difference? Belief effects require more than just recall, and instead involve some degree of thought and integration. It may be easier to observe belief change in a survey experiment because subjects digest the treatments more thoroughly than their real-world counterparts. This raises the possibility that survey experiments may induce a variety of second-order effects (e.g., making inferences, integrating beliefs and attitudes) that are unlikely to occur in the wake of actual political events.
CONCLUSION
Researchers conduct experiments for a variety of reasons (e.g., Roth Reference Roth, Kagel and Roth1995), but what distinguishes political scientists’ use of this method is “their attention to focal aspects of politically relevant contexts” (Druckman et al. Reference Druckman, Green, Kuklinski and Lupia2006, 629). For scholars seeking to understand and to make predictions about public opinion, the relevant context often implies stimuli that have a real-world referent. Survey experimenters, in particular, go to great lengths to make their treatments correspond to features of the political world, such as persuasive arguments, campaign ads, facial displays, and the like. Despite the tremendous amount of resources devoted to designing and administering survey experiments, it has been a mystery as to whether the findings generated by survey experiments correspond to the political world. The results presented here should be encouraging to anyone devoted to the scientific study of politics because they suggest that what occurs in survey experiments resembles what takes place in the real world.
Although there was a discrepancy between the size of survey treatment effects and the general population in our natural experiment, we observed correspondence exactly where one would expect to find it—among those who were most likely to be exposed to media messages about the two government announcements. To be sure, there was some drop-off. The treatment effects in the experiments were nearly always larger than what was observed in the natural settings. Nevertheless, if researchers consider the possible sources of attenuation and carefully interpret the meaning of significant treatment effects, survey experiments will continue to be an important tool for studying public opinion. Indeed, we believe that one of the most promising ways to learn about the sources of attenuation is through the continued use of experiments.
As for the weaknesses of this study, we highlight two issues. The first pertains to the nature of the samples used in our analyses. The two Polimetrix surveys are convenience samples, made up of individuals who volunteer for research. These surveys are intended to be representative and the firm attempts to match respondents to the U.S. population, but the Polimetrix surveys are not strict probability samples. Despite this potential limitation, respondents in these surveys represent a broad cross-section of people (see online Appendix for details). Moreover, recent research has found lower levels of satisficing in Internet samples, which may improve the quality of those data vis-à-vis telephone surveys (Weisberg Reference Weisberg2005).Footnote 34
The second and, in our view, more serious flaw is the limited statistical power in our natural experiments. As a result of this weakness, the reader may be left with some doubt as to the credibility of the null findings reported in Studies 1 and 2. Unfortunately, there is little a researcher can do to improve statistical power after a study has been fielded. Instead, we hope future scholars will learn from the drawbacks of this study. In particular, researchers who are interested in comparing treatment effects across different settings (e.g., survey experiment and natural world) should use large samples in order to conduct the requisite subgroup analyses. This is especially true when the expected effects are small (O'Keefe Reference O'Keefe2007) or when they involve interactive specifications (McClelland and Judd Reference McClelland and Judd1993). In general, statistical power deserves more attention in studies of public opinion (see Zaller Reference Zaller2002).
When it comes to the theoretical issues at stake, we are less sanguine. Political knowledge has been described as the “the anchor that tethers attitudes to each other, to behavioral intentions, and to the empirical world” (Delli Carpini Reference Delli Carpini, Borgida, Federico and Sullivan2009, 27). Although our survey experiments give the impression of a “rational public,” one that reacts to new information in a sensible way (e.g., Page and Shapiro Reference Page and Shapiro1992), we found less support for this proposition when we examined public opinion in the natural world. And, yet, the two government announcements we examined are precisely the sort of news events that ought to create an informed public. From what or whom, then, does the public learn? Presumably from episodic policy debates, such as the 2009 debate over health care reform, and from elections, when candidates announce various prescriptions for change. However, communication in these situations often consists of ideological rhetoric and stark predictions (Jerit Reference Jerit2009; Jerit, Kuklinski, and Quirk Reference Jerit, Kuklinski, Quirk, Borgida, Sullivan and Federico2009)—hardly the stuff of enlightened deliberation (e.g., Barabas Reference Barabas2004; Jacobs, Cook, and Delli Carpini Reference Jacobs, Cook and Delli Carpini2009; Luskin, Fishkin, and Jowell Reference Luskin, Fishkin and Jowell2002). Even if elite rhetoric was of higher quality, citizens who enter campaigns and debates without any contextual understanding because they have not routinely followed the news might not make optimal choices. It becomes essential, then, to conduct the kinds of comparisons we do here, if only to place experimental research in context and to better understand the public's true capabilities.
APPENDIX
In this Appendix, we provide details on response rates, question order, and the original conditions in the KN survey. Additional information about the methodology underlying each survey, sample characteristics, randomization, and attrition are found in the online Appendix.
Response Rates
The cross-sectional survey on the Medicare announcement was conducted by Knowledge Networks (KN), an Internet opinion polling firm. To select a sample, KN identified potential respondents from a nationally representative, probability-based web panel. Between March 2 and March 10, 2007, KN completed 805 interviews out of 1,143 eligible respondents who were contacted for an interview. This results in a 70.4% completion rate. Although the American Association for Public Opinion Research (AAPOR) response rate standards have not been formally established for web panels, the completion statistic corresponds to AAPOR Response Rate 3. In the second wave of the survey, between April 26, 2007 and May 3, 2007, a new cross-section of 817 respondents completed interviews out of 1,143 eligible who were contacted (817/1,143 = 71.5%).
For the second survey on Medicare, the authors contracted with Polimetrix (which subsequently became known as YouGov/Polimetrix) to conduct a panel survey during the spring of 2007. The first wave was conducted from March 1 to 21, 2007. Polimetrix interviewed thousands of respondents from their panel—a pool of several hundred thousand individuals who volunteered or were recruited to participate in occasional online polls. For the second wave from April 26 to May 16, 2007, Polimetrix reinterviewed 64% of the respondents who had previously completed wave 1 of this study. Detailed response rates are not available.
The immigration study was conducted as a part of the Cooperative Campaign Analysis Project (CCAP), which is a six-wave panel study with an oversample in contested battleground and early primary states (FL, IA, MN, NV, WI, NH, NM, OH, PA). In that sense, the CCAP sample more closely represents states with competitive elections rather than the entire nation. There was a baseline survey in December 2007, with subsequent panel waves in January, March, September, October, and November 2008. The analyses in this study employ 1,039 respondents from the September and October waves. Detailed response rates are not available.
Question Order
The outcome measures are asked relatively soon after the treatments, although there is variation on this dimension across our three surveys. In the KN surveys (Study 1), the belief question is asked immediately after the treatment or with a different question in between, depending on a random rotation in the questionnaire format. The next question was the knowledge item, and the policy preference item was either the fourth or fifth question following the treatment (again depending on the randomization pattern). In Polimetrix (Study 1), the belief question was either the third or fourth question after the treatment, the knowledge item was five questions later (i.e., 8 or 9 questions after the treatment), and the policy preference measure appeared two questions after the knowledge question (i.e., 11 questions after the treatment). Finally, in the CCAP survey (Study 2), the knowledge question appeared immediately after the treatment. The belief question followed the knowledge item.
Experimental Conditions in the Knowledge Networks Study
The KN study divides a Time-sharing Experiments in the Social Sciences (TESS) survey with 1,622 subjects into two parts (see schematic below). Half of the subjects (n = 805) were randomly selected to be interviewed about 1 month prior to the release of the trust fund report. The other half was interviewed after the event.
Two-Wave Cross-sectional Design (TESS/Knowledge Networks Data)

Respondents were randomly divided into four groups. The first (n = 206, the control condition) was asked a series of questions about Medicare without being given any information about the exhaustion dates of the two programs. Respondents in the remaining treatment conditions were exposed to varying amounts of policy-relevant information before answering the outcome measures. People in the second condition (n = 202) were shown information about the fiscal status of Medicare. Those in the third condition (n = 196) were provided information about Social Security, whereas those in the fourth group (n = 201) received information about both Medicare and Social Security. The last condition mimicked actual coverage of the trustee's report, which highlighted the fact that Medicare's trust fund was projected to be exhausted in 2018 compared with the date of 2040 for Social Security. Because we did not know how the report would be covered by news organizations, we created multiple treatment conditions, some with partial date information (e.g., conditions 2 and 3 at t 1).
Much as one might expect, respondents who were given the exhaustion date of each program separately performed no better than the control group on the knowledge question. In other words, there are no significant differences in knowledge or beliefs in comparisons of condition 2 versus condition 1 or condition 3 versus condition 1 (at time 1). This pattern confirms that our central manipulation—providing both dates—worked as intended. It also allowed us to expand the size of the control group by combining the conditions with partial information with the original control condition (for a similar approach, see Chong and Druckman Reference Chong and Druckman2007, 649, note 21). We used the combined conditions throughout the entire analysis of the KN survey.Footnote 35



Comments
No Comments have been published for this article.