


Introduction
Schizophrenia is a severe, chronic mental disorder characterized by a complex and heterogeneous clinical presentation, including disturbances in thought, perception, emotion, and behavior, as well as significant cognitive and functional deficits that impair daily functioning [Reference Luo, Gao, Guo, Han, Song and Su1]. Currently, schizophrenia diagnosis is based on DSM-5 and ICD-11 criteria and relies on clinical presentation, without the routine use of established biological markers [Reference Tandon, Gaebel, Barch, Bustillo, Gur and Heckers2]. This limits diagnostic objectivity and complicates differentiation from other psychiatric disorders with overlapping symptomatology [Reference Foteinopoulou and Patras3, Reference Sharaev, Malashenkova, Maslennikova, Zakharova, Bernstein and Burnaev4]. This is particularly relevant in early disease stages, especially during first-episode psychosis (FEP), where identifying individuals at risk of developing schizophrenia may influence disease course and prognosis. Early diagnosis and intervention are associated with improved functional outcomes, reduced hospitalization rates, and more favorable long-term prognosis [Reference Ferrara, Franchini, Funaro, Cutroni, Valier and Toffanin5]. Consequently, there is an increasing need to identify objective diagnostic biomarkers to support early clinical intervention [Reference Robb, McInnes and Califf6, 7].
According to the Biomarkers, Endpoints, and other Tools (BEST) framework, a biomarker is defined as an objective, measurable indicator of biological processes, pathogenic processes, or responses to an intervention, while a diagnostic biomarker enables the detection or confirmation of a disease or its subtype [7, Reference Califf8]. Despite extensive research across multiple modalities, including molecular, genetic, neuroimaging, and electrophysiological markers, their clinical utility at the individual patient level in psychiatry remains limited, hindering implementation in routine clinical practice [Reference Sharaev, Malashenkova, Maslennikova, Zakharova, Bernstein and Burnaev4].
In this context, electroencephalography (EEG) remains a key area of investigation as a noninvasive, accessible method for measuring cortical electrical activity [Reference Saha, Park, Geem and Singh9]. Resting-state EEG is particularly relevant, as it does not require active patient engagement and offers relatively standardized acquisition conditions, facilitating comparability across studies. Quantitative EEG (qEEG) enables the extraction of numerical parameters of brain activity [Reference Kopanska, Ochojska, Trojniak, Sarzynska and Szczygielski10]. In schizophrenia research, findings include increased delta and theta power and reduced alpha activity, indicating neurophysiological alterations, although these changes are neither specific nor consistently observed across all patients [Reference Yun11]. At the same time, conventional EEG remains partially subjective and susceptible to artifacts, limiting its utility as a standalone diagnostic biomarker [Reference Rahul, Sharma, Sharma, Nanda and Sarkar12].
The development of artificial intelligence (AI) methods, including machine learning (ML) and deep learning (DL), has enabled the analysis of complex, high-dimensional EEG data and the identification of patterns not accessible to conventional analytical approaches [Reference Baydili, Tasci and Tasci13]. Despite the high reported performance of AI models in schizophrenia diagnosis, these results are highly dependent on validation strategies and the characteristics of the input data [Reference Bradshaw, Huemann, Hu and Rahmim14]. In particular, inadequate data separation, including the use of segment-wise rather than subject-wise approaches, may lead to data leakage and inflated classification performance [Reference Bradshaw, Huemann, Hu and Rahmim14]. Additionally, small sample sizes, lack of external validation, and heterogeneity in preprocessing and feature extraction methods limit comparability across studies and hinder assessment of clinical utility [Reference Baydili, Tasci and Tasci13]. Consequently, interpretation of AI model results requires careful consideration of the risk of bias and methodological quality [Reference Gashkarimov, Sultanova, Efremov and Asadullin15].
In this context, systematic and structured evaluation of study quality is essential. The PROBAST (Prediction model Risk Of Bias Assessment Tool) provides a standard framework for assessing risk of bias in prediction model studies. At the same time, its extension, PROBAST+AI, was developed to address challenges specific to AI-based methods [Reference Moons, Damen, Kaul, Hooft, Andaur Navarro and Dhiman16]. To the authors’ knowledge, no prior systematic review has examined schizophrenia diagnosis using resting-state EEG and AI methods while incorporating study quality assessment with PROBAST+AI. Addressing this gap is critical, as rigorous evaluation of risk of bias is necessary for valid interpretation of findings and their potential translation into clinical practice.
This systematic review aims to evaluate the diagnostic performance of artificial intelligence-based models that analyze resting-state EEG for schizophrenia diagnosis and to critically assess the methodological quality and risk of bias of the included studies using the PROBAST+AI framework. The overarching objective is to determine the clinical utility of EEG as a diagnostic biomarker for schizophrenia.
Methodology
PICOTS framework and research questions
-
P (Population): Adolescents and adults with schizophrenia or first-episode psychosis and healthy controls.
-
I (Index model): Artificial intelligence-based diagnostic models using resting-state EEG data.
-
C (Comparator model): No comparator model was prespecified; studies comparing different machine-learning or deep-learning models were eligible.
-
O (Outcome): Diagnostic classification of schizophrenia or first-episode psychosis versus healthy control status, established using recognized diagnostic criteria. Diagnostic performance measures, including accuracy, sensitivity, specificity, and AUC, were extracted as model-performance outcomes.
-
T (Timing): Cross-sectional diagnostic classification based on resting-state EEG acquired in relation to the diagnostic assessment; studies predicting future outcomes were excluded.
-
S (Setting): Clinical or research datasets without geographical restriction.
Intended use
Methodological appraisal of resting-state EEG-based AI models developed to distinguish schizophrenia or first-episode psychosis from healthy controls and assessment of their potential clinical applicability.
Research questions
Q1. What Artificial Intelligence techniques are used in the analysis of resting-state EEG for the diagnosis of schizophrenia and first-episode psychosis?
Q2. What EEG signal features (e.g., frequency-domain, time–frequency, nonlinear, connectivity) are utilized by AI models?
Q3. What diagnostic performance do AI models achieve in differentiating patients with schizophrenia or first-episode psychosis from healthy controls, particularly in terms of accuracy, sensitivity, specificity, and AUC?
Q4. How do validation strategies, including subject-wise versus segment-wise data splitting, cross-validation, and external validation, influence the reported diagnostic performance of the models?
Q5. What is the risk of bias in published original studies as assessed using the PROBAST+AI tool?
Q6. Does the available evidence, considering both diagnostic performance and study quality, support the use of AI-analyzed resting-state EEG as a diagnostic biomarker for schizophrenia?
Search strategy
The systematic review was conducted in accordance with the PRISMA 2020 (Preferred Reporting Items for Systematic Reviews and Meta-Analyses) guidelines [Reference Page, Moher, Bossuyt, Boutron, Hoffmann and Mulrow17]. The protocol for this systematic review was not prospectively registered. The literature search was performed in the following databases: PubMed, Scopus, Web of Science, MEDLINE, and Google Scholar. The search included English-language manuscripts published between 2016 and March 2026. The following terms were used with Boolean operators: electroencephalography, EEG, quantitative EEG, qEEG, schizophrenia, first psychotic episode, artificial intelligence, machine learning, deep learning, neural network. An example search query structure was as follows:
“electroencephalography” OR “EEG” OR “quantitative EEG” OR “qEEG”
AND
“Schizophrenia” OR “first episode psychosis”
AND
“Artificial Intelligence” OR “machine learning” OR “deep learning” OR “neural network”
Study inclusion and exclusion criteria
The inclusion and exclusion criteria for studies included in the systematic review are presented in Table 1.
Inclusion and exclusion criteria for studies in the systematic review

Table 1. Long description
The table is divided into two main columns.
Inclusion criteria (left column):
* Patients with schizophrenia or first-episode psychosis (D S M 5 or I C D 11).
* Adolescents and adults.
* Presence of a healthy control group.
* Resting-state E E G.
* Use of artificial intelligence methods (machine learning or deep learning) for diagnostic classification.
* Studies evaluating E E G as a diagnostic biomarker.
* Peer-reviewed articles, full-text available.
* English language, published between 2016 and March 2026.
Exclusion criteria (right column):
* Studies not related to schizophrenia or first-episode psychosis.
* Pediatric populations (less than 10 years).
* Task-based E E G or event-related potentials.
* Studies not using A I or E E G as the main analytical component.
* Studies focusing on prognosis, treatment response, or disease course.
* Purely technical or statistical studies without clinical relevance.
* Non-peer-reviewed publications (conference abstracts, letters, commentaries, books, preprints).
* Non-English articles.
Abbreviation: AI, artificial intelligence; EEG, electroencephalography; DSM-5, Diagnostic and Statistical Manual of Mental Disorders 5; ICD-11, International Classification of Diseases, 11th Revision.
Research selection process
A total of 43 original research articles were included in the systematic review. Additionally, review articles on the application of artificial intelligence methods in EEG analysis in patients with schizophrenia were identified. These publications were used to support the identification of additional primary studies and to provide contextual background for the topic.
From each included study, the following information was extracted:
-
- characteristics of the study population,
-
- type of dataset (public vs. private),
-
- EEG acquisition parameters,
-
- types of EEG features (frequency-domain, time–frequency, nonlinear, connectivity, mixed),
-
- type of AI model used,
-
- validation strategy (e.g., cross-validation, presence of external validation, data splitting approach),
-
- data splitting method (subject-wise vs. segment-wise),
-
- diagnostic performance metrics (accuracy, sensitivity, specificity, AUC).
The study selection process is presented in Figure 1.
PRISMA 2020 flow diagram illustrating the study selection process for the systematic review of artificial intelligence-based analysis of resting-state EEG in schizophrenia.

Figure 1. Long description
The flowchart is organized into three vertical phases.
1. Identification Phase:
- Top-left box: Records identified from: Databases (n = 987).
- An arrow points right to: Records removed before screening: Duplicate records removed (n = 84).
- An arrow points down to the next phase.
2. Screening Phase:
- Records screened (n = 903). An arrow points right to: Records excluded (n = 642).
- An arrow points down to: Reports sought for retrieval (n = 261). An arrow points right to: Reports not retrieved (n = 15).
- An arrow points down to: Reports assessed for eligibility (n = 246).
- An arrow points right to a detailed exclusion box: Reports excluded: n = 203. Reasons include: Not resting-state E E G (n = 21), No control group (n = 20), Non-diagnostic study aim (n = 26), Ineligible population (n = 34), Insufficient reporting of diagnostic performance metrics (n = 25), Unclear methods (n = 33), Conference abstracts / brief reports = (15), No A I-based methods (n = 12), and Other (n = 17).
3. Included Phase:
- A final arrow points down to the bottom box: Studies included in review (n = 43).
Methodology for risk of bias assessment using PROBAST+AI
Risk of bias was assessed using PROBAST+AI, a structured, judgment-based tool rather than a numerical scoring system [Reference Moons, Damen, Kaul, Hooft, Andaur Navarro and Dhiman16]. The tool separately evaluates the quality of model development and the risk of bias in model evaluation across four domains: participants and data sources, predictors, outcome, and analysis. It includes 34 signaling questions, of which 16 concern model development and 18 concern model evaluation. The questions were answered as “yes,” “probably yes,” “probably no,” “no,” “no information,” or, where appropriate, “not applicable.” A negative response indicated a potential methodological concern but did not automatically determine the domain-level or overall judgment, whereas an “unclear” judgment was used when reporting was insufficient to permit a reliable assessment. Domain-level and overall judgments were classified as low, high, or unclear. PROBAST+AI does not specify universal numerical cutoffs for sample-size adequacy. Therefore, sample size and potential overfitting were considered in relation to the number of independent participants, model complexity, validation strategy, and the reported methods used to limit overfitting. Data leakage was defined as the inadvertent use of information from model development during model evaluation, including overlap of participants or their EEG segments between training and test sets. External validation was defined as model evaluation using participant data not involved in model development or internal validation. Overall judgments reflected the integrated assessment of all domains; consequently, the absence of external validation alone did not determine the overall risk-of-bias category. Study-level domain judgments for model development and model evaluation, together with overall risk-of-bias judgments and concise rationales, are provided in Supplementary Table S1, while detailed guidance on applying individual criteria is available in the PROBAST+AI publication and its Explanation and Elaboration material [Reference Moons, Damen, Kaul, Hooft, Andaur Navarro and Dhiman16]. The PROBAST+AI assessment workflow applied in this review, including the separate assessment of model development, model evaluation, and applicability and the integration of domain-level judgments, is summarized in Figure 2.
PROBAST+AI assessment workflow used to derive domain-level and overall judgments for model development, model evaluation, and applicability.

Figure 2. Long description
The flowchart consists of five main horizontal stages connected by downward-pointing arrows.
1. Top stage: Specify the assessment purpose. This involves defining the review question and intended model use P I C O T S, and assessing each model separately.
2. Second stage: Classify the study. Options include model development, model evaluation, or both development and evaluation.
3. Third stage: This stage splits into two parallel boxes.
* Left box: Model development. Includes 16 signalling questions across four domains: participants and data sources, predictors, outcome, and analysis. The domain rating focuses on concern regarding quality.
* Right box: Model evaluation. Includes 18 signalling questions across the same four domains. The domain rating focuses on risk of bias.
* Below these boxes, a list of possible responses is provided: yes, probably yes, probably no, no, no information, and not applicable.
4. Fourth stage: Applicability. Concern is assessed separately for development and evaluation in the first three domains only: participants and data sources, predictors, and outcome.
5. Fifth stage: Integrate domain judgments. This step derives separate overall judgments for model-development quality, model-evaluation risk of bias, and applicability. It concludes with three color-coded outcome boxes: L O W in green, U N C L E A R in yellow, and H I G H in red. A legend at the bottom notes that low equals low concern or risk (favourable) and high equals high concern or risk.
A final footer note states: Judgment-based assessment, no numerical score, a negative signalling response does not automatically determine a high domain or overall judgment.
Results
The results section was organized as follows: first, the characteristics of the study populations were presented, including sample sizes and data sources. This was followed by a synthesis of EEG feature types and the applied machine learning and deep learning methods. Next, the reported diagnostic performance metrics (accuracy, sensitivity, and specificity) were summarized, and finally, the validation strategies used across studies were analyzed.
In some of the analyzed studies, multiple models and classifier configurations were compared. In this review, models reported by the authors as achieving the highest classification performance were included, unless a different reference model was explicitly specified. This approach was adopted to ensure consistency in data extraction and to reflect the best-performing scenario reported in each study.
Characteristics of included studies and a summary of AI-based EEG analysis methods and diagnostic performance are presented in Table 2.
Characteristics of included studies and summary of AI-based EEG analysis methods and diagnostic performance

Table 2. Long description
The table consists of 14 columns: References, Data source type, Dataset name, Patients (n), H C (n), Population, Electrodes, E E G features, A I approach, A I model, Sensitivity (%), Specificity (%), A U C, and Accuracy (%). Key data points include:* Latreche et al. (2023): Used a 1D-C N N on the I P I N dataset (14 patients, 14 H C) with 9 electrodes, achieving 99.18% accuracy.* Jangde and Verma (2023): Used 1D C N N plus C B A M on Moscow/I B I P datasets, achieving 98.45% accuracy.* Al Fahoum and Zyout (2023): Used ResNet101 on the Moscow dataset, achieving 99.80% accuracy.* Soria et al. (2023): A large private study (312 patients, 320 H C) using X G B, achieving 94.00% accuracy.* Tikka et al. (2023): Used S V M with 256 electrodes, achieving 100% sensitivity but lower specificity (66.67%) and 78.95% accuracy.* Khare et al. (2023): Used SchizoNET on multiple datasets, achieving 99.74% accuracy.* Sarisik et al. (2022): A private study (250 patients, 245 H C) using Linear S V M, achieving 72.70% accuracy.* Yin et al. (2022): Two studies on F E P populations using 3D-A G C N and E F C-G C N, achieving 87.64% and 90.01% accuracy respectively.* Bagherzadeh et al. (2022): Used EfficientNetB0-L S T M on the I P I N dataset, achieving 99.90% accuracy.* Zhou et al. (2022): Used Linear S V M on OpenNeuro data for F E P, achieving 61.00% accuracy.Common A I approaches include Deep Learning (D L), Machine Learning (M L), and mixed methods. Populations are primarily Schizophrenia (S C Z) or First-Episode Psychosis (F E P). Data sources are categorized as public (pb) or private (pr).
Key data points include:
* Latreche et al. used a 1D C N N on the I P I N dataset (14 patients, 14 H C) achieving 99.18% accuracy.
* Tikka et al. used S V M on a private dataset with 256 electrodes, achieving 100% sensitivity but lower specificity at 66.67%.
* Several studies utilize the Moscow dataset or I P I N public datasets (pb), often employing Deep Learning (D L) models like C N N, ResNet, or L S T M.
* Populations are primarily Schizophrenia (S C Z) or First-Episode Psychosis (F E P).
* Accuracy ranges from a low of 61.00% (Zhou et al. using Microstates and Linear S V M) to near-perfect scores above 99% in multiple D L studies (e.g., Guo et al., Aich et al., and Xiong et al.).
* E E G features analyzed include Mixed, Frequency, Connectivity, Time-frequency, Nonlinear, and Microstates.
* A I models vary from traditional Machine Learning (M L) like S V M and Random Forest to advanced D L architectures like 3D A G C N and SchizoNET.
Abbreviations: 1D-CNN, one-dimensional convolutional neural network; 3D-AGCN, 3D adaptive graph convolutional network; 3D-CNN, three-dimensional convolutional neural network; 3DCNN (ES3DCFN + NTRN), 3D convolutional neural network with enhanced spatial 3D convolutional feature network and neural temporal relation network; ANFIS, Adaptive Neuro-Fuzzy Inference System; ASBO, Adaptive Symbiotic Organisms Search; CBAM, Convolutional Block Attention Module; CHIRP, Composite Hypercube on Iterated Random Projection (classifier); CNN (SchizoNET), Convolutional Neural Network (custom architecture: SchizoNET); CNN-LSTM, Convolutional Neural Network combined with Long Short-Term Memory; DenseNet169, Densely Connected Convolutional Network (169 layers); DL, Deep Learning; EEG, electroencephalography; EEGNet, Compact Convolutional Neural Network architecture designed for EEG data; EFC-GCN, Enhanced Functional Connectivity Graph Convolutional Network; EfficientNetB0/B3, EfficientNet (compound scaling Convolutional Neural Network architecture); EfficientNetB0-LSTM, Efficient NetB0 combined with Long Short-Term Memory; FEP, first-episode psychosis; GCN/EEG_TL, Graph Convolutional Network with EEG Transfer Learning; GoogLeNet, Inception Network (GoogLeNet architecture); GPC, Gaussian Process Classifier; IPIN, Institute of Psychiatry and Neurology EEG dataset; KNN, k-nearest neighbors; LDA, linear discriminant analysis; LightGBM, Light Gradient Boosting Machine; ML, Machine Learning; Moscow dataset, M.V. Lomonosov Moscow State University EEG dataset; NR, not reported; Pb, public dataset; pr, private dataset; RBF, Radial Basis Function; RDCGRU, Residual Dynamic Convolutional Gated Recurrent Unit; ResNet-50, Residual Neural Network (50 layers); ResNet101, Residual Neural Network (101 layers); RNN-LSTM, Recurrent Neural Network with Long Short-Term Memory; SCZ, schizophrenia; SVM, support vector machine; Two-branch CNN, Dual-branch Convolutional Neural Network; VGG16, Visual Geometry Group Network (16 layers); XGB, Extreme Gradient Boosting (XGBoost).
Size of study groups
A total of 43 original studies were included in the systematic review. Most analyses focused on patients with schizophrenia (86.05%; n = 37), while a smaller proportion included individuals with first-episode psychosis (FEP) (13.95%; n = 6). In total, 3,420 patients and 3,164 healthy controls were included, resulting in a combined sample size of 6,584 participants. The mean patient sample size was 79.53 (SD ± 88.39; median 53; IQR 14–82.5; range 14–332). The largest sample was reported in the study by Jiang et al. [Reference Jiang, Chen, Sun, Liang, Xue and Zhao36], which included patients from three independent cohorts. Substantial heterogeneity in sample sizes across studies was observed. Notably, 32.56% of studies included minimal sample sizes (n = 14), indicating a predominance of small cohorts in the included literature.
Datasets used
In most studies, publicly available datasets were used (69.77%; n = 30), with 23.26% (n = 10) of studies relying on more than one dataset. The most frequently used source was the dataset from the Institute of Psychiatry and Neurology in Warsaw (Poland) (39.53%; n = 17), followed by the publicly available EEG dataset from M.V. Lomonosov Moscow State University, Moscow, Russia (23.26%; n = 10). Less frequently used were datasets from the Institute of Biocybernetics and Biomedical Engineering (IBIB PAN) (6.98%; n = 3) and datasets available on the Kaggle platform (6.98%; n = 3). The two most commonly used datasets were employed in a total of 62.79% of all analyzed studies. The repeated use of the same public datasets indicates limited data diversity in the evaluated models.
EEG features
The most frequently analyzed EEG features were mixed features (n = 14), followed by time-frequency features (n = 8), frequency-domain features (n = 7), and connectivity measures (n = 6). Nonlinear features (n = 4), microstates (n = 2), and network-based approaches (n = 1) were used less frequently.
Artificial intelligence approach
In terms of analytical approaches, deep learning (DL) models predominated, accounting for 46.5% (n = 20). Classical machine learning (ML) methods comprised 39.5% (n = 17), while hybrid approaches represented 14.0% (n = 6).
Machine learning
Among ML approaches, SVM variants predominated (52.9%, n = 9), followed by boosting methods (17.6%, n = 3) and other classical algorithms (Table 2).
Deep learning
In contrast to ML, DL-based approaches demonstrated greater architectural heterogeneity. Convolutional neural networks (CNNs) were the most commonly used (60.0%; n = 12), including both standard architectures (e.g., VGG, ResNet) and models tailored for EEG analysis (e.g., EEGNet, SchizoNet, and 3D-CNN). Other approaches, such as recurrent neural networks (RNN/LSTM/GRU), graph neural networks (GNN), and hybrid DL models, were less frequently applied.
Overall diagnostic performance of artificial intelligence models
Accuracy
Across all studies reporting accuracy (n = 42), high diagnostic performance was observed. The mean accuracy was 93.38% ± 8.90 (median = 97.20%; IQR = 92.91–99.25).
When stratified by AI approach, higher values were observed in studies using DL compared to classical ML. In the DL group (n = 20), the mean accuracy was 96.83% ± 3.98 (median = 98.73%; IQR = 95.37–99.47; range = 87.64–99.87%). In the ML group (n = 16; one ML study did not report accuracy), performance was lower, with a mean of 87.68% ± 11.40 (median = 92.96%; IQR = 80.23–95.69; range = 61.00–99.40%). Hybrid models (n = 6) also achieved high accuracy values (mean = 97.11% ± 5.56; median = 99.06%; IQR = 98.85–99.73; range = 85.80–99.97%).
Comparison of accuracy across studies is limited due to substantial heterogeneity in study populations, sample sizes, preprocessing procedures, EEG feature types, and validation strategies. Therefore, accuracy should be interpreted as a descriptive metric rather than a fully comparable measure of model performance.
Sensitivity, specificity, and AUC
Sensitivity was reported in 33 of 43 studies (76.7%), with a mean value of 92.64 (SD ± 12.14; median = 98.62; IQR = 93.49–99.36; range = 45.00–100.00). Specificity was available in 28 studies (65.1%) and had a mean of 91.24 (SD ± 11.88; median = 97.29; IQR = 90.17–99.01; range = 57.00–100.00). AUC was reported in 19 studies (44.2%), with a mean value of 0.914 (SD ± 0.105; median = 0.96; IQR = 0.855–0.99; range = 0.61–1.00). In most studies, high sensitivity and specificity values were consistent with the reported accuracy; however, the availability of these metrics was limited, particularly for AUC.
A descriptive synthesis of the diagnostic performance measures reported across the included studies, both overall and according to the AI approach used, is presented in Table 3.
Descriptive synthesis of diagnostic performance across included studies

Table 3. Long description
The table consists of six columns: Analysis, Metric or A I model type, Studies reporting the metric (n), Mean plus or minus S D, Median (I Q R), and Range.
Under the Overall diagnostic performance analysis:
- Accuracy (percent): 42 studies, mean 93.38 plus or minus 8.90, median 97.20 (92.91 to 99.25), range 61.00 to 99.97.
- Sensitivity (percent): 33 studies, mean 92.64 plus or minus 12.14, median 98.62 (93.49 to 99.36), range 45.00 to 100.00.
- Specificity (percent): 28 studies, mean 91.24 plus or minus 11.88, median 97.29 (90.17 to 99.01), range 57.00 to 100.00.
- A U C: 19 studies, mean 0.914 plus or minus 0.105, median 0.96 (0.855 to 0.99), range 0.61 to 1.00.
Under the Accuracy by A I approach analysis:
- Deep learning: 20 studies, mean 96.83 plus or minus 3.98, median 98.73 (95.37 to 99.47), range 87.64 to 99.87.
- Machine learning: 16 studies, mean 87.68 plus or minus 11.40, median 92.96 (80.23 to 95.69), range 61.00 to 99.40.
- Hybrid models: 6 studies, mean 97.11 plus or minus 5.56, median 99.06 (98.85 to 99.73), range 85.80 to 99.97.
a One of the 17 studies using classical machine learning did not report accuracy. AUC values were analyzed on the 0–1 scale; when more than one AUC was reported, the highest value was used in accordance with the predefined extraction rule.
Validation of artificial intelligence models in the analyzed studies
Across the 43 included original studies, a range of AI model validation strategies was applied, with partial overlap as some studies used more than one method. The most common approach was k-fold cross-validation, reported in 76.7% of studies (n = 33). Hold-out validation was used less frequently (n = 10), while more rigorous methods, such as leave-one-out cross-validation and leave-one-subject-out cross-validation (LOOCV/LOSOCV), were applied in only 9.3% of studies (n = 4). External validation was reported in ~4.7% (n = 2) of cases (Table 4). In addition, 9.3% of studies (n = 4) did not clearly report the validation approach.
Validation strategies and data splitting approaches across included studies

Table 4. Long description
The table consists of five columns: References, Train/test split, Validation method, Subject-wise split, and External validation. Key entries include:* Latreche et al.: 80/20 split, 10-fold C V plus hold-out, Unclear subject-wise split, No external validation.* Al Fahoum and Zyout: 70/15/15 split, 5-fold C V plus L O O C V, Unclear subject-wise split, No external validation.* Guo et al.: Multiple splits (13/14, 9/10, and 10-fold C V), Subject-independent and dependent C V, Yes/Unclear subject-wise split, No external validation.* Sahu and Jain: No classic split, L O S O C V, Yes subject-wise split, No external validation.* Chien et al.: Training on Dataset 2 and testing on Datasets 1 and 3, 10-fold C V plus independent external testing, Yes subject-wise split, Yes external validation.* Jiang et al.: No classic split, 5-fold C V plus external cross-site validation, Yes subject-wise split, Yes external validation.* Aich et al.: M S U training/validation/test and Rep O D 80/20, Hold-out/train-test split, No subject-wise split, No external validation.* Luján et al.: 70/30 split, K-fold-C V, Yes subject-wise split, No external validation.* Xiong et al.: 80/20 split, L O O C V, Yes in L O O C V and no in within-patient, No external validation.* Zhou et al.: 80/20 split, 5-fold C V on training set only, Yes subject-wise split, No external validation.Common trends show that most studies use an 80/20 or 70/30 split, frequently employ 5-fold or 10-fold C V, and rarely utilize external validation.
Key entries include:
* Latreche et al.: 80/20 split, 10-fold C V plus hold-out, Unclear subject-wise split, No external validation.
* Al Fahoum and Zyout: 70/15/15 split, 5-fold C V plus L O O C V, Unclear subject-wise split, No external validation.
* Guo et al.: Multiple datasets with various splits (13/14, 9/10, and 10-fold C V), Subject-independent C V plus subject-dependent 10-fold C V.
* Sahu and Jain: No classic split, L O S O C V, Yes for subject-wise split, No external validation.
* Chien et al.: Training on Dataset 2 and testing on Datasets 1 and 3, 10-fold C V plus independent external testing, Yes for both subject-wise and external validation.
* Jiang et al.: No classic split, 5-fold C V plus external cross-site validation, Yes for both subject-wise and external validation.
* Aich et al.: Training/validation/test split for M S U and 80/20 for RepOD, Hold-out/train-test split, No subject-wise split.
* Zhou et al.: 80/20 split, 5-fold C V on training set only, Yes for subject-wise split, No external validation.
Common trends show a majority of studies using 80/20 or 70/30 splits and 5 or 10-fold C V. External validation is rare, reported only by Chien et al. and Jiang et al. Abbreviations used: C V for cross-validation, L O O C V for leave-one-out cross-validation, and L O S O C V for leave-one-subject-out cross-validation.
Abbreviations: CV, cross-validation; LOOCV, leave-one-out cross-validation; LOSOCV, leave-one-subject-out cross-validation.
Analysis of data splitting strategies (train/test split) also revealed methodological heterogeneity. The most common approach was an 80/20 split, used in 23.3% of studies (n = 10), followed by a 70/30 split in 11.6% (n = 5), while three-way splits (e.g., 70/10/20 or 70/15/15) were applied in 9.3% (n = 4). Subject-wise data splitting was explicitly reported in 44.2% of studies (n = 19), whereas 34.9% (n = 15) did not use this approach, and in 16.3% (n = 7) it remained unclear. In descriptive analysis, studies implementing subject-wise splitting showed lower mean accuracy compared to those that did not (88.22% vs. 98.14%). These findings should be interpreted with caution, as multiple validation strategies were often applied within the same study.
The validation strategies used in the included studies are summarized in Table 4.
Assessment of the risk of bias according to the PROBAST+AI protocol
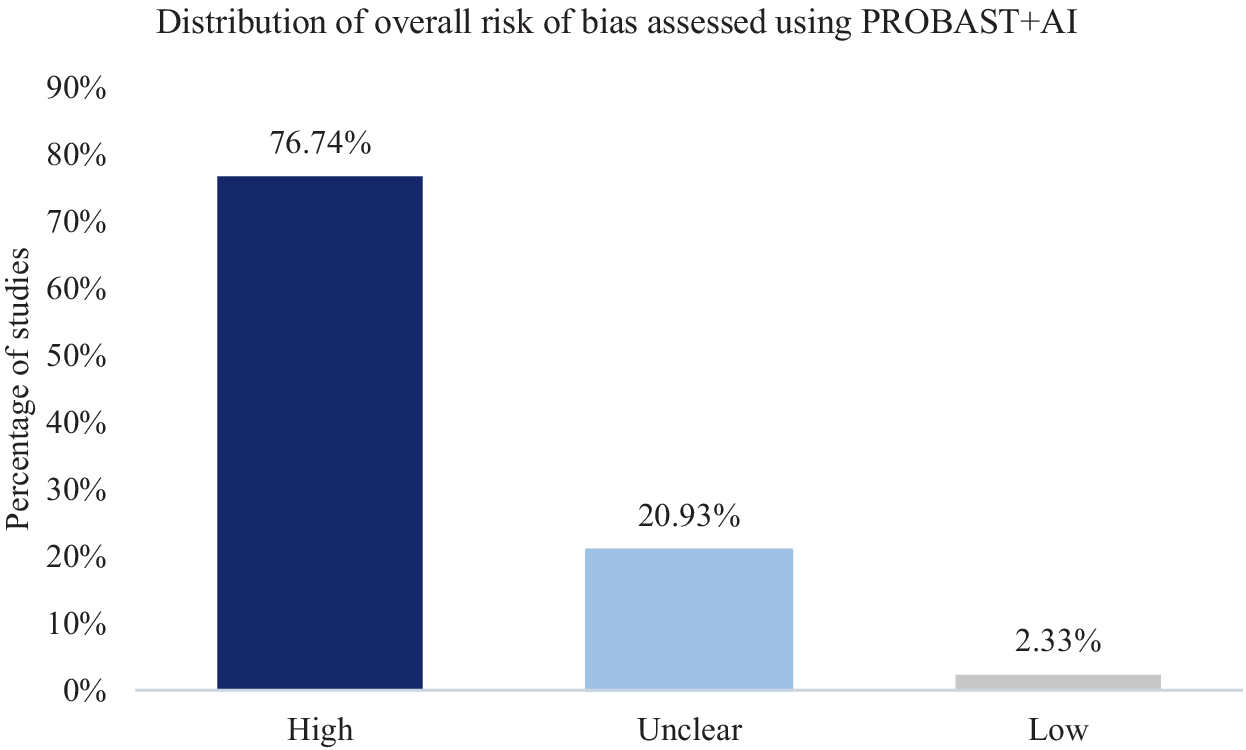
All studies included in the systematic review were assessed using the PROBAST+AI framework. Of the 43 analyzed studies, 76.74% (n = 33) were classified as having high overall risk of bias, 20.93% (n = 9) as unclear, and only 2.33% (n = 1) as low overall risk of bias (Figure 3).
Distribution of overall risk of bias assessed using PROBAST+AI (n = 43).

A complete summary of overall risk of bias assessments for the included studies is presented in Table 5.
Overall risk-of-bias judgments and principal methodological concerns across included studies

Table 5. Long description
The table consists of three columns: References, Overall risk of bias, and Identified methodological problems. It lists 43 studies.* Latreche et al. [18]: High risk. Small sample bias, overfitting risk, data leakage risk, no external validation.* Jangde and Verma [19]: High risk. Small sample bias (partially), overfitting risk, insufficient external validation.* Al Fahoum and Zyout [20]: High risk. Small sample bias, overfitting risk, data leakage risk, no external validation.* Supakar et al. [21]: High risk. Small sample bias, overfitting risk, data leakage risk, no external validation.* Soria et al. [22]: High risk. No external validation, overfitting risk.* Zan [23]: High risk. Small sample bias, overfitting risk, data leakage risk, no external validation.* Guo et al. [24]: Unclear risk. No external validation.* Sahu and Jain [25]: High risk. Small sample bias, overfitting risk, no external validation.* Soria C. [26]: Unclear risk. No external validation.* Siuly et al. [27]: High risk. Data leakage risk, no external validation, overfitting risk.* Tikka et al. [28]: High risk. Small sample bias risk, data leakage risk, no external validation, overfitting risk.* Khare et al. [29]: High risk. Small sample bias, overfitting risk, data leakage risk, no external validation.* Chien et al. [30]: Unclear risk. Small sample bias, overfitting risk.* Ravan et al. [31]: Unclear risk. No external validation, overfitting risk.* Sarisik et al. [32]: Unclear risk. No external validation.* Aslan and Akin [33]: High risk. Small sample bias risk, data leakage risk, no external validation, overfitting risk.* Yin et al. [34]: High risk. Data leakage risk, no external validation.* Yin et al. [35]: Unclear risk. No external validation.* Jiang et al. [36]: Low risk. No problems identified.* Jahmunah et al. [37]: High risk. Small sample bias, overfitting risk, data leakage risk, no external validation.* Aich et al. [38]: High risk. Small sample bias, overfitting risk, data leakage risk, no external validation.* Kripalal and Sekar [39]: Unclear risk. Small sample bias, no external validation, overfitting risk.* Hao et al. [40]: High risk. Small sample bias, no external validation, overfitting risk.* Siuly et al. [27] (repeated entry): High risk. Data leakage risk, small sample bias, no external validation, overfitting risk.* Vázquez et al. [41]: High risk. Data leakage risk, small sample bias, no external validation.* Alazzawı et al. [42]: High risk. Small sample bias, no external validation, overfitting risk, data leakage risk.* Kim et al. [43]: High risk. Small sample bias risk, data leakage risk, no external validation, overfitting risk.* Shoeibi et al. [44]: High risk. Small sample bias risk, data leakage risk, no external validation, overfitting risk.* Najafzadeh et al. [45]: High risk. Small sample bias risk, data leakage risk, no external validation, overfitting risk.* Agarwal et al. [46]: High risk. Small sample bias risk, data leakage risk, no external validation, overfitting risk.* Aziz et al. [47]: High risk. Small sample bias risk, data leakage risk, no external validation, overfitting risk.* Kang et al. [48]: Unclear risk. No external validation.* Luján et al. [49]: High risk. Data leakage risk, no external validation.* Shams and Jabbari [50]: High risk. Small sample bias risk, data leakage risk, no external validation, overfitting risk.* Grover et al. [51]: High risk. Small sample bias risk, data leakage risk, no external validation, overfitting risk.* Xiong et al. [52]: High risk. Small sample bias risk, data leakage risk, no external validation, overfitting risk.* Baradits et al. [53]: High risk. Data leakage risk, no external validation.* Kim et al. [54]: High risk. Small sample bias risk, no external validation, overfitting risk.* Bagherzadeh et al. [55]: High risk. Small sample bias risk, data leakage risk, no external validation, overfitting risk.* Polat [56]: High risk. Small sample bias risk, no external validation, overfitting risk.* Gengeç [57]: Unclear risk. No external validation, overfitting risk.* Redwan et al. [58]: High risk. Small sample bias risk, data leakage risk, no external validation, overfitting risk.* Zhou et al. [59]: High risk. Small sample bias risk, data leakage risk, no external validation, overfitting risk.
High Risk Studies:
Latreche et al., Jangde and Verma, Al Fahoum and Zyout, Supakar et al., Soria et al., Zan, Sahu and Jain, Siuly et al., Tikka et al., Khare et al., Aslan and Akin, Yin et al. [34], Jahmunah et al., Aich et al., Hao et al., Siuly et al. [27], Vázquez et al., Alazzawı et al., Kim et al. [43], Shoeibi et al., Najafzadeh et al., Agarwal et al., Aziz et al., Luján et al., Shams and Jabbari, Grover et al., Xiong et al., Baradits et al., Kim et al. [54], Bagherzadeh et al., Polat, Redwan et al., and Zhou et al. Common problems cited for these include small sample bias, overfitting risk, data leakage risk, and no external validation.
Unclear Risk Studies:
Guo et al., Bretones, Chien et al., Ravan et al., Sarisik et al., Yin et al. [35], Kripalal and Sekar, Kang et al., and Gengeç. These typically cite no external validation or overfitting risk.
Low Risk Studies:
Jiang et al. is the only study listed with a Low overall risk of bias, with no identified methodological problems listed.
The study by Jiang et al. was the only one classified as low risk of bias according to PROBAST+AI, reflecting a consistently low risk across all four model-evaluation risk-of-bias domains. The study included 522 participants from three independent datasets. A cross-site validation approach was applied, substantially reducing the risk of overfitting and enhancing the reliability of model generalizability assessment. Data splitting was performed at the participant level, minimizing the risk of data leakage, and the analytical process was coherent and aligned with the predictive objective. In addition, the use of a graph neural network architecture enabled the identification of relevant functional connectivity patterns, potentially improving model interpretability in the context of known network alterations in schizophrenia. The authors demonstrated that the importance of individual features varied across datasets, whereas theta and alpha band power were among the most stable EEG features. This rating was not attributable to external validation alone, but to the combination of a comparatively large multi-dataset sample, participant-level data separation, cross-site validation, and an analytical approach that limited the risks of data leakage and overfitting. Other studies reporting external validation retained methodological concerns in other PROBAST+AI domains, particularly regarding sample-size adequacy, potential overfitting, or incomplete reporting, and therefore did not receive a low overall risk-of-bias judgment. Nevertheless, limitations should be acknowledged. Although relatively large compared to other included studies and based on multiple datasets, the sample size remains limited for complex AI models [Reference Jiang, Chen, Sun, Liang, Xue and Zhao36]. Despite the use of cross-site validation, further evaluation in more diverse populations and real-world clinical settings is warranted [Reference Bradshaw, Huemann, Hu and Rahmim14].
Studies classified as having unclear risk of bias were primarily characterized by incomplete reporting of key methodological elements, precluding definitive assessment using PROBAST+AI. The most common issue was the lack of information on external validation or insufficient description of validation procedures [Reference Moons, Damen, Kaul, Hooft, Andaur Navarro and Dhiman16]. For example, in the study by Guo et al., results based on subject-dependent analysis may have led to inflated accuracy; however, insufficient reporting prevented confirmation of data leakage [Reference Guo, Wang, Jing and Fu24]. Similarly, Soria Bretones et al. reported results of moderate reliability, but the absence of external validation and limited description of the analytical pipeline hindered full assessment of bias [Reference Soria Bretones, Roncero Parra, Cascón, Borja and Mateo Sotos22]. Sarısık et al. applied methodologically sound analytical approaches, yet the lack of independent validation limited the evaluation of model generalizability [Reference Sarisik, Popovic, Keeser, Khuntia, Schiltz and Falkai32]. In Yin et al., key details regarding data splitting were not provided, leaving uncertainty regarding potential data leakage [Reference Yin, Chang, Zhao, Liu, Yin and Fu35]. Kripalal et al. implemented subject-wise validation; however, the absence of external validation and limited reporting of the analytical pipeline restricted comprehensive quality assessment [Reference Kripalal and Sekar39, Reference Gengeç Benli57]. In the studies by Kang et al. and Gengeç et al., models demonstrated potential predictive value, but insufficient detail regarding training and validation procedures resulted in classification as unclear [Reference Kang, Zhao, Zhao, Zhao, Dong and Zhang48]. Overall, these findings indicate that the unclear category predominantly reflected insufficient reporting rather than clearly identifiable methodological flaws.
To ensure transparency and reproducibility of the risk of bias assessment, study-level PROBAST+AI domain judgments for model development and model evaluation, together with overall risk-of-bias judgments and concise rationales, are provided in Supplementary Table S1.
Analysis of methodological problems according to PROBAST+AI
The most frequently identified issue was the lack of external validation, observed in 95.35% of studies (n = 41). The absence of external validation may lead to overestimation of model performance and precludes assessment of clinical utility, representing a major source of bias in the “analysis” domain according to PROBAST+AI [Reference Bradshaw, Huemann, Hu and Rahmim14, Reference Moons, Damen, Kaul, Hooft, Andaur Navarro and Dhiman16]. The second most common issue was the risk of data leakage, identified in 69.8% of studies (n = 30). Segment-wise data splitting was used in 58.1% of studies (n = 25). In several studies, including those by Latreche et al. and Grover et al., the authors explicitly acknowledged that segments from the same participant could be assigned to different folds, directly inflating reported accuracy [Reference Latreche, Slatnia, Kazar, Harous and Khelili18, Reference Grover, Chharia, Upadhyay and Longo51]. This indicates a lack of independence between training and testing samples and is classified as high risk of bias in the analysis domain [Reference Bradshaw, Huemann, Hu and Rahmim14]. Another frequently observed issue was the risk of overfitting, typically associated with small sample sizes and complex models, identified in 65.1% of included studies (n = 28). The analysis domain contributed most substantially to the high risk of bias across studies, reflecting the accumulation of issues related to validation, data leakage, and overfitting [Reference Bradshaw, Huemann, Hu and Rahmim14]. The participants, predictors, and outcome domains were less frequently sources of high-risk bias. Overall, the predominant issues were methodological, indicating structural limitations in study design within this field. Figure 4 illustrates the distribution of risk of bias and applicability assessments across PROBAST+AI domains, including both model development and validation stages.
Distribution of PROBAST+AI model-development quality, model-evaluation risk-of-bias, and applicability judgments across domains for model development and model evaluation. Horizontal 100% stacked bar charts present the proportion of studies rated as low, unclear, or high across individual domains (n = 43 studies).

Figure 4. Long description
A four-panel set of horizontal 100 percent stacked bar charts labeled A through D. A central legend identifies light green as Low, gray as Unclear, and dark green as High.
Panel A, model development - concern regarding quality, shows four domains:
* Participants: approximately 15 percent Low, 25 percent Unclear, 60 percent High.
* Predictors: approximately 93 percent Low, 4 percent Unclear, 3 percent High.
* Outcomes: approximately 25 percent Low, 60 percent Unclear, 15 percent High.
* Analyses: approximately 2 percent Low, 18 percent Unclear, 80 percent High.
Panel B, model development - concern regarding applicability, shows three domains:
* Participants: approximately 65 percent Low, 3 percent Unclear, 32 percent High.
* Predictors: approximately 84 percent Low, 9 percent Unclear, 7 percent High.
* Outcomes: approximately 70 percent Low, 7 percent Unclear, 23 percent High.
Panel C, model evaluation - risk of bias, shows four domains:
* Participants: approximately 10 percent Low, 25 percent Unclear, 65 percent High.
* Predictors: approximately 86 percent Low, 9 percent Unclear, 5 percent High.
* Outcomes: approximately 23 percent Low, 65 percent Unclear, 12 percent High.
* Analyses: approximately 5 percent Low, 30 percent Unclear, 65 percent High.
Panel D, model evaluation - concern regarding applicability, shows three domains:
* Participants: approximately 65 percent Low, 3 percent Unclear, 32 percent High.
* Predictors: approximately 84 percent Low, 9 percent Unclear, 7 percent High.
* Outcomes: approximately 68 percent Low, 12 percent Unclear, 20 percent High.
Discussion
In this systematic review, a comprehensive analysis of 43 original studies evaluating the application of artificial intelligence methods in resting-state EEG analysis for schizophrenia diagnosis was conducted. The findings allow a synthesis of the predefined research questions and an assessment of the clinical potential of this approach.
Our synthesis confirms that despite high reported diagnostic accuracy (mean 93.38%), current evidence does not support the clinical translation of AI-EEG biomarkers due to critical methodological flaws, such as lack of external validation and pervasive data leakage (Q1–Q6).
Despite high reported performance, results should be interpreted with caution. Small sample sizes increase the risk of overfitting, particularly with complex DL models. In addition, many studies relied on the same public datasets, limiting generalizability and increasing the risk of model adaptation to dataset-specific characteristics. Accordingly, the available evidence does not allow us to determine whether the reported performance reflects schizophrenia-related EEG patterns or characteristics specific to the repeatedly used datasets and their participants. Given the predominance of a small number of repeatedly used public datasets, particularly the IPIN and Moscow datasets, their representativeness of worldwide schizophrenia populations remains limited, underscoring the need for validation in geographically and clinically diverse multicenter cohorts. Validation strategies were a key determinant of reported performance [Reference Bradshaw, Huemann, Hu and Rahmim14]. Most studies did not apply external validation, substantially limiting assessment of generalizability. The distinction between segment-wise and subject-wise approaches was particularly important. Segment-wise approaches, used in most studies, artificially increased sample size and improved classification performance, while introducing a high risk of data leakage due to mixing EEG segments from the same participant across training and testing sets. Under such conditions, models may learn subject-specific patterns rather than disease-related features, limiting clinical applicability. In contrast, subject-wise approaches were associated with lower but more methodologically and clinically valid accuracy estimates [Reference Bradshaw, Huemann, Hu and Rahmim14]. Appropriate validation is essential in the development of diagnostic biomarkers, as emphasized in the BEST framework, ensuring reliability, reproducibility, and translational potential [7].
A key strength of this review is the application of PROBAST+AI for systematic methodological quality assessment. Within PROBAST+AI, applicability concerns whether the participants and setting, predictors, and outcome correspond to the review question or the model’s intended use and is assessed separately for model development and model evaluation [Reference Moons, Damen, Kaul, Hooft, Andaur Navarro and Dhiman16]. All 43 included studies were evaluated using this framework, revealing that most exhibited high risk of bias. Although some studies demonstrated greater potential for clinical application, further validation in larger and more diverse populations is required. These findings highlight structural limitations in study design within this field. Based on identified methodological issues, a set of recommendations for future research (Table 6) was developed, including the use of subject-wise and external validation, larger sample sizes, standardized EEG protocols, and harmonized reporting. These recommendations provide practical guidance for developing AI models with translational potential. Additional strengths of this review include clearly defined inclusion and exclusion criteria, enabling reproducibility in future updates, and the use of a PICOTS-based framework to formulate and address specific research questions.
Recommendations for future research using AI in resting-state EEG analysis in the diagnosis of schizophrenia

Table 6. Long description
The table is organized into two columns: Area requiring improvement and Recommendations.
* Datasets: Design studies with larger cohorts, use multicenter datasets, and reduce reliance on limited public datasets.
* Study design: Avoid combining adolescent and adult populations; ensure clinical homogeneity or report heterogeneity.
* E E G methodology: Standardize acquisition and preprocessing; clearly report feature extraction methods.
* A I models: Match model complexity to dataset size to limit overfitting; report all evaluated models or justify selection.
* Model validation: Use subject-wise data splitting to prevent data leakage; ensure strict separation of training and testing sets; perform external validation on independent datasets.
* Model evaluation: Report accuracy, sensitivity, specificity, and A U C; interpret results based on validation strategy.
* Transparency and reporting: Apply standardized guidelines like T R I P O D A I or C O N S O R T A I; provide detailed analytical pipeline descriptions.
* Assessment of methodological quality: Perform quality assessments using tools such as P R O B A S T plus A I.
Abbreviations: AI, artificial intelligence; EEG, electroencephalography; AUC, area under the receiver operating characteristic curve; CONSORT-AI, Consolidated Standards of Reporting Trials – Artificial Intelligence; TRIPOD-AI, Transparent Reporting of a multivariable prediction model for Individual Prognosis Or Diagnosis – Artificial Intelligence; PROBAST + AI, Prediction model Risk Of Bias ASsessment Tool – Artificial Intelligence extension.
Limitations include the absence of a meta-analysis, attributable to substantial methodological heterogeneity across studies, especially in study populations, sample sizes, EEG preprocessing procedures, extracted features, and validation strategies, which precluded a single clinically meaningful pooled estimate. However, a meta-analysis should be reconsidered once larger and methodologically more comparable studies become available. Although PROBAST+AI provides a structured assessment, quality evaluation remains partially dependent on expert interpretation. This review also focused exclusively on resting-state EEG, based on the assumption that a clinically useful biomarker should be simple, minimally burdensome, and cost-effective. At the same time, evidence from studies on evoked potentials, including sensory gating P50, N100, mismatch negativity (MMN), and P300, indicates additional relevant directions for biomarker research [Reference Yun11].
This review should be interpreted in the context of prior literature. A narrative review by Yun [Reference Yun11] focused primarily on EEG biomarkers in psychiatric disorders related to evoked potentials, without addressing resting-state EEG. A systematic review by Rahul et al. [Reference Rahul, Sharma, Sharma, Nanda and Sarkar12] summarized AI-based approaches in schizophrenia diagnosis and identified methodological challenges consistent with our findings; however, the present study extends this work through detailed analysis of validation strategies and formal risk of bias assessment. Other reviews, including Foteinopoulou and Patras [Reference Foteinopoulou and Patras3] and Gashkarimov et al. [Reference Gashkarimov, Sultanova, Efremov and Asadullin15], examined machine learning methodologies across multiple modalities, including fMRI, highlighting the potential of multimodal biomarkers. Given the pathophysiological heterogeneity of schizophrenia, multimodal approaches may represent an important direction for future research.
Currently, AI-analyzed resting-state EEG does not meet the criteria for a clinically applicable individual diagnostic biomarker for schizophrenia. Methodological limitations preclude translation into routine clinical practice. Nevertheless, EEG remains a valuable source of biological data, and its potential may be realized through more rigorous study designs, standardized methodologies, and improved reporting using frameworks such as TRIPOD-AI and CONSORT-AI [Reference Collins, Moons, Dhiman, Riley, Beam and Calster60, Reference Martindale, Llewellyn, de Visser, Ng, Ngai and Kale61].
In summary, despite substantial interest and high reported performance, the current evidence does not support the clinical implementation of EEG-based AI models in schizophrenia diagnosis. Further progress requires improvements in methodological quality, standardization, and the application of rigorous validation strategies. Future research should also prioritize the integration of multimodal diagnostic biomarkers beyond single-source approaches.
Significance statement
What is already known on this topic: Numerous studies report exceptionally high diagnostic accuracies (often exceeding 95%) when applying artificial intelligence (AI) and deep learning models to quantitative EEG data for schizophrenia detection. However, these findings are highly heterogeneous, and their clinical reproducibility remains controversial due to varying validation approaches.
What this study adds: This study presents the inaugural application of the rigorous PROBAST+AI (2025) risk-of-bias assessment framework to psychiatric neurophysiology. By evaluating 43 primary studies (N = 6,584 participants), we systematically unmask a profound performance discrepancy between subject-wise (88.22%) and segment-wise (98.14%) validation protocols, proving that contemporary diagnostic metrics are artifactually elevated due to pervasive data leakage and a critical lack of external validation (restricted to only 4.7% of the literature).
How this study might affect clinical practice: By demonstrating that 76.7% of contemporary AI-EEG models suffer from a high risk of bias, this review serves as a crucial methodological corrective, tempering overoptimism regarding immediate clinical translation. The authors of this review consider models supporting early diagnosis, assessment of disease severity, prediction of disease course, and differentiation of schizophrenia from bipolar disorder, schizoaffective disorder, and other psychotic disorders to have the greatest value in routine clinical practice. Therefore, current studies should be viewed primarily as a stage in the development and evaluation of AI methods rather than as a direct basis for their diagnostic use. In this context, the present review provides a critical methodological assessment of research on the use of AI and EEG in schizophrenia and identifies the barriers limiting its clinical application. Furthermore, we provide a standardized methodological framework and practical recommendations to bridge the gap between experimental engineering models and real-world psychiatric applications, paving the way for truly reliable and generalizable digital biomarkers in schizophrenia diagnostics.
Supplementary material
The supplementary material for this article can be found at http://doi.org/10.1192/j.eurpsy.2026.12262.
Data availability statement
Data sharing is not applicable to this article as no new datasets were generated during the current study. The extracted data from the primary studies analyzed during this review are included within the article and its Supplementary Materials.
Acknowledgments
The authors wish to acknowledge the clinical and administrative staff of the Department of Psychiatry, Medical University of Bialystok, and the Medical University of Bialystok Teaching Hospital for their general institutional support during the preparation of this manuscript.
Author contribution
K.Ł. conceived the study and established the methodological framework for the systematic review based on the PRISMA 2020 guidelines and the PICOTS framework. K.Ł. and N.W. jointly performed the critical risk of bias assessment using the PROBAST+AI tool, independently evaluating each of the 43 included studies across the domains of participants, predictors, outcomes, and analysis to ensure methodological rigor. K.Ł. conducted the statistical synthesis of diagnostic performance metrics, developed the data visualizations, and prepared the original draft of the manuscript. N.W. provided senior clinical supervision and intellectual leadership for the project, validating the theoretical consistency of the analysis within the context of schizophrenia pathophysiology and the clinical utility of biomarkers under the BEST framework. Both authors performed a critical review and final editing of the manuscript, contributing significantly to the formulation of evidence-based recommendations for future research and the interpretation of AI model generalizability. N.W. also provided the necessary organizational support for the review and approved the final version of the manuscript for submission.
Financial support
This work was supported by the Medical University of Bialystok, grant number B.SUB.26.435. The funder had no role in study design, data collection and analysis, decision to publish, or preparation of the manuscript.
Competing interests
The authors declare no competing interests.




 Open access


Comments
No Comments have been published for this article.