INTRODUCTION
As a species, killer whales, Orcinus orca (Linnaeus, 1758), have extremely diverse diets, taking teleosts, elasmobranchs, cephalopods, seabirds, turtles, pinnipeds and cetaceans (see de Bruyn et al., Reference de Bruyn, Tosh and Terauds2013 for review). However, individuals from specific, sometimes sympatric, subpopulations can have extremely specialized diets and behaviours and are thus frequently referred to as ‘ecotypes’ (Ford et al., Reference Ford, Ellis, Barrett-Lennard, Morton, Palm and Balcomb1998; Foote et al., Reference Foote, Newton, Piertney, Willerslev and Gilbert2009; Pitman et al., Reference Pitman, Durban, Greenfelder, Guinet, Jorgensen, Olson, Plana, Tixier and Towers2011).
In the North Atlantic basin there appears to be considerable genetic and ecological diversity among killer whale groups. There are at least three genetically distinct populations in the north-east Atlantic, with some geographical correspondence between these populations and specific prey resources (Foote et al., Reference Foote, Vilstrup, De Stephanis, Verborgh, Abel Nielsen, Deaville, Kleivane, Martín, Miller, Øien, Pérez-Gil, Rasmussen, Reid, Robertson, Rogan, Similä, Tejedor, Vester, Víkingsson, Willerslev, Gilbert and Piertney2011). However, the number of distinct ecotypes within these populations, and their spatial, genetic and ecological relationships, are not yet well-established. Behavioural observations, stable isotopes and stomach contents reveal ecological diversity and prey shifting in some eastern North Atlantic killer whales (Foote et al., Reference Foote, Newton, Piertney, Willerslev and Gilbert2009; Bisther & Vongraven (in press)). Along the eastern margin of the North Atlantic, analysis of tooth wear and δ15N ratios provide evidence for two ecotypes of killer whales: Type 1 whales, which feed on a variety of prey including fish, seabirds and pinnipeds, and Type 2 whales that may selectively feed on cetaceans (Foote et al., Reference Foote, Newton, Piertney, Willerslev and Gilbert2009, Reference Foote, Similä, Víkingsson and Stevick2010; Matthews & Ferguson, (in press)). The relative distribution and abundance of these two established ecotypes is not well-documented, and even less is known about the ecology of killer whales in other parts of the North Atlantic (Lawson et al., Reference Lawson, Stevens and Snow2007; Morin et al., Reference Morin, Archer, Foote, Vilstrup, Allen, Wade, Durban, Parsons, Pitman, Li, Bouffard, Abel Nielsen, Rasmussen, Willerslev, Gilbert and Harkins2010).
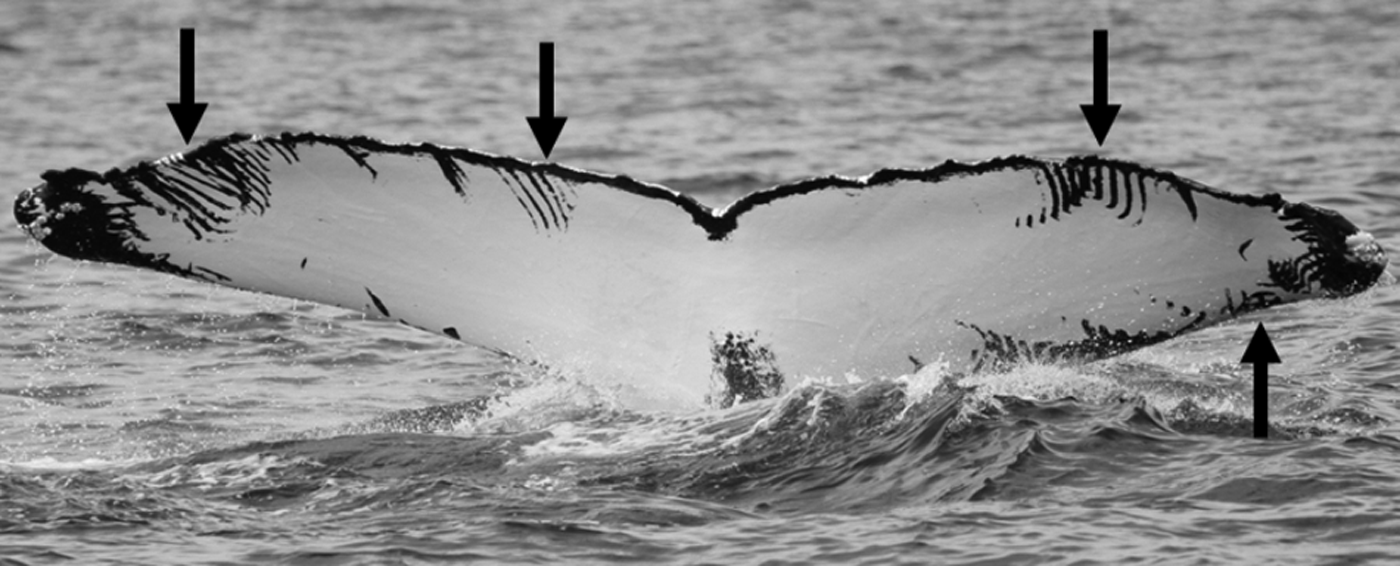
If a large whale survives an attack from a killer whale, sequences of parallel scars—termed rake marks—provide a record of the encounter (Katona & Whitehead, Reference Katona and Whitehead1981; Katona et al., Reference Katona, Beard, Girton and Wenzel1988; Jefferson et al., Reference Jefferson, Stacey and Baird1991; Pitman et al., Reference Pitman, Ballance, Mesnick and Chivers2001; Reeves et al., Reference Reeves, Berger, Clapham, Estes, DeMaster, Doak, Williams and Bownell2006) (Figure 1). Killer whale attacks on humpback whales, Megaptera novaeangliae (Borowski, 1781), are rarely witnessed (Whitehead & Glass, Reference Whitehead and Glass1985; Jefferson et al., Reference Jefferson, Stacey and Baird1991; Lawson et al., Reference Lawson, Stevens and Snow2007), but opportunistic observations of these attacks—along with subsequent scarification—indicate that such events may predictably occur in certain areas (Whitehead & Glass, Reference Whitehead and Glass1985; Katona et al., Reference Katona, Beard, Girton and Wenzel1988; Jefferson et al., Reference Jefferson, Stacey and Baird1991; Clapham, Reference Clapham2001; Naessig & Lanyon, Reference Naessig and Lanyon2004; Lawson et al., Reference Lawson, Stevens and Snow2007; Mehta et al., Reference Mehta, Allen, Constantine, Garrigue, Jann, Jenner, Marx, Matkin, Mattila, Minton, Mizroch, Olavarria, Robbins, Russell, Seton, Steiger, Víkingsson, Wade, Witteveen and Clapham2007; Steiger et al., Reference Steiger, Calambokidis, Straley, Herman, Cerchio, Salden, Urban-R., Jacobsen, von Ziegesar, Balcomb, Gabriele, Dahlheim, Uchida, Ford, Ladron de, Yamaguchi and Barlow2008). In addition, although successful predation will not result in whales surviving with scars, the proportion of scarred whales may indicate the frequency of predatory pressure of killer whales on various subpopulations of humpback whales (Schoener, Reference Schoener1979; Mehta et al., Reference Mehta, Allen, Constantine, Garrigue, Jann, Jenner, Marx, Matkin, Mattila, Minton, Mizroch, Olavarria, Robbins, Russell, Seton, Steiger, Víkingsson, Wade, Witteveen and Clapham2007).
Attacks from killer whales leave rake-like scars on the flukes of humpback whales. Arrows indicate rake marks on NAHWC no. 0768 (Photograph credit: Provincetown Center for Coastal Studies, NOAA permit no. 633-1778).

Much of the work on killer whale ecology in the northern hemisphere has centred on populations in the North Pacific (e.g. Ford et al., Reference Ford, Ellis, Barrett-Lennard, Morton, Palm and Balcomb1998; Springer et al., Reference Springer, Estes, van Vilet, Williams, Doak, Danner, Forney and Pfister2003; Doak et al., Reference Doak, Williams, Estes, Estes, DeMaster, Doak, Williams and Bownell2006; Dalheim et al., Reference Dahlheim, Schulman-Janiger, Black, Ternullo, Ellifrit and Balcomb2008; Steiger et al., Reference Steiger, Calambokidis, Straley, Herman, Cerchio, Salden, Urban-R., Jacobsen, von Ziegesar, Balcomb, Gabriele, Dahlheim, Uchida, Ford, Ladron de, Yamaguchi and Barlow2008) and, more recently, the north-east Atlantic (Forney & Wade, Reference Forney, Wade, Estes, DeMaster, Doak, Williams and Bownell2006; Foote et al., Reference Foote, Newton, Piertney, Willerslev and Gilbert2009, Reference Foote, Similä, Víkingsson and Stevick2010, Reference Foote, Vilstrup, De Stephanis, Verborgh, Abel Nielsen, Deaville, Kleivane, Martín, Miller, Øien, Pérez-Gil, Rasmussen, Reid, Robertson, Rogan, Similä, Tejedor, Vester, Víkingsson, Willerslev, Gilbert and Piertney2011). The north-east Atlantic has the highest known abundance of killer whales in the North Atlantic; however, scarred humpback whales feed in all areas of the North Atlantic (Katona et al., Reference Katona, Beard, Girton and Wenzel1988; Jefferson et al., Reference Jefferson, Stacey and Baird1991; Corkeron & Connor, Reference Corkeron and Connor1999; Mehta et al., Reference Mehta, Allen, Constantine, Garrigue, Jann, Jenner, Marx, Matkin, Mattila, Minton, Mizroch, Olavarria, Robbins, Russell, Seton, Steiger, Víkingsson, Wade, Witteveen and Clapham2007). To detect differences in predation pressure among regions, we analysed scarring frequency in five North Atlantic feeding areas.
MATERIALS AND METHODS
On the ventral side of the tail flukes, each humpback whale possesses a unique pattern that combines natural pigmentation and acquired scars (Katona & Whitehead, Reference Katona and Whitehead1981). Scar patterns can remain stable for decades (Carlson et al., Reference Carlson, Mayo and Whitehead1990; Blackmer et al., Reference Blackmer, Anderson and Weinrich2000). Thus, in addition to facilitating mark–recapture studies that provide estimates of abundance, movement patterns, and other population parameters (Hammond et al., Reference Hammond, Mizroch and Donovan1990), photo-identification may also provide documentation of predation events that have caused fluke scarring. While rake marks that occur on the flukes are visible in photo-identification catalogues, some whales may only possess scars on other body parts, such as pectoral flippers or the dorsal fin (Katona & Whitehead, Reference Katona and Whitehead1981); exclusively using photographs of the flukes necessarily underestimates the number of scarred whales.
The North Atlantic Humpback Whale Catalogue (NAHWC) is a central curation facility for fluke identification photographs collected throughout the North Atlantic Ocean (Katona & Beard, Reference Katona and Beard1990). The NAHWC is maintained by Allied Whale (College of the Atlantic, Bar Harbor, ME, USA) and draws upon photographs collected by directed research projects and opportunistic sightings, including contributions from >650 collaborating individuals and research groups. The NAHWC contains records of 7146 individual whales (>29,000 photographs). Data used in these analyses were collected between 1975 and 2012.
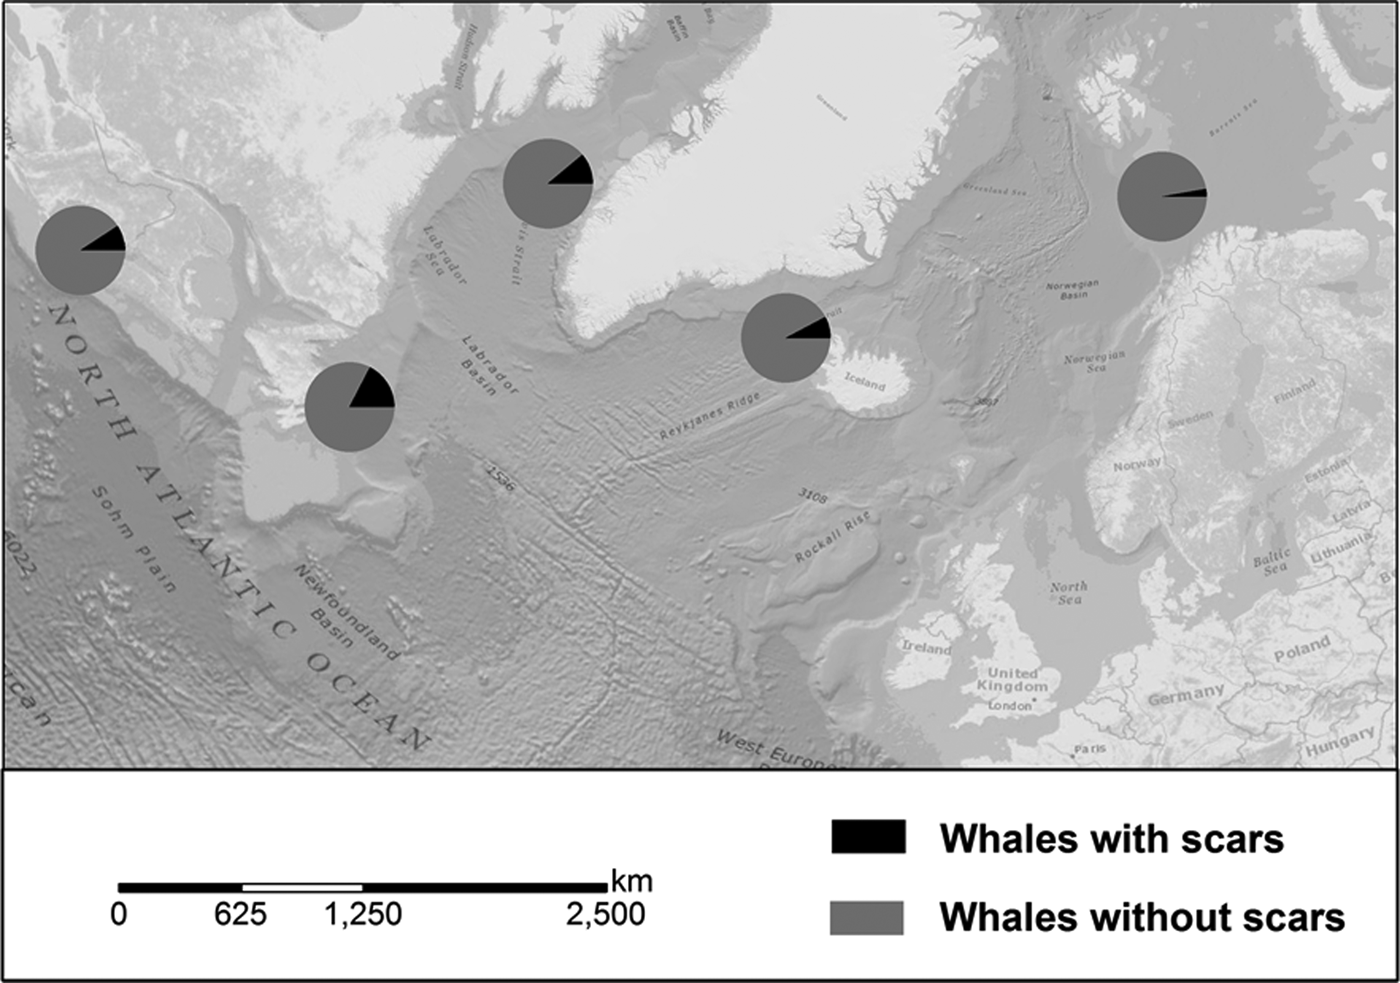
In the NAHWC, whales are assigned to one of five principal high-latitude feeding areas: (1) the Gulf of Maine; (2) eastern Canada, including the Newfoundland–Labrador region and the Quebec shore of the Gulf of St Lawrence; (3) the west coast of Greenland; (4) Iceland; and (5) Norway, including the Barents Sea and the northern European coastline (Figure 2). Considerable movement has been documented between these latter two areas (Stevick et al., Reference Stevick, Allen, Clapham, Katona, Larsen, Lien, Mattila, Palsbøll, Sears, Sigurjónsson, Smith, Víkingsson, Øien and Hammond2006), but because of the large spatial separation, and the documented differences in killer whale ecotypes between them (Foote et al., Reference Foote, Newton, Piertney, Willerslev and Gilbert2009, Reference Foote, Similä, Víkingsson and Stevick2010), they are treated separately here. While long-distance movement between western feeding areas is uncommon, it is documented (Stevick et al., Reference Stevick, Allen, Clapham, Katona, Larsen, Lien, Mattila, Palsbøll, Sears, Sigurjónsson, Smith, Víkingsson, Øien and Hammond2006). To avoid redundancy, whales were only included in analysis if they had been sighted exclusively in a single feeding area (N = 5040). If a whale was never sighted in a feeding area—i.e. exclusively within a breeding area—it was excluded from analysis (N = 1987). Whales were coded as ‘scarred’ if they had three or more parallel lines (one or more rake marks) and/or corresponding bite marks on their flukes consistent with encounters with killer whales (Naessig & Lanyon, Reference Naessig and Lanyon2004; Mehta et al., Reference Mehta, Allen, Constantine, Garrigue, Jann, Jenner, Marx, Matkin, Mattila, Minton, Mizroch, Olavarria, Robbins, Russell, Seton, Steiger, Víkingsson, Wade, Witteveen and Clapham2007) (Figure 1). For individuals represented by multiple photographs, we chose the photograph of highest quality. We determined scarring rate by dividing the number of scarred individuals by the total number of individuals within a given area. All whales were also coded for the extent of black and white pigment on the fluke on a 1 (mostly white) to 5 (mostly black) scale. Each category corresponds to approximately 20% of the fluke area. Binomial confidence intervals for the proportions of scarred individuals per region are determined by the adjusted Wald method (Lewis & Sauro, Reference Lewis and Sauro2006).
Map showing scarring rate on humpback whales in five North Atlantic feeding areas. From west to east: Gulf of Maine; Canada; West Greenland; Iceland; Norway. Map prepared by Christopher A. Spagnoli.
RESULTS
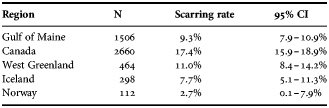
Regional rates of scarring ranged from 2.7 to 17.4% (Table 1), and there was significant variation in scarring rate among five feeding areas (χ24, P < 0.05). The scarring rate for the Canada region was significantly higher than the pooled proportion in the other four regions (9.1%; χ21, P < 0.05). The scarring proportion for the Barents Sea area was significantly lower than the pooled proportion in the other four regions (13.7%; χ21, P < 0.05). The Gulf of Maine, West Greenland, and Iceland regions did not differ from one another (χ22, P > 0.05). When pooled for comparison, the western North Atlantic (16.4%) had a significantly higher scarring rate than the eastern North Atlantic (6.7%; χ21, P < 0.05).
Rates of scarring on humpback whale flukes in the North Atlantic caused by non-fatal predatory interactions with killer whales. Results are grouped by primary feeding grounds.
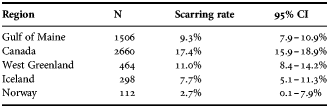
N, total number of identified individuals; CI, confidence interval.
There was a significant difference in fluke pigmentation between feeding areas (χ24 = 80.12, P < 0.0001). However, no relationship was found between the pigment type and incidence of scarring (χ216 = 7.76, P > 0.1). Similarly, there was no correlation found between the mean type value for a region and the proportion of scarred animals in that region (r = 0.582, P = 0.153).
The geographical distribution of the scarring rates shows a declining trend with increasing distance from Canadian waters, where scarring rates were greatest (Figure 2). Scarring rates were substantially lower in the Gulf of Maine to the south and declined progressively through Greenland and Iceland to Norway to the east.
DISCUSSION
A low predation-associated scarring rate could indicate either a lower frequency of predation or high predator efficiency (Schoener, Reference Schoener1979). Since no documented killer whale attacks on humpback whales and other large whales have been known to result in a kill, the hypothesis of high predator efficiency seems unlikely (Whitehead & Glass, Reference Whitehead and Glass1985; Jefferson et al., Reference Jefferson, Stacey and Baird1991). It is also possible that killer whales may feed on larger whales such as humpback whales without killing their prey (Jefferson et al., Reference Jefferson, Stacey and Baird1991). Thus, differences in scarring rate between subpopulations can be used as an indication of predation pressure, which in turn may be influenced by prey and predator abundance, overlap in distribution of prey and predator, and prey choice.
It is conceivable that regional differences in the pigmentation on humpback whale flukes (Allen et al., Reference Allen, Rosenbaum, Katona, Clapham and Mattila1994) could produce the appearance of differential scarring rates where none existed. If scars caused by killer whale attacks were more readily visible against either black or white pigment, the pattern presented here could simply be an artefact of fluke pigmentation. However, there was no relationship between the scarring rate and pigment type, either overall or by area. Further, the pigmentation types that had the highest frequency of coded scarring were the lightest and the darkest. These were most strongly represented in Norway and the Gulf of Maine, respectively, while these two areas had the lowest and third-lowest rates of scarring, respectively. Thus, any bias that this would introduce would be conservative.
Humpback whales from all of the feeding areas in the North Atlantic co-occur in winter in a primary breeding site (Stevick et al., Reference Stevick, Øien and Mattila1999, Reference Stevick, Allen, Bérubé, Clapham, Katona, Larsen, Lien, Mattila, Palsbøll, Robbins, Sigurjónsson, Smith, Øien and Hammond2003); thus, if attacks were to occur solely in low-latitude areas, humpbacks from all feeding areas have a roughly equal chance of acquiring scars. Since scarring rates vary substantially between feeding areas, however, we conclude that a high proportion of the predatory interactions between humpback whales and killer whales take place in high-latitude waters or during migration.
If, contrary to the evidence for ecotypes, one were to assume that all killer whales are equally likely to attack humpback whales, the simplest explanation for the observed variation would be a higher co-occurrence of the two species in certain regions. Current estimates of the distribution and relative abundance of killer whales across the North Atlantic, however, do not appear to correspond with the scarring rates. Killer whales are rare within the United States exclusive economic zone (Katona et al., Reference Katona, Beard, Girton and Wenzel1988; Waring et al., Reference Waring, Josephson, Maze-Foley and Rosel2012), yet the scarring rate in this region is comparable to that in Iceland, where the estimated population of killer whales is much larger (Forney & Wade, Reference Forney, Wade, Estes, DeMaster, Doak, Williams and Bownell2006). Overall, killer whales are thought to be more abundant along the eastern than the western margin of the North Atlantic (Forney & Wade, Reference Forney, Wade, Estes, DeMaster, Doak, Williams and Bownell2006). In contrast, the scarring rate is significantly higher in the western North Atlantic, and the significantly lowest scarring rates are in the Barents Sea and Norwegian waters, where killer whales are relatively abundant (Forney & Wade, Reference Forney, Wade, Estes, DeMaster, Doak, Williams and Bownell2006).
Alternatively, the differences in scarring rates may reflect the diet preferences and relative distributions of different ecotypes of killer whales. One of the ecotypes described for the North Atlantic (Type 2) is believed to be a cetacean specialist (Foote et al., Reference Foote, Newton, Piertney, Willerslev and Gilbert2009). Although analysis has concentrated on eastern waters, examples of both types seem to be found throughout the North Atlantic. The classification of Type 2 killer whales as cetacean-eaters is based on evidence of minke whale predation (Foote et al., Reference Foote, Newton, Piertney, Willerslev and Gilbert2009). Humpback whales have not been presented as known prey of Type 2 killer whales, and, despite their sympatric distribution, there have been no witnessed predation attempts on humpbacks in the eastern North Atlantic (Jefferson et al., Reference Jefferson, Stacey and Baird1991). Thus, it is possible that while Type 2 killer whales prey on minke whales and other smaller cetaceans, they may not regularly attack humpback whales. This raises the possibility that there may be a distinct and as-yet undescribed type or types of killer whale that prey selectively on larger baleen whales.
Substantial and growing evidence suggests that the ecology of killer whales in the North Atlantic is considerably more complex than the two-type model, with multiple genotypes and a substantial number of ecological specializations (Foote et al., Reference Foote, Newton, Piertney, Willerslev and Gilbert2009, Reference Foote, Vilstrup, De Stephanis, Verborgh, Abel Nielsen, Deaville, Kleivane, Martín, Miller, Øien, Pérez-Gil, Rasmussen, Reid, Robertson, Rogan, Similä, Tejedor, Vester, Víkingsson, Willerslev, Gilbert and Piertney2011; Matthews & Ferguson, in press (this volume)). For example, Matthews & Ferguson (this volume) describe two killer whale specimens from Canadian waters whose δ15N ratios are consistent with a diet comprising baleen whales.
With current evidence, however, it is not possible to determine the precise dietary preferences of killer whales anywhere in the western North Atlantic. The high scarring rate in the Canada region could indicate that the Canadian population of killer whales preferentially preys upon marine mammals. In these waters, killer whales approach and attack seals, fish, seabirds, and other cetaceans (Lawson et al., Reference Lawson, Stevens and Snow2007). It has not yet been shown, however, whether these whales are dietary generalists or specialists or if diet varies between social groups (Lawson et al., Reference Lawson, Stevens and Snow2007). Genetic results on two killer whales specimens from Newfoundland cluster them within the same clade that includes the North Pacific offshore ecotype (Morin et al., Reference Morin, Archer, Foote, Vilstrup, Allen, Wade, Durban, Parsons, Pitman, Li, Bouffard, Abel Nielsen, Rasmussen, Willerslev, Gilbert and Harkins2010; Foote, unpublished data). In the North Pacific, these offshore killer whales appear to eat fish, including elasmobranchs, but at a higher trophic level than the ‘resident’ fish-eating ecotype (Krahn et al. Reference Krahn, Herman, Matkin, Durban, Barrett-Lennard, Burrows, Dahlheim, Black, LeDuc and Wade2007; Dalheim et al., Reference Dahlheim, Schulman-Janiger, Black, Ternullo, Ellifrit and Balcomb2008). However, there are no ecological data on the Atlantic specimens examined, and it is not clear if they would be comparable to those from the Pacific.
Inter-area differences in killer whale scarring rates on humpback whales along with the lack of obvious correlation of the observed scarring with known killer whale abundance highlight the current gap in knowledge regarding the distribution and ecology of killer whales in the western North Atlantic Ocean. These findings suggest potential diet specialization on large whales by one or more ecotypes, possibly with a principal distribution in Canadian waters.
ACKNOWLEDGEMENTS
We would like to acknowledge all of the Allied Whale staff and the hundreds of contributors to the NAHWC. These data would not exist without enormous effort by J. Allen spanning multiple decades. L. Crowe assisted in scar coding. We would also like to thank Tara Stevens and Jooke Robbins for their input and comments on various aspects of this paper. Andy Foote, Gretchen Steiger and an anonymous referee greatly improved the manuscript with their thoughtful comments and insights.
FINANCIAL SUPPORT
NAHWC funding is provided by private donors and an anonymous foundation.