Introduction
Political scientists have long debated what the best electoral system might be (Bowler, Farrell, and Pettitt Reference Bowler, Farrell and Pettitt2005). A focal point of this discussion is the trade-off between different democratic virtues. One such trade-off is to obtain fair representation of voters’ viewpoints while ensuring that elected members are held accountable for political decisions (Lijphart Reference Lijphart1990; Powell Reference Powell2000). A good system should be representative of citizens’ preferences while preventing the government from becoming so fractionalized that no one can be held responsible for decisions.
A key element of this trade-off relates to the number of seats in a given electoral district, or the DM. It is a well-established fact that the proportionality of an electoral system increases as DM increases (Benoit Reference Benoit2000; Cox Reference Cox1997; Lijphart Reference Lijphart1990; Taagepera and Shugart Reference Taagepera and Shugart1989). The link between accountability and DM is less straightforward, though several scholars have argued that the two are linked via the impact of DM on the number of parties: the larger the DM, the more parties there are that gain seats in government (Grofman and Lijphart Reference Grofman and Lijphart1986; Taagepera and Shugart Reference Taagepera and Shugart1989). The presence of more parties in parliament and in government is thought to have a negative effect on accountability (Blais and Massicotte Reference Blais, Massicotte, Le Duc, Niemi and Norris2002; Hellwig and Davids Reference Hellwig and Samuels2007; Lijphart Reference Lijphart1994; Powell Reference Powell2000). The more parties there are in government, the more complicated it is for voters to disentangle the responsibility of each party for adopted policies. The trade-off is straightforward. Higher DM means greater proportionality in the translation of votes into seats, and therefore more representativeness. But it also means more parties in power, and less accountability.
Carey and Hix (Reference Carey and Hix2011) have argued that the trade-off can be solved by low-magnitude proportional representation. According to them, the relation between DM and both representativeness and accountability is non-linear. The gains in representation are strong when DM rises from low to moderate, but decrease at higher degrees of DM. Likewise, the loss in accountability is stronger from low to medium DM but gets smaller at higher degrees of DM. Furthermore, the rate of diminishing returns is steeper for representativeness than for accountability. Therefore, gains in representation outweigh losses in accountability as DM increases from low to medium. The consequence is a “sweet spot” where the probability of obtaining “good” outcomes with respect to both representativeness and accountability is higher than at very low or high degrees of DM. The authors examine the results of 609 elections held in 81 countries and confirm that in elections with a DM between 4 and 8, the likelihood of having a good outcome on both dimensions is higher.
The goal of this study is to verify the existence of the sweet spot in a laboratory setting. Lab experiments were conducted in Brussels and Montreal. Participants were invited to vote in experimental elections where four parties were running in settings with different DMs. The main advantage of an experimental design is that it provides a cleaner test of the effect of variation in DM on the representativeness and accountability of election outcomes.
Carey and Hix's Sweet Spot
The foundation Carey and Hix's sweet spot is that at low to medium DM, the gains in representation outpace the corresponding loss in accountability. This pattern creates a sweet spot at DM ranging between 4 and 8 seats. In their study, the main independent variable is median DM. The dependent variables are representativeness, accountability, and “good” outcomes. Representativeness is measured by two indicators: (dis)proportionality in the translation of votes into seats, measured by the classic Gallagher (Reference Gallagher1991) index, and the ideological distance between the electorate—measured by the left/right position of the median voter—and the government—measured by the left/right position of the median government party. For accountability, the two indicators are the Laakso and Taagepera's (Reference Laakso and Taagepera1979) effective number of parties (ENPP) and a simple count of the number of parties in government. The assumption is that the more parties are in government the more complicated it is for voters to know which party should be held accountable.
The choice of these indicators is debatable. The number of parties is, at best, an indirect measure of accountability. Nevertheless, we have decided to keep these indicators because our main objective is to see whether we can replicate Carey and Hix's findings in the lab. Furthermore, there is an evidence that the more parties there are in government the more complicated it is for voters to sort out the responsibilities of the various partners (Anderson Reference Anderson2000; Bingham Powell and Whitten Reference Bingham Powell and Whitten1993).
Carey and Hix show that the marginal returns of DM on both representativeness and accountability are diminishing, and, more importantly, that the slope of the curve relating DM to disproportionality is steeper than the one relating DM to accountability. The consequence is a sweet spot around which one can expect strong gains in proportionality and only limited losses in accountability.
To confirm the existence of a sweet spot, Carey and Hix calculate the probability of obtaining a good outcome on the four aforementioned indicators of representativeness and accountability. A “good outcome” is an outcome that is better than the median value for each of the indicators taken into consideration. They show that the probability of a good outcome on each criterion is highest at DMs ranging between 4 and 8. But they also acknowledge that even in that range relatively few elections produce outcomes that are deemed satisfactory with regard to both representativeness and accountability.
The Experimental Design
Twelve experimental sessions were held, six in Brussels and six in Montreal.Footnote 1 In each experimental session, 21 subjects were invited to participate in a series of 24 consecutive elections. In each election, voters were presented with the choice between four political parties (A, B, C and D). We chose four because it represents the typical number of political parties winning at least 5% of the vote in PR elections (as opposed to three in single-member plurality elections) (Katz Reference Katz1997, 147). Voters were informed about the number of seats to be allocated and were told how the votes would be translated into seats (Hare quota, largest remainder).
We vary DM from a single member (DM = 1) system to a purely proportional system (DM = number of voters). The number of seats does not vary within a given session. Participants vote 24 times in elections held under the same DM. It is only across sessions/groups of participants that DM changes. We had six groups in both Brussels and Montreal, each of which had a different DM (1, 3, 5, 7, 9 and 21).Footnote 2
At each election, every voter is randomly attributed a type (1, 2, 3 and 4) which determines her preferences among the four parties. Each type of voter strongly prefers one party and strongly dislikes another party. The payoff structure determines how many points each voter will receive according to the results of the election as well as the voters’ financial gains at the end of the experiment. The payoff depends on two features: the proportion of seats each party wins and the benefit associated with each party for each subject type. Subjects know before the election the distribution of types among the 21 participants at each election.
After having received the information about the number of seats (DM) and the payoff structure, the subjects voted for one of the four parties. Once all participants had voted, the results of the elections in votes and seats were announced and voters were informed of how many points they obtained. Each participant's type and payoff remained the same for three successive elections in order to allow the participants to learn how the system works in their precise context. After every three elections, voters were randomly attributed a new type.Footnote 3 In total, 12 experimental sessions, each with 21 subjects, took place. All in all, a total of 252 subjects participated in these sessions. Each subject voted in 24 successive elections, for a total of 6,048 votes in 288 elections.
Observing the Sweet Spot in the Lab
The unit of analysis is the 288 elections held in the 12 experimental sessions. The independent variable is DM, which ranges from 1 to 21. The dependent variables are the Gallagher disproportionality index, the ENPP, and, most importantly, “good outcomes,” which equal to 1 if both disproportionality and the ENPP are below the median. The disproportionality index and the ENPP are the indicators of representation and accountability used by Carey and Hix. These authors had one other indicator for each dimension (voter-government distance and the number of parties in government) but we cannot use these since our experimental set-up does not include the formation of a government. The “good outcomes” variable is operationalized exactly as in the Carey and Hix work.
Our estimations are based on a panel model that controls for both group (experimental session) specific and time specific effects. Our model includes DM and 1/DM to test the presence of a non-linear relationshipFootnote 4 , plus control variables for the order of elections within each new distribution from 1st to 3rd (Order, coded 1, 2 or 3), fractionalization of the electorate (1/sum of preference shares for each party), and the location of the experiment (Brussels 1, Montreal 0). The full results are presented in the Appendix.
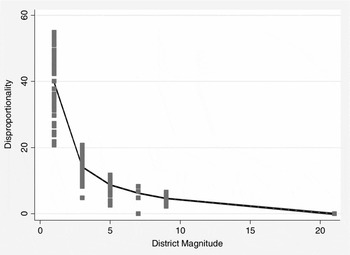
Figure 1 plots the relation between DM and disproportionality. The results are strikingly similar to those of Carey and Hix: the marginal gain of proportionality is decreasing as DM becomes higher.
District Magnitude and Disproportionality
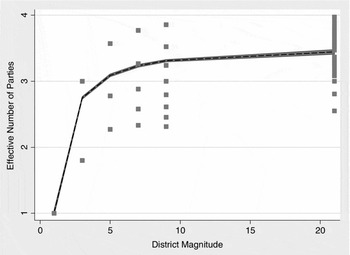
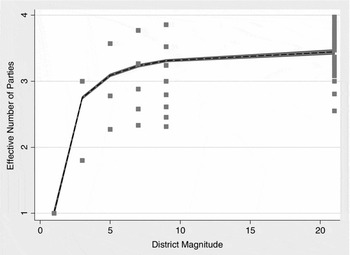
The next step is to run the same analysis for accountability; the indicator here is the ENPP in the district. The multivariate regression models are presented in the Appendix. Figure 2 illustrates the relationship. The growth in ENP mostly occurs between low and medium DM. The shape of the curve is almost flat after DM of 5.
District Magnitude and the Effective Number of Parties
The final step is to verify Carey and Hix's key argument that there is an increase in “good outcomes” at medium DM. A “good outcome” is defined as an instance in which disproportionality and the ENPP are both below the median value of all elections observed and are thus both considered “satisfactory.”
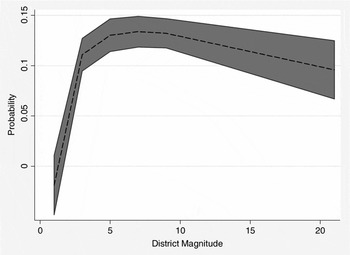
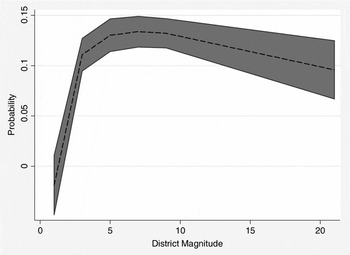
To capture good outcomes, we created a dummy variable (combined good outcomes) that equals to 1 when elections are below the median on both disproportionality and the ENPP. We then performed a probit estimation with DM, 1/DM, and the other control variables.Footnote 5 Figure 3 illustrates the relationship. The highest probabilities of a combined good outcome are found when DM ranges from 5 to 9, confirming the presence of a sweet spot.Footnote 6 However, the likelihood of a good combined outcome remains low, below 20%, even under moderate DM. The trade-off between high representativeness and good accountability is seldom solved. This finding is consistent with that of Carey and Hix, who noted (Reference Carey and Hix2011, 393) that the predicted likelihood of a “good” outcome on each of their four criteria remains low, even under moderate DM.
District Magnitude and the Probability of Combined Good Outcomes of Disproportionality and ENP
Conclusion
The goal of this study was to reproduce Carey and Hix's (Reference Carey and Hix2011) study in an experimental setting. To that effect, a series of lab elections were held in Montreal and Brussels. Like Carey and Hix, we find that in low to medium DM situations, the gains in proportionality outpace losses in party system fragmentation such that the probability of having “good outcomes” in terms of both representativeness and accountability is higher under moderate DM.
Observing in an experimental setting the same patterns as in real elections provides a strong replication of Carey and Hix's findings. Our laboratory elections offer a stronger test of their model, as these elections measure the link between DM and proportionality and the ENPP at the district level, not, as in the case of Carey and Hix, at the national level across several districts which often vary in magnitude (see Kedar, Harsgor, and Sheinerman Reference Kedar, Harsgor and Sheinerman2013). We thus have a cleaner measure of DM, the crucial independent variable. That said, our experimental design includes a fixed number of four parties.Footnote 7 Out of the lab, the number of parties winning seats is smaller when DM is low in part because fewer parties run in such circumstances, and when they do, their campaign efforts are concentrated in districts where they have a greater chance of getting at least one seat (Blais and Massicotte Reference Blais, Massicotte, Le Duc, Niemi and Norris2002; Lago et al. Reference Lago, Bermúdez, Guinjoan, Rowe and Simón2013). It is quite interesting that we observe the same pattern, even when the number of parties running in the election is kept constant.Footnote 8
The lab findings are thus quite similar to those presented by Carey and Hix and confirm the presence of a sweet spot. The probability of having a “good outcome” on both representation and accountability is indeed slightly higher at modest levels of DM.Footnote 9 However, we should keep in mind that combined good outcomes are seldom achieved, even under moderate DM. In that zone, the most likely outcome is still having either high representativeness or good accountability, not both.
Supplementary Materials
To view supplementary material for this paper, please visit http://dx.doi.org/10.1017/XPS.2015.7.