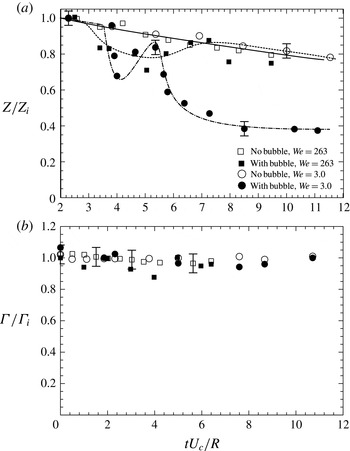
1. Introduction
Bubbly turbulent flows occur in a variety of industrial, naval and geophysical problems. Some examples of practical problems where these occur are in ship hydrodynamics, transportation of oil, chemical reactors and in processes at the ocean surface. In these applications, the bubbles in the flow interact with turbulence and/or vortical structures present in the continuous phase, this resulting in bubble motion and deformation and at the same time modifying the turbulence and/or the vortical structures. The motion of bubbles in inhomogeneous flow has been extensively studied as discussed in the review of Magnaudet & Eames (Reference Magnaudet and Eames2000), who focus primarily on the different forces acting on the bubble in such flows. Turbulence modulation due to the presence of particles or bubbles has been reviewed by Balachandar & Eaton (Reference Balachandar and Eaton2010). They state that ‘mechanisms of turbulence modulation due to presence of second phase and their parametric dependence are poorly understood and are wide open for fundamental investigation’. In the present work, we investigate an idealization of this problem, namely, the interaction of a single bubble with a single vortical structure, namely a vortex ring, formed in the continuous phase (water).
1.1. Literature overview
The presence of a second phase (bubble) in vortical flow of the continuous phase can have a dramatic effect on the flow field and on flow stability (see, for example, Madavan, Deutsch & Merkle Reference Madavan, Deutsch and Merkle1985; Lu, Fernández & Tryggvason Reference Lu, Fernández and Tryggvason2005; Govindarajan & Sahu Reference Govindarajan and Sahu2014). Interaction of vortical structures with bubbles occurs in many situations; examples of this include injection of microbubbles in turbulent flow for drag reduction (Madavan et al. Reference Madavan, Deutsch and Merkle1985; Sanders et al. Reference Sanders, Winkel, Dowling, Perlin and Ceccio2006; Gils et al. Reference Gils, Guzman, Sun and Lohse2013), tip vortex cavitation (Arndt, Arakeri & Higuchi Reference Arndt, Arakeri and Higuchi1991; Choi & Ceccio Reference Choi and Ceccio2007; Choi et al. Reference Choi, Hsiao, Chahine and Ceccio2009) and bubble cloud dynamics generated by breaking wind waves close to the sea surface (Thorpe Reference Thorpe1992). Among these examples, one that is more strongly related to the present work is the reduction of frictional drag through gas or bubble injection, which has recently been reviewed by Ceccio (Reference Ceccio2010) and Murai (Reference Murai2014). It is now well established that drag reduction in these flows is a strong function of bubble void fraction near the surface (Madavan et al. Reference Madavan, Deutsch and Merkle1985; Sanders et al. Reference Sanders, Winkel, Dowling, Perlin and Ceccio2006; Ceccio Reference Ceccio2010). However, the physical mechanisms responsible for frictional drag reduction using microbubbles in turbulent boundary layers are not yet completely understood (Ferrante & Elghobashi Reference Ferrante and Elghobashi2004; Murai Reference Murai2014). Broadly speaking, drag reduction by bubbles can either be caused by direct modification of fluid properties like density and viscosity, or through the relatively more complex interaction of bubbles with turbulent structures within the boundary layer. Murai (Reference Murai2014) highlights the fact that coherent structures present in turbulent flow can be modified by the presence of bubbles resulting in drag reduction. Direct numerical simulations (DNS) by Ferrante & Elghobashi (Reference Ferrante and Elghobashi2004) and Lu et al. (Reference Lu, Fernández and Tryggvason2005) show that drag reduction can indeed be attributed to the interaction of bubbles with turbulent eddies. Lu et al. (Reference Lu, Fernández and Tryggvason2005) also observed that the presence of bubbles suppresses streamwise vortices and enstrophy, which in turn reduces the wall shear stress. The experiments of Jacob et al. (Reference Jacob, Olivieri, Miozzi, Campana and Piva2010) showed that microbubbles resulted in a decrease of the characteristic dimension of the turbulent scale involved in the production of kinetic energy. Gils et al. (Reference Gils, Guzman, Sun and Lohse2013) have shown experimentally in a turbulent Taylor–Couette flow that bubble deformability is a crucial and important mechanism for drag reduction.
Many investigators have recently shown that structures in turbulent boundary layers are mostly in the form of hairpins (Adrian, Meinhart & Tomkins Reference Adrian, Meinhart and Tomkins2000; Dennis & Nickels Reference Dennis and Nickels2011). The interaction of bubbles with turbulent structures within the boundary layer may therefore be thought of as the interaction of bubbles with these hairpin structures. Hairpins in turbulent boundary layers are statistically distributed in the flow field, having very high number density, which adds further complexity to the study of their interactions with bubbles. A simplified way to study the interaction of such vortical structures with bubbles for better understanding of the underlying physics is to study the interaction of a single vortical structure with a single bubble. Perhaps the most simple and robust vortical structure that one can think of is a vortex ring, which can be easily generated in the laboratory by pushing a slug of fluid using a piston–cylinder mechanism. The vortex rings formed can have thin or thick cores, this being indicated by a non-dimensional core radius (
 ${\it\epsilon}=a/R$
, where
 $a=\text{equivalent core radius}$
and
 $R=\text{vortex ring radius}$
) (Norbury Reference Norbury1973). Laminar rings typically become unstable due to the azimuthal short-wave instability of the vortex core resulting in the formation of Kelvin waves (Widnall, Bliss & Tsai Reference Widnall, Bliss and Tsai1974), with thicker core rings being more prone to instability, as shown by O’Farrell & Dabiri (Reference O’Farrell and Dabiri2012).
On the interaction of a vortex with a bubble, Magnaudet & Eames (Reference Magnaudet and Eames2000) state that only a few quantitative experiments have been attempted. Chahine (Reference Chahine and Green1995) in his numerical study of a bubble interacting with a vortex observed extreme bubble elongation and wrapping around the core region for bigger bubble sizes. Sridhar & Katz (Reference Sridhar and Katz1999) experimentally studied the effect of a set of relatively small bubbles on the structure of a relatively large vortex ring. They showed that under certain conditions, a set of bubbles interacting with a vortex ring can distort the vortex core, with the vortex core returning to the initial state after the bubbles escape from the ring. In their experiments, the ratio of total bubble volume to vortex core volume
 $(V_{R})$
was very small
 $({\sim}10^{-6})$
. In the current study
 $V_{R}$
is of the order of 0.1, which is closer to the
 $V_{R}$
observed in the bubbly turbulent boundary layer used for drag reduction, as will be discussed later. More recently, a few numerical studies have attempted to understand the two-way coupling between the flow and the bubble. Cihonski, Finn & Apte (Reference Cihonski, Finn and Apte2013) showed that the traditional two-way coupling approach based on momentum point sources could not replicate vortex distortion, as seen in the experiments of Sridhar & Katz (Reference Sridhar and Katz1999). They showed that it was essential to account for local variations in the bubble volume fractions to replicate the experimentally observed vortex core distortion. There have also been studies of the interaction of vortex rings with a large number of microbubbles. These include the experimental study of Uchiyama & Kusamichi (Reference Uchiyama and Kusamichi2013), and the simulations of Ferrante & Elghobashi (Reference Ferrante and Elghobashi2007). In the latter case, involving the interactions of a large number of microbubbles with a Taylor–Green vortex, Ferrante & Elghobashi (Reference Ferrante and Elghobashi2007) observed that bubbles settle in the core of the vortex, reducing the vorticity and enstrophy.
There have also been many studies on the break-up of a bubble in a turbulent flow. Kolmogorov (Reference Kolmogorov1949) and Hinze (Reference Hinze1955) showed in their pioneering work that bubbles or droplets break when the ratio of either viscous or dynamic force to surface tension force exceeds a critical value, the critical value itself being dependent on the amount of dispersion between the two phases. Shinnar (Reference Shinnar1961) proposed from Kolmogorov’s theory that the mean size of the droplet (or bubble) in isotropic turbulent flow varies as
 $\mathit{We}^{-0.6}$
, where
 $\mathit{We}$
is defined as the ratio of kinetic energy of an oscillating droplet/bubble to the surface energy. In their microgravity experiments, where turbulence is the only cause of bubble break-up, Risso & Fabre (Reference Risso and Fabre1998) observed that the second mode is dominant in bubble break-up. Martínez-Bazán, Montañés & Lasheras (Reference Martínez-Bazán, Montañés and Lasheras1999) suggest that binary break-up takes place at low
 $\mathit{We}$
, but at larger
 $\mathit{We}$
tertiary break-up dominates. Revuelta (Reference Revuelta2010) has numerically studied the break-up of a single bubble due to the induced velocity of a vortex ring, the bubble always being outside the vortex ring. He observed binary break-up at low
 $\mathit{We}$
, and large deformations followed by break-up into multiple fragments at high
 $\mathit{We}$
.
1.2. Example interaction of a vortex ring with a bubble
In the present work, we study the idealized case of the interaction of a single bubble with a single vortex ring. This may be thought of as a simplified case of the interaction of bubbles with for example the hairpin structures seen in turbulent boundary layers, or indeed of vortical structures in any turbulent flow. As part of this study, we are interested in, and shall present results from, both the bubble dynamics perspective and modifications induced in the vortex ring due to the interaction.
The parameters in this interaction problem comprise naturally the parameters quantifying the vortex ring and the bubble. On the vortex ring side, this encompasses, the circulation (
 ${\it\Gamma}$
), the vortex ring radius (
 $R$
), the equivalent vortex core radius (
 $a$
), the latter being represented by the non-dimensional core radius (
 ${\it\epsilon}=a/R$
), and there is also the ring Reynolds number,
 $\mathit{Re}={\it\Gamma}/{\it\nu}$
(
 ${\it\nu}=\text{kinematic viscosity}$
). On the bubble side, there is the equivalent spherical bubble diameter (
 $D_{b}$
) and the surface tension (
 ${\it\sigma}$
) (see figure 4 for a schematical representation). In terms of the interaction between the ring and the bubble, the two main parameters are the ratio of the bubble volume to vortex core volume
 $(V_{R}=({\rm\pi}{D_{b}}^{3}/6)/(2{\rm\pi}^{2}Ra^{2}))$
, and the Weber number (
 $\mathit{We}$
) based on the circulation strength of the ring
 $({\it\Gamma})$
. We define here
 $\mathit{We}$
as
 $\mathit{We}=0.87{\it\rho}({\it\Gamma}/2{\rm\pi}a)^{2}/({\it\sigma}/D_{b})$
, along the lines used in Oweis et al. (Reference Oweis, Van der Hout, Iyer, Tryggvason and Ceccio2005), which may be thought of as the ratio of the pressure difference
 $({\rm\Delta}P=0.87{\it\rho}({\it\Gamma}/2{\rm\pi}a)^{2})$
between the vortex core and the far field to the Laplace pressure
 $({\it\sigma}/D_{b})$
for a spherical bubble. In our studies,
 $V_{R}$
is kept fixed at about 0.1, this being representative of the kind of volume ratio (bubble volume to eddy core volume) seen in bubbly turbulent boundary layers used in drag reduction studies, as discussed later.
 $\mathit{We}$
is varied by changing the circulation
 $({\it\Gamma})$
, and the effect of changes in the non-dimensional core radius
 $({\it\epsilon})$
is also presented. In our experiments, the vortex ring of radius
 $R$
is generated by using a piston–cylinder arrangement in water, and the bubble is generated by a capillary connected to an air pump. The ring travels vertically upwards while interacting with the bubble.
We begin by presenting an example interaction between a bubble and a vortex ring to show the type of effects that can occur, before presenting more detailed results in later sections. For this example case, the ring diameter
 $(2R)$
is about 23 mm, ring core radius (a) is about 3 mm, its circulation
 $({\it\Gamma})$
is about
 $245~\text{cm}^{2}~\text{s}^{-1}$
, and the bubble size
 $(D_{b})$
is about 6 mm, which results in a bubble to vortex core volume ratio
 $(V_{R})$
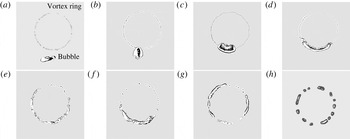
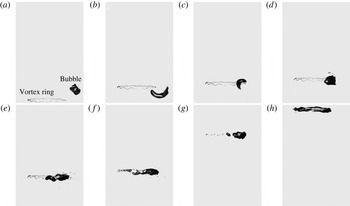
of about 0.1 and corresponds to a reasonably large Weber number of 131. We present in figures 1 and 2 time sequences of the top and front view of the bubble dynamics from two independent experiments, to get a three-dimensional perspective of the interaction. In order to visualize the vortex ring, micron-sized air bubbles are generated at the metallic tip of the vortex generator by electrolysis, these bubbles being much smaller than the millimetre-sized main bubble of diameter
 $D_{b}$
. In figures 1(a) and 2(a), one can see the bubble outside the ring just as the interactions begin. The bubble is then entrained into the low-pressure vortex core of the ring following a spiral path, with the bubble being elongated along the spiral path, as seen in figures 1(b) and 2(b,c). Once the bubble enters into the core completely, it starts expanding in the azimuthal direction along the core, as seen in figure 1(c–e) and also figure 2(d–f). This is followed by a contraction of the bubble in figure 1(f) and re-expansion in figures 1(g) and 2(h). During this time, surface perturbations can be seen to be growing on the bubble, which leads to progressive break-up of the initial bubble. Given sufficient time this leads to the state shown in figure 1(h) comprising a set of smaller bubbles of roughly equal size, which does not further break up. As seen in figure 2, the ring convects vertically upwards during this entire interaction with the convection speed, this speed being a good indicator of the coherence of the vortex ring. We shall see later that the convection speed can be significantly reduced by the interactions.
Time sequence of top view visualization images showing the interaction of a single bubble with a vortex ring. In this case, the bubble diameter
 $D_{b}$
is 6 mm, the vortex ring circulation
 ${\it\Gamma}$
is
 $245~\text{cm}^{2}~\text{s}^{-1}$
with ring
 $\mathit{Re}$
of 29 900 and the corresponding Weber number
 $(\mathit{We}=0.87{\it\rho}({\it\Gamma}/2{\rm\pi}a)^{2}/({\it\sigma}/D_{b}))$
is 131. The non-dimensional time (
 $t^{\ast }=tU_{c}/R$
) corresponding to each of the images shown is (a) 3.36, (b) 3.93, (c) 4.37, (d) 4.63, (e) 6.09, (f) 7.17, (g) 8.98 and (h) 12.37, where
 $U_{c}$
and
 $R$
are the convection speed and radius of the ring before interaction with the bubble.

Time sequence of side view visualization images showing the interaction of a single bubble with a vortex ring. All parameters are same as in figure 1. The non-dimensional time (
 $t^{\ast }=tU_{c}/R$
) is (a) 3.36, (b) 3.99, (c) 4.28, (d) 4.44, (e) 4.72, (f) 6.06, (g) 7.13 and (h) 8.88.

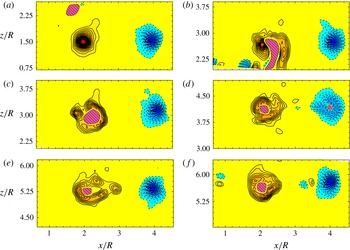
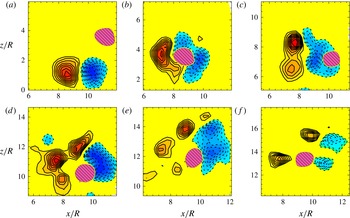
Time sequence of principal azimuthal vorticity within the ring measured using time-resolved PIV showing the interaction of a single bubble with a vortex ring. In each image, the bubble is marked as a hatched area (magenta online). Solid and dashed line contours represent positive and negative vorticity, respectively. The non-dimensional time (
 $t^{\ast }=tU_{c}/R$
) is (a) 3.3, (b) 3.99, (c) 4.37, (d) 5.96, (e) 7.04 and (f) 8.75. All parameters are as in figures 1 and 2. Non-dimensional vorticity contour levels (
 ${\it\omega}R/U_{c}$
) shown are
 $\pm 1.57,2.75,3.93,\dots \,$
.

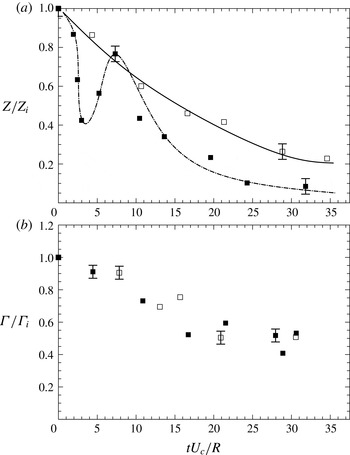
Observation of bubble dynamics is accompanied by the measurement of the principal azimuthal vorticity of the vortex ring using two-dimensional time-resolved particle image velocimetry (PIV), as shown in figure 3. In these plots, the bubble is marked as a hatched area (magenta online). Figure 3(a) shows the vortex ring before the interactions with the bubble begin. In figure 3(b), the bubble is elongated as it is being entrained into the ring, with significant distortion of the vortex core. After entrainment in figure 3(c), the bubble sits in the centre of the vortex core, and vorticity at this instant is distributed like an annulus outside the bubble. The bubble then gets elongated azimuthally along the ring, so that the bubble cross-sectional area reduces in the core on the left in figure 3(d), with the stretched out bubble being also visible on the right (dashed) core in figure 3(d) with some resultant modification to this core. Figure 3(e,f) shows the vorticity contours for minimum azimuthal shrinkage and maximum re-expansion of the bubble. As may be seen from this set of plots, significant changes can occur in the vorticity distribution within the core, which can in turn lead to a significant reduction in the convection speed of the ring, as we shall see later. This example is indicative of the fact that the interactions of the bubble and the vortex ring can significantly affect both of them, and it is this interaction that is the focus of this paper.
The layout of the paper is as follows. In § 2, we present the experimental set-up used for this study, and give details of the techniques used to make qualitative and quantitative measurements. In § 3, we present results for the initial stages of interaction from both the bubble dynamics and vorticity dynamics perspective. This includes the bubble capture, bubble expansion and vorticity field modification processes for different vortex ring strengths
 $({\it\Gamma})$
, or equivalently
 $\mathit{We}$
. In § 4, we present results for the later stages of interaction, where the bubble has already been broken down into a set of smaller bubbles, and the bubble has reached a quasi-steady state with the smaller bubbles no longer breaking up. We present here the vorticity distribution in the cores at this later stage, including integral measures of it such as the circulation and enstrophy. This is followed by § 5, where we present results for the interactions of a bubble with a thicker vortex ring
 $({\it\epsilon}\sim 0.75)$
, where the results can be even more dramatic compared to the thinner core rings
 $({\it\epsilon}\sim 0.25)$
discussed in §§ 3 and 4. The possible physical mechanisms for the observed reduction in convection speed and fragmentation of the vortex core and the relevance of the present experiments to drag reduction through bubble injection in turbulent flows are discussed in § 6. Finally, in § 7, we shall present our conclusions from the study, providing an overview of how the interaction of a bubble with a vortex ring affects both the bubble and the vortex ring.
2. Experimental methodology
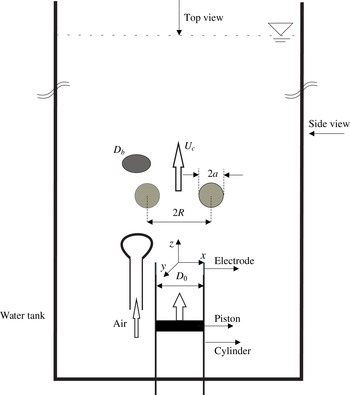
A schematic of the experimental set-up for the present study is shown in figure 4. The experiments were conducted in a glass tank of dimensions
 $0.6~\text{m}\times 0.6~\text{m}\times 1.2~\text{m}$
. Vortex rings were generated by actuating a piston–cylinder mechanism within water, such that the resulting vortex ring convects vertically upwards against gravity. The ring generator had a diameter
 $D_{0}$
, which was 15 mm for all the vortex ring cases presented in §§ 3 and 4. The rings thus generated were relatively thin with non-dimensional core radius
 $({\it\epsilon})$
of around 0.25. For the few thicker ring cases studied with
 ${\it\epsilon}$
of around 0.75 presented in § 5, a ring generator having
 $D_{0}$
of 3 mm was used. Vortex rings were generated by impulsively pushing out a slug of water from the generator, resulting in a vortex ring of strength
 ${\it\Gamma}$
, ring radius
 $R$
, and vortex core radius
 $a$
, these parameters being measured from PIV velocity fields. In each case, these ring parameters were measured from a set of about three experiments conducted in the absence of the bubble.
 ${\it\Gamma}$
was measured using the line integral of velocity around a large closed loop enclosing the vortex core. The values of
 $a$
and
 $R$
were then determined from the measured vertical velocity along a horizontal line passing through both the vortex centres. Both these parameters were obtained from a least-squares fit of the vertical velocity induced by the superposition of two Lamb–Oseen vortices with the measured velocity in a manner similar to that of Leweke & Williamson (Reference Leweke and Williamson1998). The non-dimensional time scale (
 $L/D_{0}$
, where
 $L$
is the piston stroke length) was always kept less than 4, such that there was no trailing jet behind the ring (Gharib, Rambod & Shariff Reference Gharib, Rambod and Shariff1998). The circulation strength of vortex rings was varied by changing the piston velocity. The resulting vortex ring strengths varied from 30 to
 $500~\text{cm}^{2}~\text{s}^{-1}$
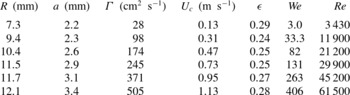
, covering the laminar, transitional and turbulent vortex ring regimes. All the measured parameters for the different vortex ring cases studied are summarized in table 1, along with the corresponding non-dimensional numbers. Measurement uncertainties associated with ring radius
 $R$
, core radius
 $a$
and circulation
 ${\it\Gamma}$
are
 $\pm 0.2~\text{mm}$
,
 $\pm 0.15~\text{mm}$
and
 $\pm 5\,\%$
, respectively.
Schematic showing the experimental set-up and the main parameters of the vortex ring and bubble. The vortex ring is generated by a piston–cylinder mechanism with generator diameter
 $D_{0}$
. The resulting vortex ring has radius
 $R$
with core size
 $a$
and convects vertically upwards with convection velocity
 $U_{c}$
, while the bubble is of size
 $D_{b}$
. Camera orientation for imaging and position of electrode used to visualize the vortex ring are also indicated.

All the interaction experiments reported with the bubble were performed after the complete formation of the vortex ring. In order to visualize the vortex ring, micron-sized air bubbles were generated at the metallic tip of the vortex generator by electrolysis. These bubbles were much smaller than the millimetre-sized main bubble of diameter
 $D_{b}$
and the core radius
 $a$
, and hence their effects on the vortex ring were negligible. This was confirmed by comparing the convection speed of the ring tracked with dye and with these micron-sized bubbles (both in the absence of the main large bubble), the convection speed being within experimental error for the two cases. The initial convection speed of the ring before interaction with the bubble was measured from position–time information and denoted as
 $U_{c}$
. This velocity along with the initial ring radius
 $R$
has been used to define a non-dimensional time,
 $t^{\ast }=tU_{c}/R$
, and non-dimensional vorticity,
 ${\it\omega}R/U_{c}$
, which are used throughout the paper to present results.
Values of measured parameters and non-dimensional numbers for the thin core rings before interacting with a bubble. Ring generator diameter (
 $D_{0}$
) and bubble diameter (
 $D_{b}$
) for the thin core rings are 15 mm and 6 mm, respectively.

A bubble of diameter
 $D_{b}$
was generated from a small-diameter tube connected to an air pump, which was placed close to the vortex ring generator. Before experiments with the vortex ring, the bubble size was measured separately from a series of zoomed-in visualizations of the bubble immediately after detachment. From these experiments, the (equivalent) spherical bubble diameter (
 $D_{b}$
) was calculated from measurements in two perpendicular planes, which gave the three axis lengths of the ellipsoidal bubble. The resulting values of equivalent bubble diameter were then averaged over about 10 runs to obtain the nominal
 $D_{b}$
, which typically was found to vary by less than about 1.5 % over the different runs.
 $D_{b}$
was 6 mm for the rings generated with the vortex ring generator of
 $D_{0}=15~\text{mm}$
, while
 $D_{b}$
was about 1.5 mm for the few cases studied with the generator of
 $D_{0}=3~\text{mm}$
. In both cases, the bubbles were ellipsoidal before the interaction with the ring, as expected, with the average large to small axis ratio, as measured from the side view, being about 2. The bubble was released just prior to the generation of the vortex ring using a valve in the air line. Volume ratio
 $V_{R}$
, defined as the ratio of bubble volume to the vortex core volume, was maintained to be of the order of 0.1 for all the experiments. The circulation of the vortex ring
 $({\it\Gamma})$
was varied as stated above, resulting in a range of Weber numbers from 3 to 406. For all measurements, with and without bubbles, three repetitions of the experiments were done, and the average of these is shown in plots, with error bars used to indicate the variation between the runs.
Top and front views of the bubble–ring interaction were captured using a high-speed Photron SA5 camera at framing rates of about 2000 f.p.s. with an exposure time of about
 $1/4000~\text{s}$
. These two views were captured independently due to the different illumination requirements, after ensuring that the broad features were repeatable. Illumination for the bubble dynamics visualization was done with a high-intensity halogen lamp. Apart from the bubble dynamics, the front view could also be directly used to measure the vertical location of the vortex ring with time. For the purpose of vertical location measurement of the ring, a relatively large field of view of about
 $300~\text{mm}\times 300~\text{mm}$
was used, while a zoomed-in field of view of about
 $50~\text{mm}\times 50~\text{mm}$
was used to capture the details of entrainment of the bubble into the ring.
Velocity and vorticity fields were obtained from time-resolved PIV measurements, which were done at repetition rates of between 1000 and 5000 Hz. For this purpose, the flow was seeded with silver-coated hollow glass spheres with a mean diameter of about
 $14~{\rm\mu}\text{m}$
. The seed particles were illuminated by a laser sheet from a high-repetition double-pulsed LDY-301 Litron PIV laser with a maximum energy of
 $10~\text{mJ pulse}^{-1}$
. Delay between two laser pulses was typically about 0.2 ms, determined by the requirement to keep the mean pixel displacement to be about one-quarter of the correlation box size. PIV images were captured using a Photron SA5 high-speed camera with a resolution of
 $1024~\text{pixel}\times 1024~\text{pixel}$
. The images obtained had scattered light from both the relatively small seed particles and the larger bubble. The light from the bubble was masked out prior to PIV processing. The resulting image contained only scattered light from seed particles, which was typically unaffected by the scattered light from the bubble. In a few cases, bubble scattering/reflections were found to be strong, affecting the image of nearby seed particles, and these images were not processed. The resulting images were then processed with Dantec PIV software using adaptive correlation with two-step box size refinement, with the final box size being
 $32~\text{pixel}\times 32~\text{pixel}$
and
 $16~\text{pixel}\times 16~\text{pixel}$
for the thin and thick core rings, respectively. Correlation box overlap was maintained at 50 % in all cases, with each box having roughly at least 6–8 particles to ensure strong correlations.
The origin of the coordinate system is at the centre of the exit plane of the vortex generator, as shown in figure 4. The vertical direction (upwards) is denoted by
 $z$
, and
 $x$
,
 $y$
are in the horizontal plane. We also use a radial coordinate
 $r$
from the centre of the vortex ring core when describing, for example, the vorticity distribution within the core.
3. Thin core rings: initial stages of interaction
In all cases presented in this and the following section, the non-dimensional core radius
 $({\it\epsilon})$
was about 0.25, which we refer to as thin, in comparison with the thicker core ring (
 ${\it\epsilon}=0.75$
) results presented in § 5. The vortex ring in the present experiment convects vertically upwards, and its vertical position (
 $z$
) as a function of time (
 $t$
) can easily be tracked from side view visualizations. The circulation
 $({\it\Gamma})$
of the vortex ring has been systematically varied in the experiments, while keeping the bubble size
 $(D_{b})$
fixed, resulting in a relatively large range of Weber numbers
 $(\mathit{We}=0.87{\it\rho}({\it\Gamma}/2{\rm\pi}a)^{2}/({\it\sigma}/D_{b}))$
from 3 to 406.
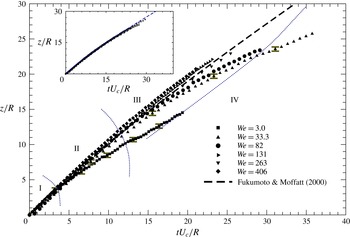
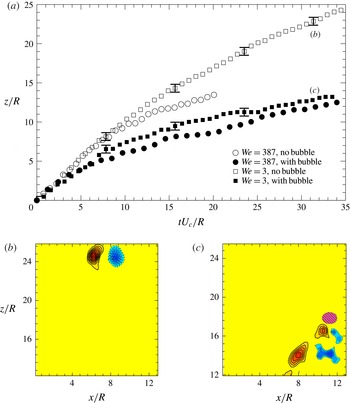
We present in figure 5 an overview plot showing the normalized vertical position (
 $z/R$
) of the vortex ring as it interacts with the bubble for different
 $\mathit{We}$
(or
 ${\it\Gamma}$
) cases. The data (solid symbols) are plotted versus time normalized by the vortex ring time scale (
 $R/U_{c}$
), where
 $U_{c}$
and
 $R$
are the convection speed and radius of the baseline ring at the initial time. Also, shown in the inset with open symbols are the data for the respective baseline cases for the vortex ring (with same
 ${\it\Gamma}$
) in the absence of the bubble. As one might expect, in the absence of the bubble, the ring location for all the different cases studied collapses onto a single line, which also agrees well with the viscous vortex ring model of Fukumoto & Moffatt (Reference Fukumoto and Moffatt2000), also shown in the inset by a dashed line. This dashed line representing the baseline cases is also shown in the main plot for reference.
The interacting case data in the main plot include the entire time of interaction between the vortex ring and the bubble starting from entrainment of the bubble into the ring, bubble break-up and in some cases bubble escape from the ring. This figure is therefore useful to delineate the different stages in the interaction, and accordingly we demarcate four broad stages in the interaction. In stage I, at the bottom left corner of the plot, the bubble is outside the ring, as in figure 1(a,b), and is drawn in towards the vortex ring. Entrainment of the bubble into the ring occurs at the line demarcating stage I and II. Within stage II, the bubble elongates in the azimuthal direction along the core, followed by contraction and then begins to gradually break up into a set of smaller bubbles, as in figure 1(c–g). In stage III, the break-up is complete and the set of smaller broken bubbles slowly moves around in the azimuthal direction within the ring (figure 1
h). In some cases, as we shall see later, the bubbles eventually escape from the ring, and this is denoted as stage IV, with the line between the two demarcating the time of escape. It may be noted that the data shown for each of the vortex ring cases with and without the bubble in figure 5 were obtained as an average of three independent runs with variation between runs being indicated by error bars at certain locations, which is seen to be about
 $0.5R$
. The convective speed at any given instant normalized by the initial convection speed may be easily ascertained from figure 5 as the slope of the position–time data shown.
The vertical position
 $(z/R)$
of the vortex ring as a function of time (
 $t^{\ast }=tU_{c}/R$
) when the ring is interacting with a bubble of diameter
 $(D_{b})$
. Results are shown for six vortex ring strengths
 $({\it\Gamma})$
represented in terms of the Weber number. The plot is used to demarcate four stages (I–IV) during the interaction of the bubble and vortex ring. Data for the ring interacting with the bubble are shown in the main plot with filled symbols, with
 $\mathit{We}$
values shown in the legend and
 $\mathit{Re}$
values in table 1, while the corresponding open symbols shown in the inset represent the motion of the same ring in the absence of the bubble. The dashed line shows the Fukumoto & Moffatt (Reference Fukumoto and Moffatt2000) viscous ring model.

One of the most striking features visible from the plot is the difference between low- and high-
 $\mathit{We}$
interactions. In high-
 $\mathit{We}$
cases, like
 $\mathit{We}=131$
shown in figure 1, the difference in vertical location between the vortex ring that is interacting with the bubble (▸) and the baseline ring in the absence of the bubble, represented by the dashed line, is very small. As
 $\mathit{We}$
is decreased, the difference in convection speed and hence the vertical location between the interacting ring and the baseline ring increases. In particular, in the
 $\mathit{We}=3$
case, there is a very significant drop (about 30 %) in the convection speed of the ring at later times when it is interacting with a bubble. This is a first indication that the interaction between the bubble and the ring is having a significant impact on the vortex ring as well. As the small
 $\mathit{We}$
indicates, the significant impact on the vortex ring occurs when the surface tension forces are comparable to the inertial forces. We shall discuss this in more detail later in this section.
We shall present in the rest of this section results, from both the bubble dynamics and vortex dynamics perspective, of the initial stages of interaction comprising stages I and I, while stages III and IV are discussed in the next section.
3.1. Bubble dynamics
We now begin by presenting results from the bubble dynamics perspective for the initial stages of interaction comprising stages I and II. We shall present here visualizations and analysis of the processes of bubble entrainment into the ring, and its subsequent deformation leading to break-up, as a function of the vortex ring strength or equivalently the Weber number (
 $\mathit{We}$
).
3.1.1. Bubble capture by the vortex ring (stage I)
Bubble capture is the beginning of the vortex ring–bubble interaction. The low pressure within the core of the vortex ring induces motion of the bubble into the vortex core in a spiralling path, as seen in figures 1 and 2. During this capture process, the bubble undergoes extreme elongation and wraps itself around the core, before reaching an equilibrium radial position within the vortex core. This type of bubble capture process has been observed for example in the numerical study of Chahine (Reference Chahine and Green1995), and in the experiments of Sridhar & Katz (Reference Sridhar and Katz1995) and Oweis et al. (Reference Oweis, Van der Hout, Iyer, Tryggvason and Ceccio2005).
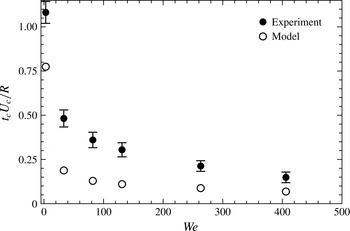
An important quantity related to the capture process is the capture time
 $(t_{c})$
of the bubble. We define
 $t_{c}$
here along the lines of Oweis et al. (Reference Oweis, Van der Hout, Iyer, Tryggvason and Ceccio2005), as the time taken for the bubble to move to a location within the core (
 $r=a/4$
) from an initial radial location
 $r=3a$
from the centre of the core (
 $a=\text{core radius}$
). We have experimentally measured this capture time from time sequences of the bubble visualization (as in figure 2) for the different
 $\mathit{We}$
cases, and this is shown in figure 6 by the solid symbols. The data in the figure are normalized by the vortex ring time scale (
 $R/U_{c}$
) and also include error bars obtained from three repetitions of the experiment. We find as one might expect that
 $t_{c}$
decreases as the ring circulation or
 $\mathit{We}$
is increased.
The variation of normalized capture time with Weber number. Filled circles show experimental data and open circles data from a simple model based on a radial force balance. Ring Reynolds number for the data points from left are 3430, 11 900, 21 200, 29 900, 45 200 and 61 500.

The capture time can be modelled by doing a radial balance of the dominant forces acting on the bubble, as done for example by Oweis et al. (Reference Oweis, Van der Hout, Iyer, Tryggvason and Ceccio2005). Along their lines, we neglect the bubble acceleration and shear lift force in this balance, as these are small compared to the pressure gradient and drag-induced forces, due to the low air density and the negligible vorticity outside the vortex core, respectively. Hence, the radial force balance reduces to a balance between the pressure-gradient-induced force
 $(F_{P})$
and the drag force
 $(F_{D})$
on the bubble outside the vortex core. Further, assuming that the largest component of bubble velocity is in the radial direction
 $(u_{b,r})$
, the radial force balance can be written as
 $$\begin{eqnarray}\frac{{\it\rho}u_{{\it\theta}}^{2}V_{b}}{r}=\frac{1}{2}{\it\rho}C_{D}\left(\frac{{\rm\pi}}{4}\right)D_{b}^{2}u_{b,r}^{2},\end{eqnarray}$$
where
 $u_{{\it\theta}}$
is the azimuthal bubble velocity and
 $V_{b}$
is the bubble volume. In our case, where we consider a relatively thin vortex ring, the azimuthal velocity
 $u_{{\it\theta}}$
may be approximated by the induced velocity of a line Gaussian vortex. The radial velocity,
 $u_{b,r}$
, at any given radial location
 $(r)$
, can then be obtained from the above radial equilibrium equation using an appropriate expression for the drag coefficient (
 $C_{D}$
) valid over a large range of bubble Reynolds numbers (
 $\mathit{Re}_{b}=u_{b,r}D_{b}/{\it\nu}$
, where
 ${\it\nu}$
is the kinematic viscosity),
 $C_{D}=(24/\mathit{Re}_{b})(1+0.197\mathit{Re}_{b}^{0.63}+0.00026\mathit{Re}_{b}^{1.38})$
(Haberman & Morton Reference Haberman and Morton1953). The capture time
 $(t_{c})$
can then be found by integration of the thus obtained radial velocity
 $(u_{b,r})$
from an initial location,
 $r=3a$
, to
 $r=a/4$
.
The above simple model is similar to that of Oweis et al. (Reference Oweis, Van der Hout, Iyer, Tryggvason and Ceccio2005), except for the fact that we use a more complete expression for
 $C_{D}$
due to the much larger bubble Reynolds numbers
 $(\mathit{Re}_{b})$
in our study. The capture time
 $(t_{c})$
can be evaluated from this model, given the bubble size
 $(D_{b})$
, the vortex strength
 $({\it\Gamma})$
, and its core size (a). Shown in figure 6 in open symbols is
 $t_{c}$
evaluated using this model. As may be seen from the figure, the qualitative trend of the values obtained from this simple model are in reasonable agreement with the experimental values. The quantitative values are however not close, with the model always under-predicting the experimental values, this being similar to the case in Oweis et al. (Reference Oweis, Van der Hout, Iyer, Tryggvason and Ceccio2005). We find that at low
 $\mathit{We}$
, the model gives values about 25 % lower than the measured values, while at higher
 $\mathit{We}$
, the difference increases to about 50 %, consistent with the fact that bubble deformations, that have not been modelled, increase with
 $\mathit{We}$
. Besides bubble deformations, the observed differences are also likely to be linked to other features observed in the experiments that have not been modelled. This includes, for example, the effects of added mass and lift forces that become more important as the bubble approaches the vortex core (Oweis et al.
Reference Oweis, Van der Hout, Iyer, Tryggvason and Ceccio2005), apart from the fact that the bubble modifies the vorticity distribution.
As the ring circulation, or equivalently
 $\mathit{We}$
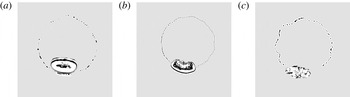
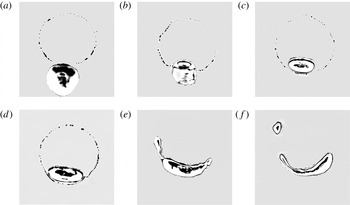
, is varied, the appearance (or shape) of the captured bubble and the radial equilibrium location of the captured bubble also change. This is illustrated in figure 7, where we present top view visualization of the bubble after it has been captured by the vortex ring. In each case, the visualization corresponds to an instant in time when the bubble has reached a radial equilibrium position, with further deformation of the bubble with time being purely in the azimuthal direction. We shall first discuss the shape and surface waves on the bubble at this instant, and then discuss the radial equilibrium position. One can see from the images that the bubble in figure 7(a) has a relatively smooth surface, while the bubble in figure 7(b) has a lot of wrinkling or small-scale features, with the complete bubble surface having a wrinkled appearance in figure 7(c). It appears that this change in the nature of the bubble surface is linked to the vortex ring becoming unstable, as the change in appearance corresponds well to the critical or transition
 $\mathit{Re}$
for the vortex ring. Based on the experimental results of Glezer (Reference Glezer1988), and also from our own visualizations, the critical
 $\mathit{Re}$
for the rings occurs at
 $\mathit{Re}={\it\Gamma}/{\it\nu}\sim 11\,000$
, which corresponds to the
 $\mathit{We}\sim 33$
case in our studies. Hence, the ring in figure 7(a) at a
 $\mathit{Re}=3430$
is laminar, while the cases in figures 7(b) and 7(c), corresponding to
 $\mathit{Re}$
well above the critical value, are turbulent. It is thus clear that the nature of the bubble surface at capture depends on whether the ring is laminar or turbulent, with the latter showing a wrinkled surface with much smaller-scale features.
Bubble visualization immediately after bubble capture for different vortex ring strengths
 $({\it\Gamma})$
, and correspondingly different ring Reynolds numbers
 $({\it\Gamma}/{\it\nu})$
: (a)
 $\mathit{Re}=3430$
,
 $\mathit{We}=3$
,
 $t^{\ast }=4.63$
, (b)
 $\mathit{Re}=29\,900$
,
 $\mathit{We}=131$
,
 $t^{\ast }=4.44$
, (c)
 $\mathit{Re}=61\,500$
,
 $\mathit{We}=406$
,
 $t^{\ast }=3.88$
, the times being with reference to figure 5. In each case shown, the bubble has reached its radial equilibrium position. In (a), one can see that the large bubble is displaced from the microbubbles that mark the centre of the vortex core, while in (b) and (c) the large bubble is at the centre of the microbubbles.

We shall now proceed to discuss the radial location of the bubble in figure 7(a–c). The picture in figure 7(a) is striking as it shows that the captured large bubble is distinctly displaced from the small bubbles that presumably mark the centre of the vortex core. It should be stressed here that the bubble shown in figure 7(a) has reached a radial equilibrium position with further motion/deformation of the bubble occurring only in the azimuthal direction, as may be seen from the corresponding time sequence shown in figure 8(c,d). The fact that larger bubbles have a radial equilibrium position away from the core has been seen earlier in the work of Sridhar & Katz (Reference Sridhar and Katz1999), who discuss this point based on the radial force balance. As discussed by them, the radial equilibrium location within the vortex core can be found from the balance between the radially inward pressure-gradient-induced force
 $(F_{P}={\it\rho}u_{{\it\theta}}^{2}V_{b}/r)$
and the radially outward lift force
 $(F_{L}=(1/2){\it\rho}C_{L}({\rm\pi}/4)D_{b}^{2}u_{{\it\theta}}^{2})$
, where
 $u_{{\it\theta}}={\it\Gamma}r/2{\rm\pi}a^{2}$
is the azimuthal velocity of the bubble, and
 $V_{b}$
is the bubble volume. Substituting for the azimuthal velocity into the expressions, it is clear that
 $F_{P}$
is proportional to
 $({\it\Gamma}^{2}rD_{b}^{3})$
while
 $F_{L}$
is proportional to
 $({\it\Gamma}^{2}r^{2}D_{b}^{2})$
. Hence, as the bubble gets larger, the pressure-gradient-induced force gets much stronger, and the balance requires that the equilibrium radial location
 $(r)$
of the bubble be larger. This of course does not take into account the modification of the vorticity field, but gives a broad indication that larger bubbles would have an equilibrium radial position away from the vortex centre.
As the strength of the ring increases, as in figure 7(b,c), the experimental visualization shows that the equilibrium radial location of the bubble shifts to the centre of the core, as marked by the smaller microbubbles. It is not possible to explain this using the radial force balance in the form discussed above, as both
 $F_{P}$
and
 $F_{L}$
have the same
 ${\it\Gamma}^{2}$
dependence. This is hence likely to be related to the modification of vorticity, as suggested above, and as will be shown later in this section. In summary, we find that at lower vortex strengths (lower
 $\mathit{We}$
), the bubble is displaced from the vortex centre, while at higher vortex strengths, the bubble pierces through the vortex core and sits in the centre of the vortex.
Time sequence of bubble visualization images showing the capture and deformation of a bubble for the low
 $\mathit{We}=3$
case. The non-dimensional time (
 $t^{\ast }$
) corresponding to each image shown is (a) 3.19, (b) 4.41, (c) 4.61, (d) 4.74, (e) 6.47, and (f) 7.27, the times being with reference to figure 5.

3.1.2. Bubble dynamics within the vortex ring (stage II)
We shall now proceed to present results of the bubble deformation following capture, in what we refer to as stage II (as defined in figure 5). Top view bubble visualizations beginning from bubble capture are shown in figure 8 for the
 $\mathit{We}=3$
case. Figure 8(a–c) show capture, with 8(c) being the same as figure 7(a); this figure shows that the captured large bubble is displaced from the micron-sized bubbles that mark the vortex core. Following capture in figure 8(c), one can see pure azimuthal growth of the bubble in figure 8(d) showing that figure 8(c) does indeed show the radial equilibrium position. After this, in figures 8(e) and 8(f), one can see further elongation of the bubble in the azimuthal direction. This elongation occurs as a result of the azimuthal pressure difference resulting from the modified vorticity distribution in the presence of the bubble, as discussed in more detail later in this section. This azimuthal pressure difference stretches the bubble, which in turn leads to gradual breaking of a small bubble from the large bubble through necking as seen in figure 8(e,f).
As the ring strength is increased,
 $\mathit{We}$
increases, and the same broad features of bubble capture and azimuthal expansion are seen. We have already discussed the
 $\mathit{We}=131$
case that was shown in figure 1, where we can see capture of the bubble and bubble elongation as seen in the
 $\mathit{We}=3$
case in figure 8. In the
 $\mathit{We}=131$
case (figure 1), one can however see surface perturbations on the bubble that are absent at lower
 $\mathit{We}$
, which continue to grow as the bubble expands following capture. Following expansion, the bubble also contracts azimuthally with the surface perturbations continuing to grow. This gradually leads to the formation of a number of small bubbles as seen in figure 1(h).
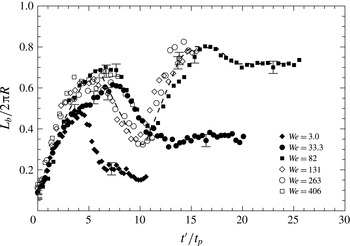
From visualizations such as those in figures 1 and 8, we can extract bubble size information at different times. In particular, we can extract the azimuthal length of the bubble
 $(L_{b})$
following capture, and this is shown in figure 9, where
 $L_{b}$
is normalized by the vortex ring circumference
 $(2{\rm\pi}R)$
. It may be noted that the azimuthal bubble expansion length shown for each of the vortex ring cases in figure 9 were obtained as an average of three independent runs with variation between runs indicated by error bars. In the figure, the time (
 $t^{\prime }$
) starts from the instant of bubble capture and is normalized by a pressure-gradient-based time scale (
 $t_{p}$
) discussed below. The pressure difference between the core of a single Gaussian line vortex with core size a and the far field is
 ${\rm\Delta}P=\{0.87{\it\rho}({\it\Gamma}/2{\rm\pi}a)^{2}\}$
(Oweis et al.
Reference Oweis, Van der Hout, Iyer, Tryggvason and Ceccio2005), while it is expected to be closer to the far-field pressure when the bubble sits in the centre of the vortex core, as discussed in more detail in the next section (see figure 11). Broadly speaking, the bubble is thus exposed to a pressure difference in the azimuthal direction, which is of the order of
 ${\rm\Delta}P=\{0.87{\it\rho}({\it\Gamma}/2{\rm\pi}a)^{2}\}$
, that is responsible for elongation of the bubble after capture. A time scale
 $(t_{p})$
may be obtained from the above pressure difference,
 $t_{p}=(0.87{\it\rho}{\it\Gamma})/({\rm\Delta}P{\rm\pi})={\rm\pi}(2a)^{2}/{\it\Gamma}$
.
The variation of bubble expansion length
 $(L_{b})$
along the azimuthal direction within the vortex ring with time starting from the instant of capture. The normalized bubble expansion length
 $(L_{b}/2{\rm\pi}R)$
is plotted with time non-dimensionalized with an azimuthal pressure-difference-based time scale
 $(t_{p})$
. The initial bubble expansion data for the different
 $\mathit{We}$
cases collapse onto a single line.

In figure 9, we plot the bubble elongation data against time (
 $t^{\prime }$
) non-dimensionalized by this time scale
 $t_{p}$
, and we can see that the initial azimuthal elongation (
 $t^{\prime }/t_{p}<4$
) in all the six
 $\mathit{We}$
cases from 3 to 406 lie nearly along a single line. The collapse of the data for
 $t^{\prime }/t_{p}<4$
with this non-dimensionalization does however validate the fact that the azimuthal elongation of the bubble is indeed determined by the azimuthal pressure difference given above. One can further see from figure 9 that the slope of the contraction in all cases is also similar with this non-dimensionalization. One can however see from the figure that there are differences in the data for
 $t^{\prime }/t_{p}>4$
, which corresponds to the time after the bubble reaches its maximum elongation. For
 $\mathit{We}$
of 3 and 33.3, the trend after first maximum bubble expansion is different compared to higher
 $\mathit{We}$
(
 $\mathit{We}>50$
). For
 $\mathit{We}>50$
, the trend of bubble expansion, contraction and re-expansion is found to be nearly similar, as shown by the dashed line in the plot.
At later times, in all
 $\mathit{We}$
cases, the bubble breaks up into smaller ones, whose combined length is shown in the plot, and is seen to reach an approximately constant value. It may also be seen from the figure that both the first maximum bubble elongation
 $(L_{b,max})$
at
 $t^{\prime }/t_{p}$
between 4 and 7 and the final steady bubble length at large time, increase with
 $\mathit{We}$
at low
 $\mathit{We}$
, and then saturate for
 $\mathit{We}>200$
.
 $L_{b,max}$
saturates at
 $L_{b}/(2{\rm\pi}R)$
of about 0.7, while the long time bubble length saturates at about 0.8, both corresponding to
 $\mathit{We}>200$
.
3.2. Vorticity dynamics
We shall now present results from the vortex dynamics perspective for the initial stages of interaction between the ring and the bubble comprising stages I and II. With this in mind, we present, as in figure 3, measurements of the azimuthal vorticity obtained from time-resolved PIV in the
 $x{-}z$
plane cutting through the centre of the vortex ring. The time sequence of the measured azimuthal vorticity for the
 $\mathit{We}=3$
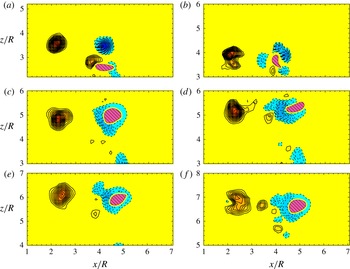
case is shown in figure 10, with the bubble in each plot being marked by a hatched area (magenta online). In figure 10(a), the bubble is outside the vortex ring, and the vorticity distribution of the undisturbed vortex ring can be seen. In addition, vorticity can also be seen around the approaching bubble, as seen in rising single bubble studies (Brücker Reference Brücker1999; Mougin & Magnaudet Reference Mougin and Magnaudet2001). At these low
 $\mathit{We}$
, the vorticity shed from the bubble is of the same order as the strength of the ring and is hence clearly visible in the vorticity plots. As the bubble gets pulled into the ring, it elongates and pierces into the ring, as shown in figure 8(b), and in the process distorts the vorticity distribution as shown in figure 10(b). In this low-
 $\mathit{We}$
case, as discussed earlier, the radial equilibrium position of the large bubble is not at the centre of the vortex, but is displaced radially outward from the centre of the vortex core. This may be seen in figure 10(c), where the higher vorticity contours of the right-hand-side core are bunched to the left of the bubble, indicating that the larger bubble is not sitting at the centre of the modified vortex core. After the bubble is captured, it elongates in the azimuthal direction, reaching maximum expansion and then contracts back as may be seen in figure 9. The vorticity plot corresponding to maximum elongation is shown in figure 10(d), and figure 10(e,f) correspond to later times, where the bubble length
 $(L_{b})$
reaches a constant value as may be seen from figure 9. There is no noticeable change in bubble size in figure 10(e,f), as there is not much change in the azimuthal length of the bubble after contraction. One can also clearly see from the figures that the left-hand-side core is relatively unaffected throughout the interaction process, as the bubble in the right-hand core is not sufficiently stretched to reach the other side.
Time sequence of principal azimuthal vorticity showing the different stages of vortex ring–bubble interaction for the low
 $\mathit{We}=3$
case. In each image, the bubble is marked as a hatched area (magenta online), while the solid and dashed line contours represent positive and negative vorticity, respectively. The non-dimensional time (
 $t^{\ast }$
) corresponding to each image is (a) 3.18, (b) 4.29, (c) 4.6, (d) 6.4, (e) 7.25 and (f) 7.8, the times being with reference to figure 5. Non-dimensional vorticity contour (
 ${\it\omega}R/U_{c}$
) levels shown are
 $\pm 1.6,2.2,2.9,\dots$
.

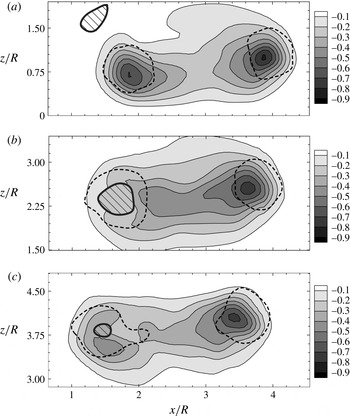
Contour plots of the normalized pressure distribution
 $P^{\ast }$
around the vortex ring calculated from the measured PIV velocity field. The vortex cores are marked by a dashed line while the bubble is indicated by the hatched region. The normalized pressure
 $P^{\ast }$
is defined as
 $(P-P_{\infty })/{\rm\Delta}P$
, where
 ${\rm\Delta}P=0.87{\it\rho}({\it\Gamma}/2{\rm\pi}a)^{2}$
is the pressure reduction at the centre of a two-dimensional Gaussian vortex. Non-dimensional time (
 $t^{\ast }$
) corresponding to (a), (b) and (c) is 1.77, 3.85 and 5.25 respectively (
 $\mathit{We}=406$
). As seen in (a), the pressure
 $P^{\ast }$
at the centre of the vortex core before bubble capture is close to
 $-1$
indicating that it is similar to an equivalent two-dimensional Gaussian vortex. In (b) and (c), one can see the large pressure difference between the two vortex cores, with the pressure in the left-hand core affected by the bubble being around
 $-0.2$
, and that of the unaffected right-hand core being around
 $-0.9$
.

As
 $\mathit{We}$
is increased, the time sequence of vorticity snapshots shows broadly similar features, although there are some important changes as well. The vorticity time sequence for the high
 $\mathit{We}$
of 131 was shown earlier in figure 3. A common feature in both the high-
 $\mathit{We}$
case (figure 3) and the low-
 $\mathit{We}$
case (figure 10) is the fact that the bubble pierces through the vortex core in plot (b), distorting the vorticity distribution as it enters the ring. Once the bubble is thus captured by the ring, the contours rejoin and the vorticity gets distributed in an annular form around the captured bubble. On the other hand, the differences between the high and low
 $\mathit{We}$
cases are seen for example in the radial location of the bubble after capture. In the high-
 $\mathit{We}$
case, the bubble is located roughly in the vortex centre, while in the lower-
 $\mathit{We}$
case, the bubble is clearly off the vortex centre, as seen earlier from the bubble dynamics in figure 7. The other difference is seen in plots (e) and (f) following maximum expansion of the bubble. In the higher-
 $\mathit{We}$
case (figure 3) the expansion of the bubble is larger, and hence the stretched bubble, or some fragments of it, reaches the other core as well, resulting in some noticeable distortion of the other core, unlike the lower-
 $\mathit{We}$
case (figure 10).
The pressure field around the vortex core can be calculated from knowledge of the velocity field using the Navier–Stokes equation. This can be done by substitution of the velocity field into the Navier–Stokes equation to determine the pressure gradient term, which can in turn be integrated with respect to a reference pressure, say the far-field value, to get the pressure field. As pointed out by Dabiri et al. (Reference Dabiri, Bose, Gemmell, Colin and Costello2013), there are issues in doing the above calculations with experimental PIV data that are inherently noisy, and they developed an appropriate algorithm to minimize these issues and implemented it into a code. Utilizing this code, we have determined the pressure field from our measured PIV velocity field, and this is shown in figure 11, the pressure being shown in non-dimensional form,
 $P^{\ast }=(P-P_{\infty })/{\rm\Delta}P$
, where
 ${\rm\Delta}P=0.87{\it\rho}({\it\Gamma}/2{\rm\pi}a)^{2}$
is the pressure reduction at the centre of a two-dimensional Gaussian vortex as discussed earlier and
 $P_{\infty }$
is the far-field pressure. The pressure fields shown correspond to the
 $\mathit{We}=406$
case, with the core (lowest vorticity contour) being marked in each case by a dashed line, and the bubble by the hatched area. In figure 11(a), the bubble is outside the ring, and the non-dimensional pressure (
 $P^{\ast }$
) in both cores is close to
 $-0.9$
, indicating that the core pressures are low and close to the values for an equivalent two-dimensional Gaussian vortex. On the other hand, the pressure field in figure 11(b) at bubble capture is significantly modified, with the pressure in the left-hand core being much closer to the far-field pressure at
 $-0.3$
, while that in the right-hand core remains nearly unaffected with a pressure of about
 $-0.8$
. There is thus a large non-dimensional pressure difference of about 0.5 in the azimuthal direction, which is responsible for the azimuthal elongation of the bubble, discussed earlier. Figure 11(c) corresponds to maximum elongation of the bubble in the azimuthal direction and hence a relatively smaller bubble radius. In this case, the pressure in the left-hand core with the bubble is a little lower with a value of about
 $-0.4$
.
The pressure fields shown highlight the differences in pressure caused by the distorted vorticity distribution within the core, which is broadly in an annular form within the water phase around the bubble. It may be noted that these pressure fields were calculated with the fluid velocity within the bubble set to zero, thus giving no variation in pressure within the bubble area, as one would expect in the real case due to the much smaller density of air compared to that of water. Further, it should also be noted here that in these cases, the change in pressure across the interface due to surface tension is very small compared to
 ${\rm\Delta}P$
.
We have so far discussed the bubble and vorticity dynamics in stages I and II of the ring and bubble interaction. By the end of the second stage, the bubble has been completely broken up in to smaller bubbles, as shown for example in figure 1(h) for the high-
 $\mathit{We}$
case and figure 8(f) for the low-
 $\mathit{We}$
case. At the same instant in time, the vorticity fields in the high- and low-
 $\mathit{We}$
cases are shown in figures 3(f) and 10(f), respectively. In both cases, the vorticity is distributed in an annular form within the water phase, caused by the presence of the bubble in the centre. A simple and robust measure of the integral effect of the vorticity distribution is the convection speed of the vortex ring, which is the slope of the ring position data in figure 5. At this instant (end of stage II), the convection speed data show a distinct difference between the low- and high-
 $\mathit{We}$
cases. In the high-
 $\mathit{We}$
cases, the data for the ring with the bubble are nearly the same as the baseline case, while in the lower-
 $\mathit{We}$
case (
 $\mathit{We}\sim 3$
), there is a clear reduction in the convection speed of the ring. This is an indication of the fact that the ring has been considerably affected by the bubble at this time.
This naturally raises the question of what could be possible mechanisms that may be responsible for the reduction in convection speed of the ring. One possible mechanism is related to the distorted annular vorticity field caused by bubble capture, which occurs at the line demarcating stages I and II in figure 5. Around this time, bubble capture occurs at a rapid rate, but there is no significant change in convection speed at this time, as seen in figure 5. This suggests that the modified annular vorticity distribution caused by bubble capture does not by itself directly affect the convection speed. The reduction in convection speed may then be caused by an instability of the modified vortex core at bubble capture (such as figure 10 c), which then gradually develops. There are a few features of this modified vortex core at bubble capture that may be responsible for instability and reduction in the convection speed of the ring. These include the annular form of vorticity distribution within the water phase, and the presence of sharp density and viscosity changes at the interface. For example, Dritschel (Reference Dritschel1986) has shown that a single annular two-dimensional distribution of constant vorticity in an incompressible (single) phase can be unstable to two-dimensional perturbations, which can lead to the formation of multiple vortices, or what they refer to as ‘break-up’ of the vortex. We shall see in the next section that this is what happens in our case, although the precise reason for it in our case is not very clear.
4. Thin core rings: later stages of interaction
We present in this section the later stages of the bubble–vortex ring interaction discussed in the previous section. This comprises stages III and IV as defined in figure 5, corresponding to the quasi-steady state, with a set of broken bubbles inside the ring, and the time after which the bubble escapes from the ring, respectively.
4.1. Bubble dynamics
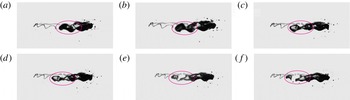
The break-up of the bubble into smaller bubbles is complete by the end of stage II, and hence there is almost no further break-up of the bubble within stage III. This stage may hence be referred to as a quasi-steady stage from the bubble dynamics perspective. This is shown by an example time sequence of bubble visualization within this stage in figure 12, that shows that the number of bubbles is almost the same. One of the smaller bubbles is marked in the first image, with the same bubble being marked in the other two images. This shows the gradual anti-clockwise azimuthal motion of the bubbles within the core during this stage, as indicated by the arrow in the first image.
A time sequence of bubble visualization within stage III. The non-dimensional time (
 $t^{\ast }$
) corresponding to (a), (b) and (c) is 12.69, 25.3 and 47.59 respectively (
 $\mathit{We}=131$
). As may be seen, the number of bubble fragments remains nearly the same in all three cases. One of the smaller bubbles is marked in the first image, with the same bubble being marked in the other two images, showing the gradual azimuthal motion of the bubbles within the core.

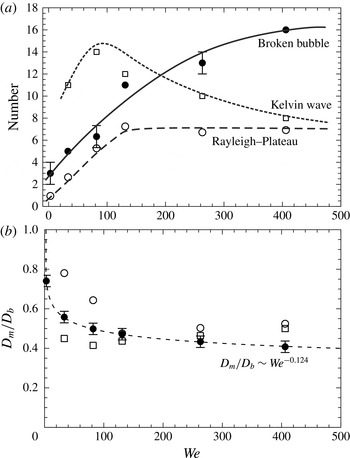
In each of the Weber number cases studied, there is a fixed number of smaller bubbles within stage III, as no further break-up occurs within this stage. Shown in figure 13(a) is the number of smaller bubbles in this stage as a function of
 $\mathit{We}$
. As may be seen from the plot, the number of smaller bubbles formed as a result of break-up increases with
 $\mathit{We}$
, starting from 3 at low
 $\mathit{We}$
, and reaching about 16 at the higher
 $\mathit{We}$
of 406. It should be noted that all the values shown here are a result of the average of three experiments done for each
 $\mathit{We}$
case, with the variation between the three runs indicated by the error bars in the plot. Associated with this increase in the number of smaller bubbles is a reduction in the average diameter of the bubbles formed
 $(D_{m})$
, which is shown in figure 13(b) normalized by the nominal bubble size
 $D_{b}$
before entrainment. We can fit a power law to the data, and we find that the average diameter of the formed bubbles varies as
 $\mathit{We}^{-0.124}$
, as shown in the figure. This may be compared to the more-studied case of droplet/bubble break-up due to isotropic turbulence, where Shinnar (Reference Shinnar1961) showed that the average droplet/bubble size formed after complete break-up by isotropic turbulent flow varies as
 $\mathit{We}^{-0.6}$
based on simple arguments,
 $\mathit{We}$
here being defined as the ratio of kinetic energy of oscillating droplet/bubble to the surface energy.
Variation of (a) the number of bubbles, and (b) their diameter
 $(D_{m})$
, normalized by the nominal bubble size
 $D_{b}$
before entrainment, with
 $\mathit{We}$
after complete break-up of the bubble (stage III). The number of Kelvin waves seen from the visualizations is also shown in (a), and is found to be different from the number of smaller bubbles. The number of Rayleigh–Plateau instability waves that fit on the cylindrical bubble is also shown in (a). The number of instability waves is close to the number of bubbles at low
 $\mathit{We}$
, but deviates at larger
 $\mathit{We}$
. ●, Experiment; ▫, Kelvin wave; ○, Rayleigh–Plateau instability.

In these cases of bubble break-up due to isotropic turbulence, as discussed by Martínez-Bazán et al. (Reference Martínez-Bazán, Montañés and Lasheras1999), break-up occurs as a result of the combined effects of inertia, surface tension and turbulent energy dissipation per unit mass. Risso & Fabre (Reference Risso and Fabre1998) further suggest that the time response of the bubble controls the maximum amount of energy which can be extracted from each turbulent eddy and the viscous damping limits the energy that the bubble can accumulate during its fluctuating deformation. This problem has received a lot of attention due to its importance in bubbly turbulent flow where the average diameter of the completely broken-up bubble determines the interfacial area, which in turn determines the rate of mass, momentum and energy transfer between the two phases. Our experiments suggest that the exponent is different in the present idealized case of a single vortex structure (ring) compared to Shinnar (Reference Shinnar1961), which is for isotropic turbulence. It should be noted here that the change in exponent is not unexpected, as in the isotropic turbulence case, the whole process of break-up is considerably more complex due to the multi-scale nature of turbulent structures. The differences between the two can be firstly attributed to the fact that bubble break-up in the turbulent case not only occurs due to an intense single eddy, but also through the combined action of a succession of different eddies (Risso & Fabre Reference Risso and Fabre1998). This is in addition to the obvious fact that in the turbulent case, the broken bubbles are always exposed to eddies with smaller scales that they can interact with, unlike in the present case.
A close-up of the bubble break-up in our present case from side visualizations is shown in figure 14; this occurring in stage II. The visualizations show both the large bubble being deformed within the ring, as well as the micron-sized bubbles tracking the vortex core. The smaller bubbles tracking the core clearly show the Kelvin waves in the core of the vortex ring, as discussed by Widnall et al. (Reference Widnall, Bliss and Tsai1974). It is natural to then ask whether the number of smaller bubbles is related to the number of Kelvin waves in the ring, which can be easily counted from the visualizations, besides getting an estimate from the theory based on the relative core size (Widnall et al.
Reference Widnall, Bliss and Tsai1974). We present in figure 13(a), the number of Kelvin waves as counted from the visualizations at each
 $\mathit{We}$
, and it is clear that the number of Kelvin waves does not match the average number of bubbles formed after complete break-up. The Kelvin waves do however play some part in the break-up as seen in the images in figure 14, where the bubble appears to break up due to these azimuthal waves, as may be seen by following the time sequence of images. The process of necking can be seen in figure 14(b), which develops leading to the formation of a gas bridge in figure 14(e) and break-up in figure 14(f). However, the number of bubbles formed after complete break-up is clearly not determined by the Kelvin waves. Apart from the mismatch in numbers discussed earlier, there is also a time-scale issue, as these Kelvin waves are typically short lived as they rapidly grow and result in the ring becoming turbulent. The complete break-up of the bubble on the other hand takes much longer.
Successive images of bubble break-up while interacting with the vortex ring illustrating ‘pinch-off’ of smaller bubbles (
 $\mathit{We}=131$
). Necking can be seen in (d). The non-dimensional time (
 $t^{\ast }$
) corresponding to each image is (a) 4.72, (b) 4.75, (c) 4.82, (d) 4.85, (e) 4.88 and (f) 4.91, the times being with reference to figure 5.

Apart from the Kelvin waves, another possible mechanism that could determine the average size or number of bubbles following break-up would be the classical Rayleigh–Plateau instability of the stretched cylindrical bubble. The wavelength corresponding to maximum growth rate for this instability is about 4.5 times the diameter of the cylindrical bubble. In our case, if we use the minimum diameter of the stretched bubble
 $(d_{br,min})$
, which corresponds to the first maximum azimuthal length
 $(L_{b,max})$
, we can get a wavelength for each one of the different
 $\mathit{We}$
cases, from the data set shown in figure 9. From this wavelength, we can get both the number of waves that can fit on a cylindrical bubble of length
 $L_{b,max}$
and the diameter of the corresponding broken-off bubble, as shown in figures 13(a) and 13(b), respectively (open circles). As may be seen from the values in the plot, the number of these waves that fit into the stretched bubble and their variation with
 $\mathit{We}$
is in reasonable agreement with experimental data at low
 $\mathit{We}$
(
 $\mathit{We}<150$
), although it is not very close. At
 $\mathit{We}>150$
, the visualized number of broken-off bubbles continues to increase, while the number of instability waves is fixed as the bubble length and diameter saturate, as discussed earlier with reference to figure 9. The diameter of the broken-off bubble estimated from these waves is also shown in figure 13(b), showing a similar trend to those seen in the experiments, although the actual values are again not very close. It should be noted here that the number of broken bubbles seen in the experiments is typically larger than from the instability wavelength, and the difference increases for
 $\mathit{We}>150$
, where the
 $\mathit{Re}$
of the ring is also larger. Although the reason for this is not very clear, the larger number of bubbles seen in the experiments may be caused by the increased level of turbulence as the ring
 $\mathit{Re}$
increases. In addition, differences may be caused by the presence of rotational flow around the bubble.
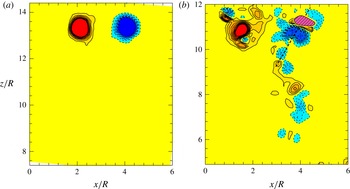
Comparison of principal azimuthal vorticity distribution for a vortex ring (a) without and (b) with interactions with a bubble for
 $\mathit{We}=3$
at a later time (
 $t^{\ast }$
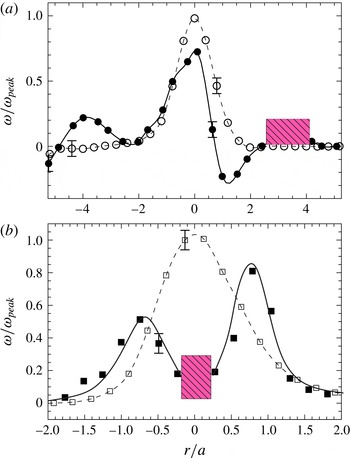
with reference to figure 5 is 14.67). In (b), the vorticity distribution for the ring interacting with a bubble is markedly different from the identical ring in the absence of a bubble shown at the same time in (a). The vortex core in (b), particularly the one on the right with the bubble, appears fragmented with significant shedding from it. The bubble is marked by hatched area (magenta online), while the solid and dashed line contours represent positive and negative vorticity, respectively. Non-dimensional contour levels shown are
 $\pm 0.16,0.32,0.48,\dots ,1.29$
.

4.2. Vorticity dynamics
We present here the azimuthal vorticity measurements during the later stages of interaction between the bubble and the vortex ring. In figure 15, we present the measured vorticity field for the
 $\mathit{We}=3$
case, at non-dimensional time
 $t^{\ast }=14.67$
, where the convection speed of the vortex ring is substantially lower than the base case of the vortex ring without a bubble, as may be seen from figure 5. The figure shows both the base case, in figure 15(a), and the case with bubble interaction in figure 15(b) with only lower level contours shown in both cases to highlight the edges of the vortex and shedding from it. As may be seen from the figures, there is a striking difference in the measured vorticity fields in the two cases. The vorticity field in figure 15(a) shows a clear circular vortex core with no shedding of vorticity from the ring, consistent with the fact that the ring is laminar. On the other hand, the vorticity contours for the case with bubble interactions in figure 15(b) shows a fragmented right-hand core where the bubble is present, with significant shedding of vorticity from this core. The left-hand core is also affected, but not as significantly as the right, but the overall convection speed of the ring has been significantly reduced (about 30 %) as seen in figure 5. Shortly after this, the bubble escapes, leaving behind a ring with a fragmented core that travels significantly slower. We would like to stress here that Sridhar & Katz (Reference Sridhar and Katz1999) also noted vortex distortion in their study, but the vortex core regained its initial undistorted state in that case once the bubble escaped. On the other hand, the effect on the vortex core is a lasting one in our case and the core is left in a fragmented state even after bubble escape.
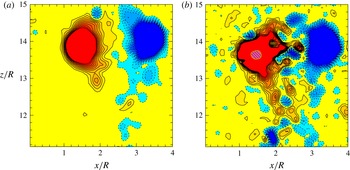
Comparison of principal azimuthal vorticity distribution for a vortex ring (a) without and (b) with interactions with a bubble for
 $\mathit{We}=406$
at later time (
 $t^{\ast }$
with reference to figure 5 is 14.02). In (b), the vorticity distribution for the ring interacting with a bubble is again significantly different from the identical ring in the absence of a bubble shown at the same time in (a). The main difference here is the increased shedding from the ring. However, at this higher
 $\mathit{We}$
, the core appears reasonably intact with no significant deformation, unlike in the lower-
 $\mathit{We}$
case in figure 15. The bubble is shown as the hatched area (magenta online), while the solid and dashed line contours represent positive and negative vorticity, respectively. Non-dimensional contour levels shown are
 $\pm 0.1,0.21,0.32,\dots ,1.06$
.

In contrast to the low-
 $\mathit{We}$
case, the vorticity distribution in the higher-
 $\mathit{We}$
cases show less influence of the bubble on the core, as shown in figure 16 for
 $\mathit{We}=406$
. As in the low-
 $\mathit{We}$
case, both the base ring in the absence of the bubble (in figure 16
a), and the ring after interactions with the bubble in figure 16(b) are shown. Both these fields are shown at non-dimensional time
 $t^{\ast }=14.02$
, where the convection speed is nearly the same as the base ring case, as may be seen from figure 5. In this case, the base ring vorticity field (in figure 16
a) shows inherent shedding from the ring, consistent with the fact that the ring in this case is turbulent (Gan, Dawson & Nickels Reference Gan, Dawson and Nickels2012), as discussed earlier. However, in the case of the ring with the bubble, as shown in figure 16(b), one can see a significant increase in the shedding from the ring compared to 16(a). Although the reason for this increased shedding from the vortex core with the bubble is not completely clear, it is likely to be caused by the shedding from the bubble present within the core, as has been discussed for example in Sridhar & Katz (Reference Sridhar and Katz1999). Despite this increased shedding, the core appears relatively intact in this high-
 $\mathit{We}$
case, unlike in the lower-
 $\mathit{We}$
case in figure 15. The convection speed in this high-
 $\mathit{We}$
case is also relatively unaffected, consistent with the almost intact vortex core.
Principal azimuthal vorticity
 $({\it\omega})$
profile along a radial line through the vortex centre for (a)
 $\mathit{We}=3$
, and (b)
 $\mathit{We}=406$
, at later non-dimensional time (
 $t^{\ast }$
) with respect to figure 5 of 14.67 for (a), and 14.02 for (b). In each case, the vorticity profile in the absence of the bubble is shown by open symbols, while interacting case is shown by filled symbols. The data shown correspond to the vorticity fields shown in figures 15 and 16, respectively. All vorticity values in these plots are normalized by the peak vorticity of the base vortex ring
 $({\it\omega}_{peak})$
. The bubble is marked by the hatched area (magenta online).

The vorticity distribution within the (single) vortex core for the low-and high-
 $\mathit{We}$
cases is shown in figure 17 for both the ring interacting with the bubble, and the base case, to further highlight the differences. In figure 17(a), the vorticity distribution along a 45° line through the core with the bubble is shown for the
 $\mathit{We}=3$
case, as also marked on the image in figure 15(b). The vorticity distribution is clearly quite complex with the presence of multiple peaks: two positive vorticity peaks and one negative vorticity peak. As expected, the base vortex core in the absence of the bubble, shown by the dashed line, is a simple Gaussian profile. In the higher-
 $\mathit{We}$
case shown in figure 17(b), the vorticity is distributed in an annular way around the bubble, the distribution being in the form of two Gaussian profiles with reduced peak vorticity. This type of reduced peak vorticity for cases where the bubble resides within the core is a common feature in these flows, which as we shall see below has consequences.
The variation of (a) enstrophy
 $(Z)$
and (b) circulation
 $({\it\Gamma})$
with time for a vortex ring interacting with a bubble and for the base ring case in the absence of the bubble.
 $Z$
and
 ${\it\Gamma}$
are non-dimensionalized by their respective values at
 $t=0$
, and time is non-dimensionalized by the ring time scale
 $(R/U_{c})$
.

The convection speed of the ring is an integral effect of the vorticity distribution within it. Hence, one way to understand the underlying physics of the reduction of convection speed is to look at the enstrophy or volume integral of the square of the vorticity of the vortex ring. In the current study, as two-dimensional time-resolved PIV measurements have been done, the enstrophy
 $(Z)$
is calculated as the area average of the square of the azimuthal vorticity, this being representative of the principal vorticity in the flow. For the purpose of enstrophy calculation, an area that is about 100 times the core area was used to ensure that all the vorticity corresponding to the vortex ring is included. There is some variation between runs, but this is within the experimental uncertainties, as may be seen by the variation in circulation between time instants and the variation between repetitions of the same experiment shown by the error bars in figure 18. Figure 18(a) shows the variation of enstrophy
 $(Z)$
with time for a low-
 $\mathit{We}$
and a high-
 $\mathit{We}$
case, along with their respective base ring cases;
 $Z$
is non-dimensionalized in each case by its respective initial value
 $(Z_{i})$
. In both the base cases, in the absence of a bubble, a gradual reduction in enstrophy is seen with time due to viscous diffusion of the core, reaching a value of about 0.8 at
 $tU_{c}/R\approx 12$
. In contrast, for the low-
 $\mathit{We}=3$
case, the enstrophy reduction with time is significantly enhanced in the case with a bubble. At small times, the enstrophy reduction is similar to the base case, until
 $tU_{c}/R\approx 4$
, where there is a sharp drop in enstrophy, due to the sudden capture of the bubble by the ring, which results in a sharp drop in peak vorticity. Subsequently, as the bubble expands azimuthally within the ring, the bubble diameter reduces, as may be seen in figure 9, and this leads to an increase in enstrophy, which almost reaches the enstrophy of the base vortex ring at
 $tU_{c}/R\approx 5.4$
. Following this,
 $Z/Z_{i}$
reduces reasonably rapidly reaching what appears to be an asymptotic value of about 0.4, which corresponds to a large reduction of about 50 % compared to the base case at the same time. As stated earlier, this state continues even after the bubble escapes, leaving behind a less coherent vortex ring, whose core appears fragmented as shown in figure 15. In contrast to this large reduction in enstrophy for the low-
 $\mathit{We}$
case, the reduction in enstrophy is relatively small for the higher-
 $\mathit{We}$
case of 263 also shown in figure 18(a). The enstrophy values for this case are in fact close to the base ring case, consistent with the negligible reduction in convection speed for this case, as may be seen from figure 5.
It should be noted here that reduction in enstrophy of a vortex due to interaction with bubbles has been observed earlier. For example, Ferrante & Elghobashi (Reference Ferrante and Elghobashi2007) in their numerical study of the interaction of a Taylor–Green vortex with a large number of entrained small bubbles report a reduction in enstrophy of around 4 % due to the modified vorticity distribution. For a turbulent channel flow with bubbles, Lu et al. (Reference Lu, Fernández and Tryggvason2005) report a large reduction of about 60 % in enstrophy in their DNS study, with suppression of structures. They attribute the observed drag reduction to the reduction in enstrophy and suppression of structures, with more drag reduction seen when their Weber number is closer to 1. Gils et al. (Reference Gils, Guzman, Sun and Lohse2013), for the case of bubbles in Taylor–Couette flow, show that the
 $\mathit{We}$
value close to the inner wall is very important in determining drag reduction, with more drag reduction observed when the bubbles deform. Our results show similar reductions in enstrophy in the more basic interaction of a single bubble with a vortex ring when
 $\mathit{We}\sim 3$
.
The circulation of the vortex core is another integral quantity of interest. In our case, as is typical of many experiments, we calculate the circulation as the line integral of velocity around a sufficiently large closed curve around a core. The resulting values of circulation for the low- and high-
 $\mathit{We}$
cases with corresponding base cases is shown in figure 18(b). As may be seen from the plot, there is some variation in circulation, but this is not significant compared to the variations in time, indicating that the observed variations are within the experimental error. Hence, at a broad level, we find that there is no significant change in the circulation around the core of the vortex ring, although some small variations may be present. It may be noted that Sridhar & Katz (Reference Sridhar and Katz1999) also reported no noticeable change in circulation in their experimental study of a ring interacting with a few smaller bubbles. On the other hand, Cihonski et al. (Reference Cihonski, Finn and Apte2013) in their numerical study of the same case showed an increase in circulation of about 10 %.
As discussed in the end of § 3, the convection speed of the ring was seen to have reduced significantly in the low-
 $\mathit{We}$
case by the end of stage II. We suggested that this reduction could be due to a possible instability of the modified vortex core that developed at bubble capture, with the vorticity being distributed in an annular form around the bubble. As stated there, Dritschel (Reference Dritschel1986), for example, has shown that a single annular two-dimensional distribution of constant vorticity in an incompressible (single) phase can be unstable to two-dimensional perturbations, leading to the formation of multiple vortices, which is what we observe in the present case at low
 $\mathit{We}$
(figure 15
b). We shall see in the following section that this deformation of the core leading to multiple vortices is even more dramatic in the thick ring case.
5. Thick core rings
In §§ 3 and 4, results for bubble interactions with a relatively thin vortex ring of non-dimensional ring radius
 $({\it\epsilon})$
of 0.25 have been presented. In this section, we shall present some results for the case of a thicker vortex ring, with
 ${\it\epsilon}=0.75$
, interacting with a bubble. We shall see that thicker rings, which are inherently more unstable (O’Farrell & Dabiri Reference O’Farrell and Dabiri2012), show even more dramatic effects during interactions with a bubble, leading to clear fragmentation of the vortex core.
The thicker core rings studied here were generated using a smaller 3 mm diameter vortex generator, as compared to the 15 mm generator used for the thin core rings, as discussed in the experimental methods section. The bubble used here was correspondingly of smaller size, so as to maintain the volume ratio
 $(V_{R})$
of the bubble to the vortex core at about 0.1, as in the previous thin core experiments. In particular, two cases were studied: one corresponding to low
 $\mathit{We}$
of 3, and the other corresponding to a high
 $\mathit{We}$
of 387, the difference between the two cases being as before the circulation of the vortex ring. We begin as before by presenting a plot of the vertical location of these rings for the two
 $\mathit{We}$
cases, along with their respective base cases, in figure 19(a). As is clear from the plot, in this thicker core case, one can see significant reductions in convection velocity for the ring interacting with the bubble compared to the base ring case even at higher
 $\mathit{We}$
. This reduction in convection speed of the ring is as before related to the effect of the bubble on the vorticity distribution within the vortex core. This can be seen from the vorticity plots in figure 19(b,c), which show the measured vorticity distributions for the lower
 $\mathit{We}$
case at later times, as marked on figure 19(a) (as c), along with the corresponding base case, marked as (b). As is clear from the vorticity plots, the vortex core after interaction with the bubble (in figure 19
c) is dramatically modified, with each core having completely fragmented into two, while the base ring (in figure 19
b) remains intact at the corresponding time. One can also see from the vorticity plots that the ring after interacting with the bubble has nearly stopped at a vertical location (
 $z/R=14$
), while the base vortex ring has in the same time traversed much further (
 $z/R=25$
) and is continuing to move vertically upwards. These results clearly show that the effects of the interaction of these thicker rings with a bubble are more dramatic than for the thin core rings. This may be attributed to the inherently more unstable nature of the thicker core rings, as discussed by O’Farrell & Dabiri (Reference O’Farrell and Dabiri2012).
(a) Vertical location
 $(z)$
of the vortex ring as a function of time for the thicker core ring for
 $\mathit{We}=3$
and 387, both for the ring interacting with the bubble and the base case without the bubble. (b,c) Vorticity plots corresponding to the time instants marked in (a).

A time sequence of vorticity plots showing the interaction of the ring with the bubble for
 $\mathit{We}=3$
is shown in figure 20. In each case, we present vorticity plots zoomed in around the core, with the vertical location being marked on the
 $y$
-axis. As may be seen from the figure, the bubble is outside the ring in figure 20(a) and is captured by the ring in figure 20(b). In these thicker ring cases, visualizations show that the interactions can be more complex, with the bubble in some cases jumping between cores of the ring. As may be seen from figure 20(c–f), the interactions of the bubble with the ring result in large-scale deformations of the core. It appears that the presence and motion of the bubble within the ring adds perturbations to the vorticity field, which seems to make the vortex ring unstable, leading ultimately to the fragmentation of the core into two pieces in figure 20(f). By this time, the bubble has escaped from the ring, as seen in figure 20(f). It should also be noted that the whole process in this thicker ring case appears to be more three-dimensional, as one might expect.
Time sequence of azimuthal vorticity for the thicker core ring showing the different stages of vortex ring–bubble interaction for
 $\mathit{We}=3$
showing clear fragmentation of the core into two. The bubble is marked by the hatched area (magenta online), while the solid and dashed line contours represent positive and negative vorticity, respectively. The non-dimensional time (
 $t^{\ast }$
) corresponding to each image is (a) 0, (b) 4.06, (c) 8.36, (d) 16.72, (e) 21.73 and (f) 28.36, the times being with reference to figure 19(a).

The enstrophy
 $(Z)$
as a function of time calculated, as before, as the area-averaged square of the azimuthal vorticity, is shown in figure 21(a) for the low-
 $\mathit{We}$
case, with the enstrophy being non-dimensionalized by its initial value
 $(Z_{i})$
. The solid symbols show the case for the ring interacting with the bubble, while the open symbols show the base ring case. In this thicker ring case, the enstrophy, even for the base ring, is seen to reduce with time due to viscous diffusion and resulting cancellation of vorticity. This may also be seen in the corresponding circulation plot shown in figure 21(b), where the circulation, even for the base ring, reduces with time. For the ring interacting with a bubble, the enstrophy variation is qualitatively similar to the thin core ring case shown earlier. There is first a sharp drop in the enstrophy of the ring, when the bubble is captured by the ring. This occurs at
 $tU_{c}/R\approx 4$
with a reduction of the normalized enstrophy
 $(Z/Z_{i})$
to about 0.4, a nearly 50 % reduction compared to the enstrophy of the base ring at the same time. This is then followed by an increase in enstrophy that is linked to the decrease in diameter of the bubble, which is in turn caused by the azimuthal expansion of the bubble within the ring.
 $Z/Z_{i}$
then decreases at a rate that is more rapid than the base case, reaching values of less than 0.1, which is again a more than 50 % reduction compared to the base ring case at the same time. From figure 21(b), one can see that the total circulation of the core, however, remains nearly the same as that of the base ring case. There are some variations, but these are within the experimental uncertainties, as may be seen by the variations in circulation between time instants and the variations between repetition of the same experiment shown by the error bars in the plot. Hence, even though there is very severe distortion and even fragmentation of the core leading to a more than 50 % reduction in enstrophy compared to the base case at the same time, the circulation remains nearly the same as for the base case.
The variation of (a) enstrophy
 $(Z)$
and (b) circulation
 $({\it\Gamma})$
with time for a vortex ring interacting with a bubble and for the base case in the absence of the bubble. The enstrophy and circulation are non-dimensionalized by their respective values at
 $t=0$
, and time is non-dimensionalized by the ring time scale
 $(R/U_{c})$
. ▪,
 $\mathit{We}=3$
(with bubble); ▫,
 $\mathit{We}=3$
(without bubble).

In summary, we find that thicker core rings (
 ${\it\epsilon}=0.75$
) interacting with a bubble show more significant effects than in the thinner core case. In particular at low
 $\mathit{We}$
, we find that this thick core ring while interacting with a bubble fragments into two, leading to a large drop in enstrophy with a consequent large reduction in convection speed.
6. Discussion
We shall discuss in this section some of the possible physical mechanisms that may be responsible for our observed decrease in convection speed of the ring and fragmentation of the core. We shall also discuss the relation between the present idealized configuration of a single bubble and a vortex ring and previous studies of bubble interaction in turbulent flows, and highlight some of the similarities.
The interaction of the vortex ring with a bubble has been shown to result in significant distortion of the vortex core and even in fragmentation of the core. This in turn is responsible for the observed drop in convection speed and enstrophy of the ring. These observations naturally raise the question of what could be possible mechanisms or instabilities that may be responsible for the fragmentation of the core. Firstly, as noted at the end of § 3, there is no observed change in convection speed of the ring at bubble capture. This suggests that the modified vorticity distribution, with decreased enstrophy, at bubble capture is not directly responsible for the reduction in convection speed, which develops later. The reduction in convection speed and fragmentation of the core may thus be attributed to an instability of the modified vortex core formed at bubble capture.
There are a few features of this modified vortex core that may be responsible for its instability and ultimate fragmentation. These include the annular form of vorticity distribution within the water phase, and the presence of sharp density and viscosity changes at the interface. In the case of a single annular two-dimensional distribution of constant vorticity in an incompressible (single) phase, Dritschel (Reference Dritschel1986) and others have shown that the vortex can be unstable to two-dimensional perturbations, which can lead to fragmentation of the vortex core. Their results show that the instability is dependent on the ratio of the inner and outer radii of the annular vortex patch, with thinner annular regions typically being more unstable. It may also be noted that in our low-
 $\mathit{We}$
case, where fragmentation of the core is seen, the radial equilibrium position of the bubble at capture, and thereafter, is displaced from the centre of the vortex core. This results in the symmetry (circular) of the vortex core being broken, which could lead to a more unstable core. The sharp change in viscosity and density at the interface could also induce instabilities. This is discussed for example in Dixit & Govindarajan (Reference Dixit and Govindarajan2011) and Govindarajan & Sahu (Reference Govindarajan and Sahu2014), the latter showing that a vortex with a light core having a ‘stable density’ stratification can still be unstable. Apart from these single core instabilities, the influence of the neighbouring oppositely signed core can also be important, as it overlays a strain field on the main vortex, as discussed for example by Leweke & Williamson (Reference Leweke and Williamson1998) in the case of the ‘cooperative’ instability of vortex pairs. The stability analysis of O’Farrell & Dabiri (Reference O’Farrell and Dabiri2012) further suggests that thicker core vortex rings are inherently more prone to instability than thinner core rings, as also observed in our study. In summary, given all the features of the present modified vortex core at bubble capture, it is difficult to pinpoint the instability mechanism responsible its fragmentation. It is clear that a detailed stability analysis of the modified annular vortex core at bubble capture (figure 3
c or figure 10
c) is needed and the result could be a combination of the above influences.
It is also useful to look at the interaction of the vortex ring and the bubble from the energy perspective. In particular, we can estimate the vortex ring kinetic energy, the buoyant energy fed by the bubble to the vortex ring during the interaction, and surface energy extracted by the bubble from the vortex ring due to stretching of the bubble. For example, for the thicker core ring with
 $\mathit{We}=3$
, where large reduction in convection speed and enstrophy are seen, the ring kinetic energy is an order of magnitude higher than both the buoyant energy and the surface energy. Further, it may be noted that the buoyant energy should ideally add to the ring energy as the bubble and ring rise, while an increase in surface energy should result in a reduction in ring energy. However, considering that both of these are an order of magnitude smaller than the ring energy, it is difficult to explain the reduction in convection speed of the ring from this perspective. This again thus points to the fact that there is probably an instability of the modified vortex core (after bubble capture) that is responsible for both the fragmentation of the core and reduction in convection speed.
The present study of a single bubble interacting with a single vortical structure in the form of a ring may be viewed as an idealization of the interaction of microbubbles with turbulent structures (hairpins) in a boundary layer, as discussed in the introduction. This raises the question of whether non-dimensional numbers such as
 $V_{R}$
and
 $\mathit{We}$
(based on vortex strength) used in the present study are relevant in drag reduction studies using microbubbles. The ratio of bubble to vortex core volume
 $(V_{R})$
used in boundary layer drag reduction studies for example of Ferrante & Elghobashi (Reference Ferrante and Elghobashi2004) can be determined based on the eddy area fraction measurements in a turbulent boundary layer of Carlier & Stanislas (Reference Carlier and Stanislas2005). The above mentioned bubble injection studies show large drag reduction of about 20 % with overall bubble void fraction of about 0.02. Simple calculations based on Carlier & Stanislas (Reference Carlier and Stanislas2005) show that the corresponding bubble to eddy volume
 $(V_{R})$
is about 0.12 and thus
 $V_{R}$
values of the order of 0.1, as used in the present study, appear reasonable.
We can similarly see if the strength of the eddy structures or hairpins in turbulent boundary layers are amenable for eddy–bubble interactions based on the present work. From strength and length-scale measurements in boundary layers (Dennis & Nickels Reference Dennis and Nickels2011; Herpin et al.
Reference Herpin, Stanislas, Foucaut and Coudert2013), and a
 $V_{R}$
of 0.1, we can estimate the
 $\mathit{We}$
values corresponding to a bubble interacting with a hairpin (eddy) structure in a boundary layer. Our estimations based on the above studies suggest that
 $\mathit{We}$
would be about 10. At such
 $\mathit{We}$
, we clearly see large reductions in enstrophy of structures in the present work, suggesting that the structures in turbulent boundary layers could also be suppressed with reduction in their enstrophy while interacting with bubbles. In spite of these similarities, one should however note that there are important differences between the present idealized case of a single vortical structure interacting with a bubble and of a bubble in a turbulent flow. In the latter case, the multi-scale nature of turbulence would imply that a bubble would in fact interact with eddies of different scales making the problem considerably more complex, and at the very least requiring studies with a range of volume ratios (
 $V_{R}$
) to account for the many eddy sizes.
We can also make further connections between some results from the present study and observations of bubbles in turbulent boundary layer studies. In terms of hairpin vortices in a boundary layer, Zhou et al. (Reference Zhou, Adrian, Balachandar and Kendall1999) showed that primary hairpin vortices of peak vorticity above a certain threshold result in the generation of secondary hairpin vortices. As seen in figure 17, the presence of a bubble in a vortex reduces peak vorticity, which could be less than the threshold needed for regeneration of a hairpin, thus resulting in a reduction of the hairpin population. This reduction in the number of such structures could in turn result in a reduction of enstrophy and wall shear stress. Another observation for bubbles in turbulent flow, from both numerical (Mazzitelli, Lohse & Toschi Reference Mazzitelli, Lohse and Toschi2003) and experimental studies (van den Berg, Luther & Lohse Reference van den Berg, Luther and Lohse2006), is the enhancement of energy at small scales and reduction in energy at large scales. In the present context, the increase in energy at small scales can be related to the observed increase in shedding behind the vortex ring interacting with a bubble, as shown in figure 15(b). On the other hand, the reduction in energy at the large scales can be related to our observed fragmentation of the vortex core into smaller ones, as shown in figures 15(b) and 20(f). These connections between the present idealized interaction of a vortex ring with a bubble and turbulent bubbly flows suggest that the present work could be useful in understanding a variety of bubbly turbulent flows that are used in many engineering applications.
7. Conclusion
We have studied in the present work the interaction of a single bubble with a single vortical structure, namely, a vortex ring. This may be thought of as an idealized case of the interaction of bubbles with a turbulent flow. In particular, we measure both the bubble dynamics using high-speed imaging, and the vortex dynamics using time-resolved PIV and show that each can be significantly affected by the other. The experiments are done in water with a vortex ring generated from a piston–cylinder mechanism that interacts with an air bubble.
Two important parameters in this problem are the ratio of the bubble volume to vortex core volume
 $(V_{R})$
, and the circulation strength of the vortex
 $({\it\Gamma})$
. The latter can be represented in terms of a Weber number
 $(\mathit{We}=0.87{\it\rho}({\it\Gamma}/2{\rm\pi}a)^{2}/({\it\sigma}/D_{b}))$
, along the lines used in Oweis et al. (Reference Oweis, Van der Hout, Iyer, Tryggvason and Ceccio2005), which may be thought of as the ratio of the pressure difference between the core and the far field
 $({\rm\Delta}P=0.87{\it\rho}({\it\Gamma}/2{\rm\pi}a)^{2})$
to the Laplace pressure
 $({\it\sigma}/D_{b})$
for a spherical bubble (
 $a=\text{vortex core radius}$
,
 $D_{b}=\text{bubble diameter}$
,
 ${\it\sigma}=\text{surface tension}$
). Another parameter related to the vortex ring is the non-dimensional core radius
 $({\it\epsilon})$
of the ring. In our studies,
 $V_{R}$
is kept fixed at about 0.1, this being representative of the value seen in bubbly turbulent boundary layers used in drag reduction studies. The Weber number, on the other hand, is varied over a large range from 3 to 406 by changing
 ${\it\Gamma}$
. The main study is done for vortex rings with
 ${\it\epsilon}$
of about 0.25, while a few cases have also been done for thicker core rings with
 ${\it\epsilon}$
of about 0.75.
The interaction between the bubble and ring for all
 $\mathit{We}$
cases broadly falls into four stages, which are demarcated on an overview plot (figure 5) showing the location of the vortex ring as it interacts with the bubble. In stage I, the bubble is outside the vortex ring, and is pulled in towards the ring with capture of the bubble into the core occurring at the line demarcating stages I and II. Within stage II, the bubble elongates in the azimuthal direction along the core, and then gradually breaks up into a set of smaller bubbles. In stage III, the break-up is complete and the set of smaller bubbles slowly moves around in the azimuthal direction, and finally in stage IV, the bubbles escape from the ring leaving a distorted or fragmented core.
In stage I, where the bubble is drawn into the ring in a spiralling manner, we measure the capture time
 $(t_{c})$
, and find that it decreases significantly as
 $\mathit{We}$
increases. After capture, the bubble reaches an equilibrium radial location within the vortex core, which is found to be displaced from the centre of the vortex at low
 $\mathit{We}$
. At higher
 $\mathit{We}$
, the radial equilibrium location is found to be at the centre of the vortex core, with the vorticity in the water phase being distributed in an annular form around the bubble. The pressure distributions calculated from the velocity field show a large azimuthal pressure difference between the core where the bubble is captured and the other core, which is of the order of
 ${\rm\Delta}P=0.87{\it\rho}({\it\Gamma}/2{\rm\pi}a)^{2}$
. This pressure difference causes stretching of the bubble in the azimuthal direction. When time is non-dimensionalized by a time scale
 $t_{p}=(0.87{\it\rho}{\it\Gamma})/({\rm\Delta}P{\rm\pi})={\rm\pi}(2a)^{2}/{\it\Gamma}$
, based on this pressure difference, it is found to collapse the measured elongation rates of the bubble in the azimuthal direction.
By the end of stage II, break-up of the bubble is practically complete. The number of resulting smaller bubbles is found to increase with
 $\mathit{We}$
, starting from 3 at low
 $\mathit{We}$
, and reaching about 16 at the higher
 $\mathit{We}$
of 406. This number of bubbles is not found to be correlated to the measured number of Kelvin waves on the ring. Apart from the Kelvin waves, another possible mechanism that could determine the number of bubbles would be the classical Rayleigh–Plateau instability of the stretched cylindrical bubble. The number of these waves that fit into the stretched bubble and their variation with
 $\mathit{We}$
is in reasonable agreement with experimental data at low
 $\mathit{We}$
(
 $\mathit{We}<150$
). At
 $\mathit{We}>150$
, the visualized number of bubbles after break-up continues to increase, while the number of instability waves is fixed. The discrepancy between the two continues to increase with
 $\mathit{We}$
and is probably caused by the increased level of turbulence in the higher strength (and
 $\mathit{Re}$
) rings at larger
 $\mathit{We}$
.
Associated with this increase in the number of smaller bubbles is a reduction in the average diameter of the bubbles formed
 $(D_{m})$
, which is found to vary as
 $\mathit{We}^{-0.124}$
. This value of the exponent (
 $-0.124$
) may be compared to the well-studied case of droplet/bubble break-up due to isotropic turbulence, where Shinnar (Reference Shinnar1961) showed that the average bubble size formed after complete break-up by isotropic turbulence varies as
 $\mathit{We}^{-0.6}$
. It should be noted here that the change in exponent is not unexpected, as in the isotropic turbulence case, the whole process of break-up is considerably more complex due to the multi-scale nature of turbulent structures. The differences between the two can be attributed to the fact that bubble break-up in the turbulent case can occur through the combined action of a succession of different eddies (Risso & Fabre Reference Risso and Fabre1998), in addition to the fact that the bubble fragments are always exposed to eddies with smaller scales that they can interact with. The vorticity distribution in this stage shows that there are very significant variations between the interacting ring vorticity distribution and the base vortex ring in the absence of the bubble, at similar times. In particular at low
 $\mathit{We}$
(
 $\mathit{We}\sim 3$
), the vortex core appears fragmented with significant shedding of vorticity from the core with the bubble, while we see a clean vortex ring in the base case at similar times. Correspondingly, the convection speed of the ring drops significantly for the interacting case, and the enstrophy shows a large reduction of about 50 %. In the higher-
 $\mathit{We}$
cases, the drop in convection speed of the ring is very small, and the core is not affected significantly, with almost no change in enstrophy of the ring compared to the base case at similar times.
In the case of thicker core rings with non-dimensional core size (
 ${\it\epsilon}$
) of 0.75, we find more dramatic effects. In this case, at low
 $\mathit{We}$
(
 $\mathit{We}\sim 3$
), the vortex ring interacts with the bubble and almost comes to a stop some time after bubble capture. The vorticity distribution at this instant shows complete fragmentation of the core into two pieces, and a resultant drop in enstrophy of the ring by about 50 %. As in the thinner core ring, at high
 $\mathit{We}$
, the effects on the convection speed are not as significant as at low
 $\mathit{We}$
. It should be mentioned here that in the earlier study of Sridhar & Katz (Reference Sridhar and Katz1999) for a ring interacting with a set of smaller bubbles, distortion of the core was noted, but the core returned to its initial state after bubble escape. In the present case, where the bubble size is larger, the core deformation and fragmentation are lasting effects, and the ring is left in a fragmented state after bubble escape.
The drop in convection speed and fragmentation of the core seen in the present experiments at low
 $\mathit{We}$
do not occur at bubble capture, but at times significantly after bubble capture. This suggests that the drop in convection speed and fragmentation of the core may be due to an instability of the modified vorticity distribution after bubble capture, where vorticity is in an annular form around the bubble with sharp density and viscosity changes at the interface. This of course needs further investigation, but it appears that stability analysis of an annular vorticity configuration with an air–water interface would be helpful to understand the fragmentation of the vortex core. Numerical two-phase simulations of this interaction would also be a very useful way to better understand this interaction.
A number of connections can be made between the present experiments and the relatively well-studied case of drag reduction through bubble injection into a turbulent flow. The numerical simulations of Lu et al. (Reference Lu, Fernández and Tryggvason2005) have shown that drag reduction in turbulent channel flow takes place only when
 $\mathit{We}$
is sufficiently high to cause bubble deformation, which they also link to reduction in enstrophy and suppression of vortical structure. This point has also been emphasized by Gils et al. (Reference Gils, Guzman, Sun and Lohse2013) for the case of bubbles in turbulent Taylor–Couette flow, who also state that significant drag reduction takes place only when
 $\mathit{We}$
is sufficient to cause deformation of bubbles. In the present idealized study of a vortex ring interacting with a bubble over the
 $\mathit{We}$
range from 3 to 406, we find that bubble deformation occurs in all cases. However, we find that significant reduction in enstrophy and fragmentation of the structure occurs only when
 $\mathit{We}\sim 3$
. Hence, the present experiments suggest that for enstrophy reduction and drag reduction, bubble deformation alone is not sufficient. We find that fragmentation/suppression of the structure is also important, and this is found to occur only at low
 $\mathit{We}$
. Another observation for bubbles in turbulent flow is the enhancement of energy at small scales and reduction in energy at large scales (Mazzitelli et al.
Reference Mazzitelli, Lohse and Toschi2003; van den Berg et al.
Reference van den Berg, Luther and Lohse2006). In the present context, the increase in energy at small scales can be related to the observed increase in shedding behind the vortex ring interacting with a bubble. On the other hand, the reduction in energy at the large scales can be related to our observed fragmentation of the vortex core. These relations between bubbly turbulent flows and the present idealized study suggest that the present experiments could help to better understand interactions of bubbles with turbulent flows, which occur in many practical applications.