Clays are often used for the purification and clarification of vegetable oils (Srasra et al., Reference Srasra, Bergaya, Van Damme and Ariguib1989; Taylor et al., Reference Taylor, Jenkins and Ungermann1989; Christidis et al., Reference Christidis, Scott and Dunham1997; Gannouni et al., Reference Gannouni, Bellagi and Bagane1999; Noyan et al., Reference Noyan, Onal and Sarikaya2007; Önal & Sarıkaya, Reference Önal and Sarıkaya2012; Mosbahi et al., Reference Mosbahi, Tlili, Khlifi and Jamoussi2017; Issaoui et al., Reference Issaoui, Mosbahi, Barbieri, Flamini, Bendini and Ascrizzi2021; Serouri et al., Reference Serouri, Taleb, Mannu, Kedir, Memou and Garroni2025). Bentonite activation is commonly performed with sulfuric acid (Gannouni et al., Reference Gannouni, Bellagi and Bagane1999; Noyan et al., Reference Noyan, Onal and Sarikaya2007; Benguella & Yacouta-Nour, Reference Benguella and Yacouta-Nour2009; Yener et al., Reference Yener, Biçer, Pekdemir and Sarıkaya2020; Bayram et al., Reference Bayram, Ustunisik, Önal and Sarıkaya2021) or hydrochloric acid after heating for a few hours (Christidis et al., Reference Christidis, Scott and Dunham1997; Teng & Lin, Reference Teng and Lin2006; Mosbahi, Reference Mosbahi2007; Didi et al., Reference Didi, Makhoukhi, Azzouz and Villemin2009). Previous studies have shown that HCl is the best activating agent for this purpose (Mathers et al., Reference Mathers, Weed and Coleman1954; Pesquera et al., Reference Pesquera, Gonzalez, Benito, Blanco, Mendioroz and Pajares1992; Christidis et al., Reference Christidis, Scott and Dunham1997). It is therefore best to use HCl for these acid activations (Srasra & Trabelsi, Reference Srasra and Ayadi-Trabelsi2000; Didi et al., Reference Didi, Makhoukhi, Azzouz and Villemin2009). During activation, the structural cations Al3+, Mg2+ and Fe3+ and exchangeable cation Ca2+ are extracted and replaced by H+ protons (Yildiz & Çalimli, Reference Yildiz and Çalimli1999, Reference Yildiz and Çalimli2002; Mosbahi, Reference Mosbahi2007; Mosbahi et al., Reference Mosbahi, Tlili, Khlifi and Jeddoui2008, Reference Mosbahi, Tlili, Khlifi and Jamoussi2010; Didi et al., Reference Didi, Makhoukhi, Azzouz and Villemin2009; Usman et al., Reference Usman, Ekwueme, Alaje and Mohammed2012).
This study focuses on the valorization of Palaeocene–Eocene smectitic clays from the Meknassy–Mezzouna basin, central Tunisia, and aims to determine the optimal conditions for acid activation using HCl in order to improve their textural properties, particularly their specific surface area and porosity. In addition, this study investigates the application of the resulting porous material in soybean oil clarification by identifying suitable operating conditions. Raw clays were selected according to their relatively high specific surface area, smectite content and presence of fibrous clays (palygorskite and sepiolite; Mosbahi et al., Reference Mosbahi, Tlili, Khlifi and Jamoussi2017, Reference Mosbahi, Khlifi, Jamoussi, Tlili, Çiner, Grab, Jaillard, Doronzo, Michard, Rabineau and Chaminé2022). The mineralogical and chemical composition, the specific surface area and the bleaching capacity of the natural and activated clays of the Meknassy–Mezzouna basin are compared with those of a commercial bleaching earth (Tonsil) used the companies SATHOP and SOZITEX.
Geological setting and lithological description
The region under study is located in central-western Tunisia (Fig. 1). The Oued Errizgui section is from Jebel Jebbes El Meheri. This region is 6.5 km long and 4.0 km wide and has a north–south orientation. It consists of a perched elliptical synclinal structure, whose axial direction is submeridian (Figs 1 & 2). The centre of the synclinal structure contains Eocene sediments, and Triassic outcrops trace both sides of the syncline. Upper Cretaceous sediments are the oldest units in contact with the Triassic outcrops. The upper section shows outcrops ranging from Triassic to Eocene in age (Fig. 3; Khessibi, Reference Khessibi1978; Jaouadi, Reference Jaouadi2004; Mosbahi et al., Reference Mosbahi, Khlifi, Tlili and Jamoussi2014; Hajlaoui et al., Reference Hajlaoui, Khlifi, Sarsar Naouali, Mahroug, Khalfi, Mosbahi and Gasmi2024).
(a) Geological map of the study area and (b) location of the Meknassy–Mezzouna basin (central Tunisia).

Figure 1 Long description
The composite image includes two parts. The top section shows a map of North Africa highlighting Tunisia and the Meknassy–Mezzouna basin. The bottom section is a detailed geological map of the Meknassy–Mezzouna basin in central Tunisia. The map includes a legend indicating various geological formations, such as Triassic, Jurassic and Eocene sediments, each represented by different patterns. Faults and inferred faults are marked with lines. The lithological sections are labeled with letters corresponding to the legend, showing the distribution of geological units. A scale bar indicates distances in kilometers.
The transition from the Cretaceous to the Palaeocene is continuous within the El Haria formation (Burollet, Reference Burollet1956; Mosbahi, Reference Mosbahi2017), which is represented by black, green and grey clays with some intercalations of small clayey limestone beds. The El Haria formation is 70–300 m thick at the Jebel Jebbes El Meheri level (Figs 2 & 3).
Geological overview of Jebel Meheri El Jebbes.

Lithological description along the Upper Maastrichtian–Lower Eocene of the Oued Errizgui in the west of Jebel Meheri El Jebbes.

Figure 3 Long description
A lithological column representing the Lower Eocene Ypresian age, detailing formations and lithological descriptions. The column is divided into sections labeled ′Age′, ′Formation′, ′Sample′, ′Lithology′ and ′Lithological description′. The formations listed are Faid and Chouabine, with a studied clay sample from the El Haria formation. The lithology section includes symbols for gypsum, clay, phosphate and dolomite. The lithological descriptions are as follows: gypsum decimetre intercalation of marl and dolomite; alternation of clay and dolomite; brown or black and hard phosphatic layer; foliated clay; soft phosphatic layer, rich in coprolites and shell fragments; alternation of decimetric to centimetric level of phosphates and clays; and clay. A scale bar indicates a height of 5 meters. The diagram provides a visual representation of the geological layers and their characteristics.
Experimental
Materials
The clay was collected from the Palaeocene–Eocene passage (Ypresian) of the Oued Errizgui section (Jebel Jebbes El Meheri, central-western Tunisia). The raw samples were suspended in water for a few days, sieved through a 40 µm sieve to remove impurities and dried at 60°C for several days.
A commercial bleaching earth, Tonsil EX 0002 (SATHOP), was used as a comparative reference material. Tonsil EX 0002 is an activated clay that is commonly employed as an adsorbent for organic pigments. It was included in this study to provide a benchmark for comparison with the natural clay samples. It was added at 0.50–0.75% relative to the sample mass under the same experimental conditions.
Methods
Clay activated by HCl
A total of 15 g of clay was mixed with 150 mL of distilled water. To this mixture, concentrated hydrochloric acid was added until a 3 N solution was obtained (Mosbahi et al., Reference Mosbahi, Tlili, Khlifi and Jamoussi2010). For each sample, the time and temperature of activation varied, but the normality and volume of the added acid were kept constant. Separation of the clay after activation for 2, 4 and 6 h was performed by filtration. The solid phase was washed several times until pH 5 was reached to reduce acidity and eliminate traces of chlorine. The collected clay was then finely ground dried at 60°C and stored for further testing (Srasra, Reference Srasra1987; Srasra et al., Reference Srasra, Bergaya, Van Damme and Ariguib1989).
X-ray diffraction
The clay fraction smaller than 2 µm was separated by differential centrifugation. The suspension was first dispersed, deflocculated and treated with H2O2 to remove organic matter where necessary, and then with HCl to remove carbonate. It was then subjected to sequential centrifugation steps based on Stokes’ law, allowing the sedimentation of particles larger than 2 µm. The supernatant containing particles smaller than 2 μm was collected and concentrated either by evaporation or by final centrifugation (Brindley & Brown, Reference Brindley and Brown1980; Tlili et al., Reference Tlili, Felhi and Montacer2010; Mosbahi et al., Reference Mosbahi, Khlifi, Tlili and Jamoussi2014; Sdiri et al., Reference Sdiri, Khairy, Bouaziz and El-Safty2016). The fine fraction was subjected to a series of analyses. X-ray diffraction (XRD) analyses were carried out on orientated and random samples. In the orientated samples, phase identification was based on the XRD traces of clay fractions after deposition on glass slides in three different preparations (air-dried, glycolated and heated to 550°C; Moore & Reynolds Jr, Reference Moore and Reynolds1997). The random samples involved the preparation of random powders. The estimation of the percentage of each mineral is affected by the integration of the area of the most intense peak. All XRD data were collected with an X’pert HighScore Plus PANalytical diffractometer using Cu-Kα radiation, 40 kV/40 mA, in the range of 3–70°2θ for bulk samples and in the range of 3–30°2θ for the clay fraction, with a step size of 0.017°2θ and a counting time of 10 s step–1.
Chemical analysis
All analyses were carried out through X-ray fluorescence (XRF) spectrometry on fused glass beads using lithium tetraborate as a fluxing agent. The analyses were performed at the Control and Quality Laboratory of Gabès Cement Company. The precision and accuracy of the measurements were controlled with certified reference materials. Instrument calibration was performed using international standards supplied by Thermo Fisher Scientific, and the analytical reproducibility was checked by repeated measurements of selected samples. The precision was 2 wt.% for major oxides, confirming the reliability of the analyses. The loss on ignition was determined independently by calcination at 1000°C.
Scanning electron microscopy analyses
The morphology of representative samples selected according to their mineralogical compositions was observed using a SC-2500 HITACHI scanning electron microscope (SEM) equipped with an energy-dispersive X-ray spectroscopy (EDX) system for the characterization of the elemental composition. Analyses were performed at 10–30 kV and up to 30 000× magnifications. The specimens were mounted on aluminium stubs and coated with a thin layer of gold.
pH determination
The pH of the original and HCl-activated clay suspensions was measured with a pH meter (NeoMet 200 L) in the Microbiology Laboratory, Faculty of Science, University of Sfax (Tunisia). The pH of the samples was measured at room temperature (∼25°C). According to several authors, pH is important for zeolite synthesis (De Kimpe, Reference De Kimpe1976; Grauby, Reference Grauby, Petit, Decarreau and Baronnet1993; Mosbahi et al., Reference Mosbahi, Tlili, Khlifi and Jamoussi2017) and clay mineral genesis (Kloprogge et al., Reference Kloprogge, Jansen and Geus1990; Sheela Evangeline et al., Reference Sheela Evangeline, Vinod and Manju2009; Mosbahi et al., Reference Mosbahi, Tlili, Khlifi and Jamoussi2017).
Bleaching of soybean oils
Clarification of the soybean oil is based principally on the adsorption properties of smectite. Clarification included addition of 0.50, 0.75 and 1.00 g of raw or activated clay to 100 mL of neutral oil under stirring (600 rpm) for 30 min at a temperature between 110°C and 130°C. After clarification, the activated clay was separated from the oil by filtration.
The optical density of the treated oil was measured using a CE CECIL 1011 visible spectrophotometer at a wavelength of 430 nm. In the industrial processes at the companies SATHOP and SOZITEX, the original oil is neutralized with sodium hydroxide (NaOH) followed by washing with water. The neutral oil is then clarified by Tonsil clay (0.50–0.75%) and refined. In a final step, the temperature is increased to 200°C under vacuum to remove the remaining coloured pigments.
Absorbance measurements were performed for both neutral and treated oils with the activated clay and Tonsil, which was imported from Germany. The decolourizing capacity was determined from the maximum absorbance at 430 nm according to Equation 1:
 \begin{equation}\text{Bleaching capacity\,=\,} \frac{{\textit{A}}_\text{430}\left(\text{neutral oil}\right)\text{-}{\textit{A}}_\text{430}\left(\text{treated oil}\right)}{{\textit{A}}_\text{430}\left(\text{neutral oil}\right)}\times 100\end{equation}
Results
Specific surface area of the samples before and after activation
The specific surface area of the clay increased after activation (Fig. 4). The activated clay exhibited a higher surface area than the original clay (100 and 50.47 m2 g⁻1, respectively; Fig. 4 & Table 1). This increase improved the adsorption of impurities on the surface of the activated clay particles.
BET surface area and porosity of the raw clay, Tonsil, the basic-activated clay (Mosbahi et al., Reference Mosbahi, Tlili, Khlifi and Jamoussi2017) and the acid-activated clay.

Surface area and porosity of the raw clay, Tonsil and the basic-activated clay (Mosbahi et al., Reference Mosbahi, Tlili, Khlifi and Jamoussi2017) and their activated equivalents for various HCl amounts at various times at 75°C.

Table 1 Long description
Surface area in square meters per gram and porosity in percent are reported for raw clay, Tonsil, a basic-activated clay, and acid-activated clays made under different hydrochloric acid strengths and reaction times at 75 degrees C. Raw clay and Tonsil are similar, with surface area about 50.47 to 51.00 and porosity about 28.65 to 28.95. Basic activation raises both measures to 58.63 surface area and 33.71 percent porosity. For 1 hour acid activation, surface area stays near 51 to 56 at 1 N to 3 N, then rises sharply to 76.00 at 4 N; porosity follows the same pattern, reaching 42.87 percent at 4 N. For 3 N acid at longer times, surface area increases from 53.00 at 2 hours to 100.00 at 4 hours, then is slightly lower at 98.00 at 6 hours; porosity similarly rises from 30.08 percent to 56.76 percent, then slightly drops to 55.63 percent. Overall, stronger acid and longer treatment generally increase surface area and porosity, with the highest values at 3 N for 4 hours, and small declines at the longest time suggesting possible over-treatment or variability.
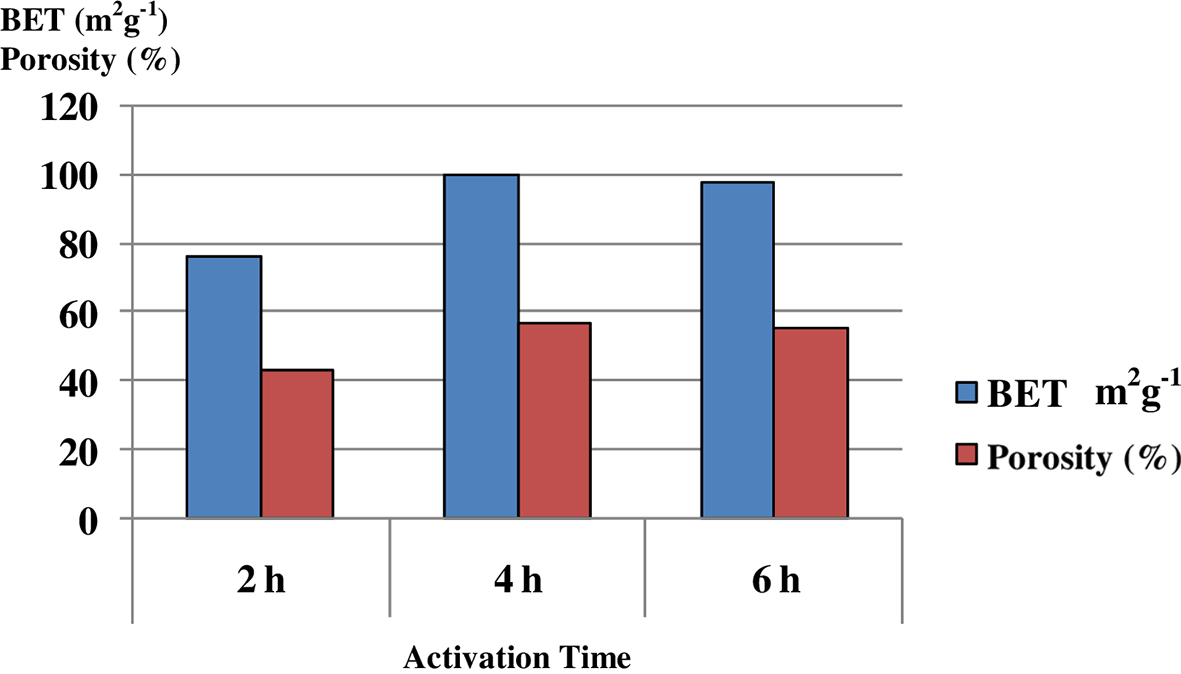
The best activation results were obtained with 3 N HCl for 4 h (Fig. 5 & Table 1). For different activation times (2, 4 and 6 h), the specific surface area of the activated clay samples increased with increasing temperature up to 75°C, before decreasing again at higher temperatures. This is attributed to partial disruption of the clay layers. The highest specific surface area (100 m2 g–1) was observed after 4 h of activation at 75°C.
BET surface area and porosity of acid-activated clay (3 N HCl, 75°C) at various activation times.

Chemical analysis and rate of clay disruption
The SiO2 content of the original clay was 48.68 wt.% compared to 60 wt.% of the activated clay and 89 wt.% of Tonsil (Table 2). The concentration of Al2O3 was 15.51 wt.% in the original clay, decreasing to 13.54, 11.20 and 10.30 wt.% after 2, 4 and 6 h of activation, respectively. The hosts of Al2O3 are clay minerals such as smectite, palygorskite and sepiolite, as was observed in SEM and confirmed by XRD. However, the Al2O3 content of Tonsil is much lower than those of the investigated clays. The MgO content of the original clay was 2.54 wt.% due to the presence of fibrous clays (sepiolite and palygorskite), smectite and dolomite, which decreased with the time of activation due to dissolution of dolomite and partial dissolution of clay minerals. Yet the MgO content was higher than that of Tonsil (0.18 wt.%). The Fe2O3 content of the original clay was 5.65 wt.%, decreasing to 3.56, 1.02 and 0.53 wt.% after 2, 4 and 6 h of activation, but remaining higher than that of Tonsil (0.3 wt.%). The CaO is related to Ca-smectite and/or dolomite, while K2O, SO3 and Na2O are subordinate, not exceeding 1 wt.% each.
Chemical analysis (wt.%) of Tonsil, the raw clay and the activated clay and the rates of clay destruction (%) as a function of time (2, 4, and 6 h).

Table 2 Long description
Chemical composition in weight percent is listed for Tonsil, raw clay, and clay activated with 3 N hydrochloric acid at 75 degrees Celsius for 2, 4, and 6 hours. Raw clay starts with 48.68 wt.% silica, 15.51 alumina, and 5.65 iron oxide, while Tonsil is silica-rich at 89.00 wt.% with low alumina at 3.50 and low iron oxide at 0.30. With longer activation time, silica increases from 50.10 at 2 h to 60.02 at 4 h and 61.03 at 6 h. Over the same period, alumina decreases from 13.54 to 11.20 to 10.30, and iron oxide drops from 3.56 to 1.02 to 0.53. Magnesium oxide also declines from 2.00 at 2 h to 1.36 at 6 h, while potassium oxide peaks at 1.03 at 2 h then falls to 0.43 at 6 h. Calcium oxide is 1.41 in raw clay, falls to 0.41 at 2 h, and is zero at 4 h and 6 h; phosphorus pentoxide is 1.20 in raw and 2 h samples, then zero at 4 h and 6 h. Loss on ignition is 23.50 in raw clay and 2 h activated clay, rising slightly to 24.77 by 6 h; totals are near 99 to 100 across samples. A separate row reports clay destruction rates of 19.41, 41.89, and 48.56 percent, indicating increasing destruction with longer activation time, though the table does not specify which samples those rates correspond to.
LOI = loss on ignition.
The chemical analysis of the samples before and after activation (Table 2) shows that the rate of clay dissolution during activation is fast. Partial removal of Al2O3, Fe2O3, MgO, K2O and CaO causes an increase in the concentration of SiO2. Using the chemical data in Table 2, the rate of clay dissolution (R) can be evaluated using Equation 2:
 \begin{equation}R = \frac{{{\sum} \left( {{\text{A}}{{\text{l}}_2}{{\text{O}}_3} + {\text{ F}}{{\text{e}}_2}{{\text{O}}_3} + {\text{ MgO}}} \right)a}}{{{\sum} \left( {{\text{A}}{{\text{l}}_2}{{\text{O}}_3} + {\text{F}}{{\text{e}}_2}{{\text{O}}_3} + {\text{ MgO}}} \right)i}} \times 100\end{equation}
where i represents the oxides before activation and a represents the oxides after activation.
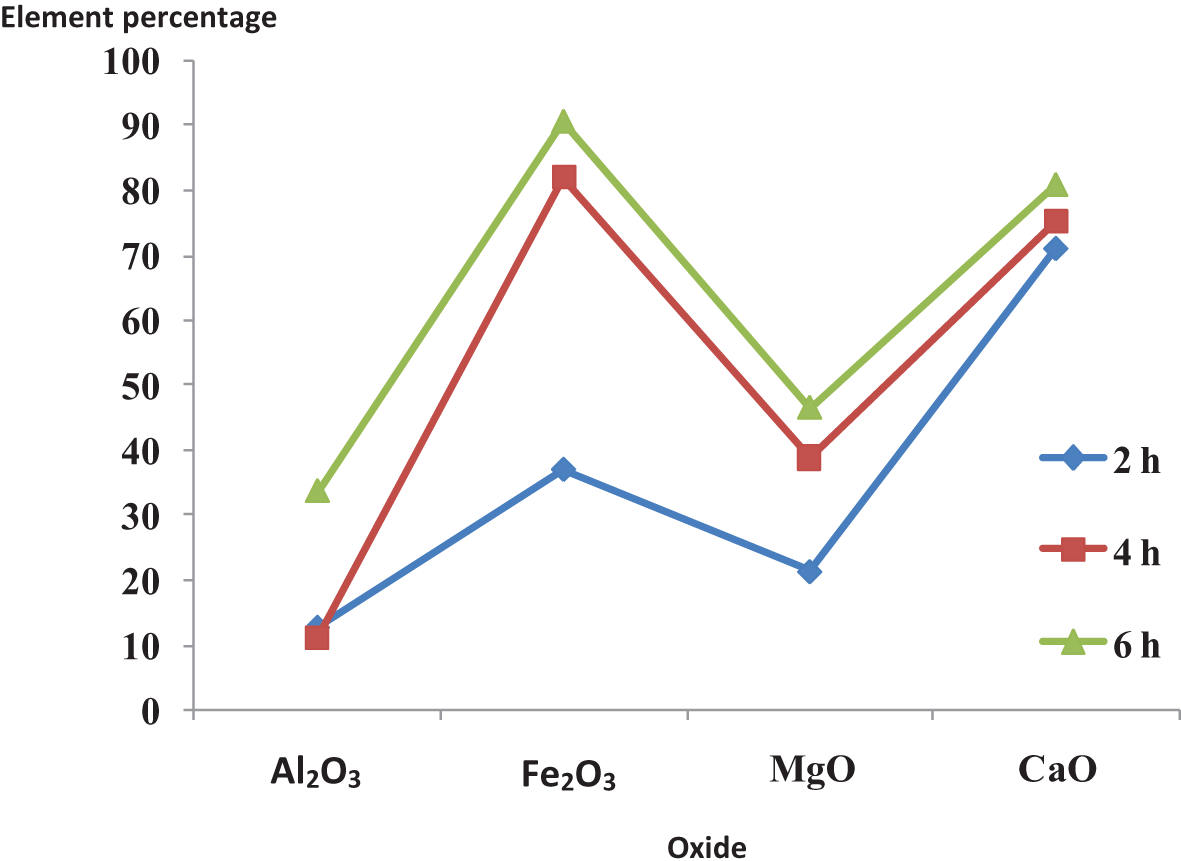
The rate of dissolution of the studied clay was 19.41% after 2 h, increasing to 41.89% after 4 h and 48.56% after 6 h (Fig. 6 & Table 2). This high dissolution rate after 4 and 6 h of activation is due to a partial destruction of smectite and the total dissolution of dolomite.
Percentages of oxides (Al2O3, MgO, Fe2O3 and CaO) leached over time of acid activation at 75°C for the studied clay.

XRD of clays
The XRD traces of the bulk-rock sample (Jebel Jebbes El Meheri), collected from the Oued Errizgui section, are shown in Fig. 7a. The clay was composed mainly of dolomite, quartz and clay minerals (smectite, palygorskite and sepiolite). Clay minerals constituted ∼54 wt.% of the sample, with smectite being predominant (∼90 wt.% of the clay minerals). Dolomite was the prevailing non-clay mineral. The <2 mm clay fraction of the samples confirmed the presence of smectite, sepiolite and palygorskite (Fig. 8a). Their respective 001 reflections were 1.521, 1.200 and 1.044 nm (Fig. 8a). The 001 peak of smectite shifted to 1.79 nm after ethylene glycol solvation and collapses to 0.99 nm after heating at 550°C (Fig. 8a). After sieving to a particle-size fraction <40 µm, the relative abundance of phyllosilicates increased due to the partial removal of coarse mineral impurities (Fig. 7b). This enrichment reflects a more homogeneous clay fraction suitable for subsequent activation.
XRD traces (Cu-Kα radiation) of (a) the natural clay, (b) the raw clay (<40 µm) and (c) the clay (<40 µm) activated with HCl (3 N) at 75°C. Acm = all clay minerals; Do = dolomite; Pa = palygorskite; Pm = porous material; Qr = quartz; Sep = sepiolite; Sm = smectite.

Figure 7 Long description
Activated clay The y-axis is labeled Counts, ranging from 0 to 1400 in increments of 200. The x-axis is labeled 2 theta, ranging from 0 to 70 in increments of 10. A line trace shows a tall peak near 6 on the 2 theta axis, reaching about 1200 counts. The trace then drops to near 0 by about 12. Smaller peaks are labeled along the trace at approximately 12, 19, 22, 26, 35, 50 and 62 on the 2 theta axis. Raw clay (less than 40 micro meter) The y-axis is labeled Counts, ranging from 0 to 600 in increments of 100. The x-axis is labeled 2 theta, ranging from 0 to 60 in increments of 10. A line trace shows multiple peaks. Labeled peaks appear near 6, 9, 19, 26, 29, 36, 40 and 45 on the 2 theta axis. The tallest peak is near 29, reaching about 500 counts. Natural clay The y-axis is labeled Counts, ranging from 0 to 600 in increments of 100. The x-axis is labeled 2 theta, ranging from 0 to 70 in increments of 10. A line trace shows many narrow peaks across the full range. A prominent peak is near 31 on the 2 theta axis, reaching about 500 counts. Additional labeled peaks appear near 6, 9, 19, 23, 36, 41, 45, 50, 56, 60 and 66 on the 2 theta axis.
XRD traces (Cu-Kα radiation) of three orientated clay fractions of (a) the Ypresian series collected from Meknassy basin and (b) of Tonsil. Ka = kaolinite; Pa = palygorskite; Sep = sepiolite; Sm = smectite.

Figure 8 Long description
Two XRD trace graphs labeled (a) and (b) show clay fractions under different treatments. Graph (a) displays three traces labeled 1, 2 and 3. Trace 1 is for untreated samples with peaks at smectite (1.521 nm), palygorskite (1.200 nm), sepiolite (1.044 nm) and kaolinite (0.712 nm). Trace 2 shows glycolated samples with peaks at smectite (1.79 nm), palygorskite (1.200 nm), sepiolite (1.044 nm) and kaolinite (0.712 nm). Trace 3 represents samples heated at 550 degrees Celsius, showing peaks at smectite (0.99 nm), palygorskite (1.200 nm), sepiolite (1.044 nm) and kaolinite (0.712 nm). Graph (b) similarly displays three traces labeled 1, 2 and 3. Trace 1 is for untreated samples with peaks at smectite (1.521 nm) and sepiolite (1.044 nm). Trace 2 shows glycolated samples with peaks at smectite (1.79 nm) and sepiolite (1.044 nm). Trace 3 represents samples heated at 550 degrees Celsius, showing peaks at smectite (0.99 nm) and sepiolite (1.044 nm). Both graphs have x-axis labeled 2 theta, ranging from 0 to 25 degrees and y-axis showing intensity without specific units.
Acid activation using 3 N HCl at 75°C for 4 h led to extensive dissolution of carbonates and partial structural alteration of the clay minerals, resulting in the transformation of most of the sample into a porous material (Fig. 7c). The XRD traces of the activated clay show the disappearance or significant broadening of characteristic basal reflections, together with the emergence of poorly ordered phases. This mineralogical evolution is consistent with the increase in specific surface area and pore volume observed from Brunauer–Emmett–Teller (BET) measurements, as well as with the morphological changes observable within the SEM images. The formation of these porous phases can be attributed to the initial mineralogical heterogeneity of the sample, which includes layered clays, fibrous clay minerals and dolomite. This heterogeneity promoted differential dissolution, atomic rearrangement and subsequent recrystallization during acid activation, ultimately leading to porous and partially amorphous structures.
SEM investigations before and after activation
The SEM images of the raw clay (Fig. 9a,b) show foliated smectitic clays containing weathered dolomite, which was confirmed by the dominance of Ca and Mg in the EDX analysis of rhombohedral dolomite (Fig. 9a). Fibrous Mg-rich sepiolite was also detected (Fig. 9b). The clay activated by 3 N HCl was not foliated (Fig. 9c–f), and palygorskite appeared in the form of cotton balls (Fig. 9c) after 4 h of activation. The moderate leaching of Al2+ was observed in the EDX analysis (Fig. 9e,f).
(a,b) SEM images of the raw clay of Lower Eocene (a-b) from the Jebel Jebbes El Meheri section. (a) Photomicrograph showing weathered dolomite embedded in a foliated smectite. (a1) EDX analysis of the dolomite reveals the presence of Ca, Mg, Si and Al. (b) Photomicrograph showing fibrous clay. (b1) EDX analysis showing the presence of Si, Al and Mg. (c–f) SEM images of the activated clay. (c) Photomicrograph showing the palygorskite. (d–f) Photomicrographs showing the disappearance of dolomite crystals and foliated clays. (e1) EDX analysis showing the large amounts of Si, average amounts of Al and small amounts of Mg2+, Ca2+ and Fe2+.

Influence of pH on the synthesis of porous materials
The raw clays were slightly basic (pH 7.86), becoming more acidic after activation (3 N HCl, 75°C, 4 h). This clay initially contained smectite, sepiolite, palygorskite, kaolinite, quartz and dolomite, which transformed into a porous material below pH 2.37. This new material had a higher specific surface area and porosity.
Bleaching tests of soybean oils
Characterization by Tonsil
Tonsil EX 0002 is a commercial bleaching earth used in industry for the filtration of soybean oil. Tonsil eliminates pigments and reduces loss of fat. It was used as a control regarding the clarification of the oil by the original and activated clays. The chemical analysis of Tonsil is listed in Table 2, and its XRD trace is shown in Fig. 8. Tonsil clay consists almost exclusively of smectite (Fig. 8), as was confirmed by the 001 peak that shifted from 14.25 Å (air-dried) to 17.35 Å (ethylene glycol-solvated) and collapsed to 10.02 Å after heating at 550°C for 4 h.
Clarification of soybean oil by Tonsil, original clay and activated clays
Maximum bleaching capacity was obtained after adding 0.75 wt.% Tonsil to the crude oil (Table 3). The addition of 0.5 and 1.0 wt.% Tonsil increased the optical density of the crude oil, suggesting inferior bleaching capacity.
Optical density of neutral soybean oils before clarification and optical density and bleaching capacity of soybean oils clarified by Tonsil, by raw clay and by activated clay (3 N HCl for 4 h at 75°C).

Table 3 Long description
Optical density is reported for crude soybean oil and for oils clarified with four aids at three dosage levels, alongside bleaching power for the same aids and dosages. Crude oil optical density is 2.35. Acid-activated clay has the lowest optical density at each dosage (0.72 at 0.50 percent, 0.515 at 0.75 percent, 0.85 at 1.00 percent) and the highest bleaching power (69.36, 78.08, 63.82). Basic-activated clay is next best overall, with optical density 1.02, 0.67, 0.95 and bleaching power 60.50, 71.48, 62.00. Tonsil shows moderate improvement in optical density (1.22, 1.031, 1.25) and bleaching power (46.15, 57.73, 37.24). Raw clay performs worst overall, staying closest to crude oil in optical density (2.04, 1.110, 1.7) and having the lowest bleaching power at 0.50 percent (13.19). For most aids, performance peaks at 0.75 percent dosage, while 1.00 percent often reduces bleaching power and sometimes increases optical density, suggesting more aid does not always improve clarification.
The clarified soybean oil provided optical densities lower than those of neutral soybean oils but slightly higher than those of the soybean oils treated with Tonsil. Maximum clarification of the raw clays was obtained after the addition of 0.75 wt.% clay to the oil (Table 3). In general, clarification of soybean oils using the original Tunisian clay was comparable to that achieved by Tonsil (Fig. 10 & Table 3). In addition, the bleaching capacity of the activated clays was considerably higher than that with Tonsil (Fig. 10 & Table 3). Finally, the optical densities of the clarified oil by activated clays (3 N HCl, 4 h, 75°C) were less than their counterpart oils clarified by Tonsil (Fig. 10d & Table 3).
(a) Soybean oil clarified by 0.75 g of the raw clay, (b) neutral soybean oil, (c) soybean oil clarified by Tonsil and (d) soybean oil clarified by 0.75 g of the clay activated for 4 h at 75°C by 3 N HCl.

Discussion
The XRD analysis shows that the raw clay is mainly composed of smectite (∼90%), with minor contents of palygorskite, sepiolite, dolomite and quartz (Figs 7a,b & 8). Following activation, changes in the mineralogical assemblage suggest partial dissolution of the clay phases (Fig. 7c). SEM observations support these results, showing morphological modifications of the clay minerals and evidence of dolomite dissolution after activation (Fig. 9c–f).
Crystallization of the pre-existing minerals and dissolution of dolomite were clearly observed, especially after acid activation. The release of Mg2+ and Ca2+ cations from dolomite and moderate dissolution of Al3+ cations increased significantly in the remaining smectite, sepiolite and palygorskite crystals, which act as a filter against organic impurities present in the oil. Al3+, Fe2+, Mg2+ and Ca2+ were released to a mild degree, and their release was gradual, which is in accordance with results from similar previous studies (Srasra & Trabelsi, Reference Srasra and Ayadi-Trabelsi2000, Reference Srasra and Ayadi-Trabelsi2001; Mosbahi et al., Reference Mosbahi, Khlifi, Jamoussi, Tlili, Çiner, Grab, Jaillard, Doronzo, Michard, Rabineau and Chaminé2022). In addition, interlayer Ca2+ was replaced by H+ emanating from HCl (Falaras et al., Reference Falaras, Kovanis, Lezou and Seiragakis1999; Murray, Reference Murray2000; Srasra & Trabelsi, Reference Srasra and Ayadi-Trabelsi2000, Reference Srasra and Ayadi-Trabelsi2001; Mosbahi et al., Reference Mosbahi, Tlili, Khlifi and Jeddoui2008, Reference Mosbahi, Tlili, Khlifi and Jamoussi2010; Didi et al., Reference Didi, Makhoukhi, Azzouz and Villemin2009; Usman et al., Reference Usman, Ekwueme, Alaje and Mohammed2012).
Optimum activation of the clay from the Meknassy-Mezzouna basin, central Tunisia, increased from 50.47 m2 g–1 in the raw clay to 100 m2 g–1 in the activated clay (Fig. 4). Similarly, the optimum conditions for the clarification of soybean oils were 0.75 wt.% for both Tonsil and the studied clay (Table 2). Furthermore, optical density (1.110), bleaching capacity (52.76%) and visual examination of the processed soybean oils showed that the quality of oil clarification using raw clay was inferior compared to that obtained with Tonsil (Fig 10a,c & Table 2). However, once activated, the studied clays performed better than Tonsil (Fig 10b,d & Table 2). Under optimal activation conditions, soybean oil treated with activated clay showed an optical density (0.515) lower than that of untreated oil (2.350) and oil treated with Tonsil (1.031) or the raw clay (1.110). Similarly, the bleaching capacity increased when using activated clay (78.08%) compared to raw clay (52.76%) or Tonsil (57.73%).
Conclusion
Acid activation of the Lower Eocene smectitic clays from the Meknassy–Mezzouna basin, central Tunisia, was optimized using 3 N HCl for 4 h at 75°C. Under these conditions, the performance of activated clays was comparable to that of the industrial Tonsil product used for oil clarification by the companies SATHOP and SOZITEX. Activation increased the specific surface area from 50.47 to 100 m2 g⁻1 and increased ion exchange of H+ for Mg2+ and Ca2+ between the smectitic clay and HCl. In addition, clay activation caused partial disruption of the smectitic clay structure and complete dissolution of non-clay minerals such as dolomite and francolite.
Moreover, the bleaching capacity of the raw clay for soybean oil was slightly lower than that for Tonsil. However, once activated, the clays produced significantly better results in terms of neutral soybean oil clarification than Tonsil, whose bleaching capacity was ∼78%. It can be concluded that the addition of 0.75 wt.% activated clay is adequate to obtain satisfactory clarification.
Competing interests
The authors declare none.