The importance of the study of stress and its effects on human behavior can be verified by the volume of research which has been carried out in recent years, particularly into the analysis of stress in the workplace (Boada, Diego, & Agulló, Reference Boada, Diego and Agulló2004; Cooper, Reference Cooper2005; Kahn, Wolfe, Quinn, Snoek, & Rosenthal, Reference Kahn, Wolfe, Quinn, Snoek and Rosenthal1964; Otto & Schmidt, Reference Otto and Schmidt2007).
Although the workplace would appear to be the most prolific context when it comes to research into stress, there are other, lesser focused upon settings, where the study of stress can also arouse interest, such being the case of the university environment (Abouserie, Reference Abouserie1994; Schaufeli, Martínez, Pinto, Salanova, & Bakker, Reference Schaufeli, Martínez, Pinto, Salanova and Bakker2002, Swick, Reference Swick1987; Travers, Reference Travers2011). Also, as in this study, some research has been specifically concerned with the design of suitable instruments for correctly measuring stress in different samples, for example in teenagers (Byrne, Davenport, & Mazanov, Reference Byrne, Davenport and Mazanov2007; Escobar, Blanca, Fernández-Baena, & Trianes, Reference Escobar, Blanca, Fernández-Baena and Trianes2011; Fillian, Fastenau, Tashner, & Cross, Reference Fillian, Fastenau, Tashner and Cross1989).
Generally in Europe, and particularly in Spain, the launch of the new plans of university study within the project known as the Bologna Process poses a real challenge, as much for teaching staff as for students, but without doubt, it is the latter who must make an extra effort in order to effectively adapt to the new plans and methods, particularly students who are at their first year at the university, given that the system allows them greater autonomy in planning and managing their learning process.
Some recent studies have shown that students suffer higher levels of stress and less satisfaction than professionals occupying positions traditionally associated with stressful situations, such as teachers, nurses and humanitarian workers (Cotton, Dollard, & De Jonge, Reference Cotton, Dollard and De Jonge2002; Dollard, Winefield, & Winefield, Reference Dollard, Winefield and Winefield2001). In university students, the perception and experience of stress tends to be associated with certain factors like greater pressure, poor ability to manage workload, or the lack of peer support (Travers, Reference Travers2011). Peer support can be seen to further diminish when the person in question is experiencing high levels of emotional irritation, as will be outlined later in the theoretical model explaining irritation.
As the study of stress has been furthered, the range of associated concepts has also increased, such as burnout (Maslach & Jackson, Reference Maslach and Jackson1981), mobbing (Leymann, Reference Leymann1996), and engagement (Hakanen, Bakker, & Schaufeli, Reference Hakanen, Bakker and Schaufeli2006). In addition to these terms, the concept of “Irritation” has attracted increased interest among researchers, particularly research into work-related stress. The concept of irritation was initially introduced by a team of researchers at the University of Leipzig (Mohr, Reference Mohr1986) and developed in later studies (Dormann & Zapf, Reference Dormann and Zapf2002; Mohr, Müller, & Rigotti, Reference Mohr, Müller and Rigotti2005; Mohr, Rigotti, & Müller, Reference Mohr, Müller and Rigotti2005).
As defined by the authors, this concept refers to a state of progressive psychological exhaustion which cannot be alleviated by normal rest. In the German interpretation, the original concept refers to experiencing personal uncertainty in relation to work and includes reactions such as malaise, discomfort, increased panic, generalized anger and a disagreeable disposition when interacting with others. Mohr (Reference Mohr, Greif, Bamberg and Semmer1991) has proposed a model of development of depressive symptoms, and psychosomatic complaints via a spiral of irritation, and reduced self-esteem, so it seems appropriate to deepen in this direction setting the following predictions: We expected a positive correlation between Irritation Scale factors and depression and academic burnout. Meanwhile, we expected a negative correlation between Irritation Scale factors and general self-efficacy, self-regulation, general health, and self-esteem; furthermore, we expected a negative correlation between both irritation factors and most of the big five factors. The model proposed hypothesizes that the two factors of the Irritation Scale, emotional irritation and cognitive irritation, relate to some constructs (e.g., burnout, depression) in a similar way. This fact does not weaken the discriminant validity because the two subscales assess complementary dimensions of the irritation experienced.
In the latest research carried out in workplace, two dimensions within the state of irritation may be unequivocally distinguished: Firstly, cognitive irritation (CI), a concept related to the tendency to recurrently dwell upon work-related thoughts when one is not at work (Martin & Tesser, Reference Martin, Tesser and Wyer1996). This dimension was initially called rumination. The second dimension is known as emotional irritation (EI), originally called irritability, related to one’s emotional disposition to feel and respond from an inner state of rage, openly displaying anger when relating to others. Within the university setting, this state may hamper appropriate relations with peers when carrying out group work with fellow students, given that the surfacing of negative attitudes towards others may provoke rejection on behalf of group members.
Research into the state of irritation has fundamentally been centered upon studies of the Irritation Scale (Mohr, Reference Mohr1986), an instrument which, as later described, offers very suitable psychometric properties, as much in terms of internal consistency as of construct validity, when measuring stress levels in the workplace (Merino, Carbonero, Moreno, & Morante, Reference Merino, Carbonero, Moreno and Morante2006; Mohr, Müller, Rigotti, Aycan, & Tschan, Reference Mohr, Müller, Rigotti, Aycan and Tschan2006).
Given that the instrument has proven useful in work-related situations, the aim of this study was to assess whether the Irritation Scale may be applied to other contexts, such as for measuring stress among university students, searching for generalizability of the scale according to Messick’s (Reference Messick1995) proposal. There are recent studies that have applied the scale to students, but the sample consisted of school adolescents (Jacobshagen, Rigotti, Semmer, & Mohr, Reference Jacobshagen, Rigotti, Semmer and Mohr2009); so it is the first time that it is applied to university students. Therefore, the general aim of this study was to carry out a factorial validation of the Spanish adaptation of the Irritation Scale with data from Spanish university students. In order to do so, it was necessary to determine the factorial structure of the Irritation Scale and to establish the consistency levels of the resulting factors. The initial hypothesis, following the original proposal of the authors, was that the confirmatory analysis will give rise to two interdependent factors, one corresponding to emotional irritation and the other to cognitive irritation, the same as has been found in recent international studies based in the workplace (Merino et al., Reference Merino, Carbonero, Moreno and Morante2006; Mohr et al., Reference Mohr, Müller, Rigotti, Aycan and Tschan2006). Another aim of this study was to determine the criterion-related validity of the Irritation Scale, comparing the results with those obtained with other negative variables such as depression or burnout, and with other positive variables such as self-regulation, self-esteem or the overall self-efficacy perceived.
To sum up, within the context proposed in the introduction, the overall aim of this study was to assess the validity of the Irritation Scale in a sample of university students, addressing three of the six aspects of Messick’s framework (1995) on construct validity: structural (factorial structure analyzed via Exploratory Structural Equation Modelling approach (ESEM), generalizability (use of the Irritation Scale with a university population), and external (relationships with other constructs).
Method
Procedure and Participants
Data collection was undertaken during the 2010–2011 academic year. The sample used in the study consisted of 578 university students from some 20 universities of Spain, questionnaires were gathered from three Spanish universities: Universidad Rovira i Virgili (Tarragona), Universidad de Salamanca, and Universidad de Valladolid. Subjects were not randomly chosen; they participated in the process of data collection on a strictly voluntary basis and were informed of the aims of the study, so it is a non-random or incidental sample. In terms of gender distribution, there were 148 males (25.7%), and 428 females (74.3%), reflecting the current situation in Spanish universities. The average age of participants was 21.6 years (SD = 4.94). In terms of the academic subjects being studied 356 participants (61.9%) were degree students, 161 (28%), were studying for a diploma, 52 (9%), were studying towards a licentiate and 6 (1%), other types of study, such as a Master’s. In terms of the year of study, 282 of the subjects (49.9%) were in their first year, 113 (20%) in their second year, 52 (9.2%) in their third year, 87 (15.4%) in their fourth year, 28 (5%) in their fifth year and, finally, 3 students (.5%) were undertaking postgraduate study. Some participants left specific demographic items blank.
Instruments
Before answering the research instruments, participants were required to answer a number of questions regarding important data from their academic and personal life, their marks for entering the university and the previous academic year, the number of times woken during the night, and the number of study-related thought in free time.
In order to assess academic performance, quantitative data were collected; specifically participants were asked to respond to the following questions:
“What was your overall mark in the university entrance exam?”
“What was your average mark during the last academic year?”
Besides, participants were also asked to respond to the following questions:
“How many times have you awoken during the night thinking about something related to one of your subjects?”
“How many times have you thought about something related to one of your subjects in your free time?”
In order to carry out this study the following research instruments were used.
The Irritation Scale (IS; Mohr, Reference Mohr1986)
The first instrument used in this study was the Irritation Scale, a tool which, as has been previously mentioned, constitutes the object of analysis of this study. It consists of 8 items which are evaluated through a Likert-type scale ranging from 1 (completely disagree) to 7 (completely agree). It is currently published by the German group Hogrefe Publishing Company. This tool has been used in Spanish in studies in the workplace (Merino et al., Reference Merino, Carbonero, Moreno and Morante2006) with acceptable reliability (α value .86 for emotional irritation and .87 for cognitive irritation).
In the present study, the scale was adapted from the context of the workplace to that of the university, for which Items 1, 2, 4, and 8 were reformulated, changing the references from work-related situations to ones related to university. On the other hand, Items 3, 5, 6, and 7 remained the same.
The correlations of the scale with other associated concepts highlight the construct validity. Concretely, statistically significant positive correlations have been observed with other psychological concepts such as anxiety (r = .61), psychosomatic disorders (r = .51) or symptoms of depression (r = .44).
As mentioned in the introduction, international research currently being carried out (Merino et al., Reference Merino, Carbonero, Moreno and Morante2006; Mohr et al., Reference Mohr, Müller, Rigotti, Aycan and Tschan2006) has confirmed a two-dimensional structure, with one component known as cognitive irritation. For example the item: “I have difficulty relaxing after work”, in the original version and, “I have difficulty relaxing after attending class”, in the version adapted to the university context. For emotional irritation, an example is “I get angry quickly”.
The General Self-Efficacy Scale (GSES; Baessler & Schwarzer, Reference Baessler and Schwarzer1996)
This scale offers an overall mark for the feeling of confidence in one’s own abilities to confront the demands of the environment in which they operate and, therefore, in the university setting, it offers a general idea of the opinion students have of their overall ability to confront the tasks and demands of university. It includes 10 items (e.g., “I can always manage to solve difficult problems if I try hard enough”) ranked between 1 (completely disagree) and 10 (completely agree).
In 1981 the original version was published which was later reduced to the current 10 items. The latest version of this scale has been used in numerous countries and shows quite acceptable indices of reliability, with alpha values between .75 and .91 in the various international studies carried out. In terms of validity results, significant correlations have been found with other variables such as optimism (r = .52) and anxiety (r = –.42) (Scholz, Gutiérrez-Doña, Sud, & Schwarzer, Reference Scholz, Gutiérrez-Doña, Sud and Schwarzer2002). This instrument has already been the subject of study and adaptation for Spanish samples (Baessler & Schwarzer, Reference Baessler and Schwarzer1996).
The Self-Regulation Scale (SRS; Luszczynska, Diehl, Gutiérrez-Doña, Kuusinen, & Schwarzer, Reference Luszczynska, Diehl, Gutiérrez-Doña, Kuusinen and Schwarzer2004)
The third instrument used in this study was the Self-Regulation Scale -SRS, specifically the most recent version reduced to only seven items (Luszczynska et al., Reference Luszczynska, Diehl, Gutiérrez-Doña, Kuusinen and Schwarzer2004) assessed on a scale from 1 (not at all) to 4 (a lot) (e.g., “If I am distracted from an activity, I don’t have any problem coming back to the topic quickly”). Spanish versions of both the General Self-Efficacy Scale and the Self-Regulation Scale were supplied directly by the research group at Freie University in Berlin. Cronbach’s alpha values vary between .63 and .87; in terms of validity, significant values have been found with perceived general self-efficacy (r = .75, p < .001) and depression (r = –.25, p < .001) (Luszczynska et al., Reference Luszczynska, Diehl, Gutiérrez-Doña, Kuusinen and Schwarzer2004).
The Rosenberg Self-Esteem Scale (RSES; Rosenberg, Reference Rosenberg1965)
This instrument serves to evaluate the degree of acceptance and respect towards oneself, consisting of 10 items (e.g., “I am able to do things as well as the majority of people”) assessed on a Likert-type scale ranging from 1 (completely disagree) to 4 (completely agree). Items 1, 3, 4, 7, and 10 are ranked directly, whereas Items 2, 5, 6, 8, and 9 are inversely ranked.
The version of the instrument used in this study is the Spanish adaptation to a sample of university students (Martín-Albo, Núñez, Navarro, & Grijalva, Reference Martín-Albo, Núñez, Navarro and Grijalva2007); in which its one-dimensional structure was confirmed.
Beck Depression Inventory (BDI; Beck, Ward, Mendelsohn, Mock, & Erbaugh, Reference Beck, Ward, Mendelsohn and Erbaugh1961)
This is a classic tool in the evaluation of states of depression in individuals. Initially created by Beck et al. (Reference Beck, Ward, Mendelsohn and Erbaugh1961), it has undergone various adaptations in different languages. It consists of 21 items (e.g., “I feel continually sad”), the majority assessed on a scale with four options. Currently, it is one of the most frequently used tools for evaluating depressive states.
The General Health Questionnaire (GHQ; Goldberg & Hillier, Reference Goldberg and Hillier1979)
This instrument was initially developed to detect possible psychiatric disorders (Goldberg & Hillier, Reference Goldberg and Hillier1979). It allows a general evaluation of a person’s state of health to be obtained. In order to obtain the results of this questionnaire, it must be taken into account that high scores indicate a poor state of health. In this study the 12-item version was used (e.g., “Have you felt capable of making decisions?”), assessed on a scale with four alternatives.
Overall Personality Assessment Scale (OPERAS; Vigil-Colet, Morales-Vives, Camps, Tous, & Lorenzo-Seva, Reference Vigil-Colet, Morales-Vives, Camps, Tous and Lorenzo-Seva2013)
This is a questionnaire based on the model considering the big five factors of personality: Extroversion, emotional stability, agreeableness, conscientiousness and openness to experience (Costa & McCrae, Reference Costa and McCrae1992; McCrae & Costa, Reference McCrae and Costa1987). It must be taken into account that, in this case, emotional stability was assessed instead of neuroticism.
The first dimension is extroversion/introversion and is concerned with the degree to which an individual is talkative, sociable and active. Emotional stability/neuroticism refers to the degree to which a person is secure, calm, independent and autonomous. Agreeableness or agreeableness/hostility relates to the level to which a person trusts others, is anxious, agreeable, generous, tolerant, honorable, cooperative and flexible. Conscientiousness/irresponsibility is concerned with the level of responsibility, the degree to which a person is conformist, organized and tenacious in the tasks and goals he or she wants to achieve. For some it is the most important factor when selecting personnel. Finally, openness to experience is concerned with a person’s level of intellect and the degree to which they are philosophical, intuitive, creative, artistic and curious.
The questionnaire consists of a total of 40 items (e.g., “I make friends easily”), assessed on a Likert-type scale with options ranging from 1 (completely disagree) to 5 (completely agree). In relation to the psychometric factors, the results found show an adequate goodness-of-fit to the Five Factor Model. Cronbach’s alpha values obtained in a previous study (Vigil-Colet et al., Reference Vigil-Colet, Morales-Vives, Camps, Tous and Lorenzo-Seva2013) are as follows: .86 for extroversion and emotional stability, .77 for conscientiousness, .71 for agreeableness and .81 for openness to experience. These are acceptable levels of reliability, especially considering that each scale is only made up of 7 items.
The School Burnout Inventory (SBI; Salmela-Aro, Kiuru, Leskinen, & Nurmi, Reference Salmela-Aro, Kiuru, Leskinen and Nurmi2009)
This questionnaire was developed with the aim of assessing the state known as burnout within the school environment (Salmela-Aro et al., Reference Salmela-Aro, Kiuru, Leskinen and Nurmi2009). It is an instrument consisting of nine items (e.g., “I am losing interest in my academic work”) which are assessed on a Likert-type scale ranging from 1 (completely disagree) to 6 (completely agree).
As well as an overall score, the questionnaire has three dimensions: academic exhaustion, cynicism towards the importance of study and a sense of inadequacy in the school environment.
Currently, the Spanish version of this tool is being validated with samples of students from Spanish universities, using Confirmatory Factor Analysis and testing for construct validity (Boada-Grau, Merino-Tejedor, Sánchez-García, & Vigil-Colet, Reference Boada-Grau, Merino-Tejedor, Sánchez-García and Vigil-Colet2011).
Statistical Analyses
Data analyses corresponding to the internal consistency and criterion-related validity were carried out through the statistical package SPSS 19.0. Cronbach’s coefficient alpha value was used to estimate reliability, while Pearson’s correlation coefficient was used for the analysis of criterion-related validity. The univariate and multivariate normality assumption was analyzed using the EQS 6.1 program (Bentler, Reference Bentler1995) to obtain univariate skew and kurtosis indices, and Mardia’s normalized multivariate kurtosis. On the other hand, for carrying out the factor analysis, the Exploratory Structural Equation Modeling approach (ESEM) proposed by Asparouhov and Muthén (Reference Asparouhov and Muthén2009) was used, given that some researchers have observed that the goodness-of-fit criteria in conventional confirmatory factor analysis is too restrictive, particularly in the measurement of personality features (Asparouhov & Muthén, Reference Asparouhov and Muthén2009; Ferrando & Lorenzo-Seva, Reference Ferrando and Lorenzo-Seva2000). These analyses were performed with the MPlus 6.1 program (Muthén & Muthén, 1998–2010). The criteria used are described in the results section.
Results
Reliability Analysis
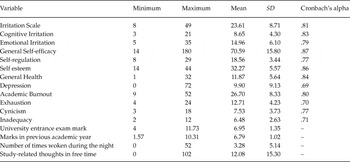
The consistency data of the Irritation Scale, as well as descriptive statistics corresponding to the measures of central tendency and to the measures of dispersion, are shown in Table 1. The mean obtained from the Irritation Scale reached a value of 23.61 (SD = 8.71), the average for emotional irritation being 14.96 (SD = 6.10) and for cognitive irritation 8.65 (SD = 4.30). The data corresponding to the other variables may also be observed in Table 1.
Descriptive statistics and reliability values

Reliability analysis (α value) yielded internal consistency coefficients of .81, .82, and .79 for the global scale, the Cognitive Irritation Scale, and the Emotional Irritation Scale, respectively. These consistency data are very similar to those obtained in previous studies (Merino et al., Reference Merino, Carbonero, Moreno and Morante2006; Mohr et al., Reference Mohr, Müller, Rigotti, Aycan and Tschan2006).
Factorial Validity
The factorial analysis was performed using Exploratory Structural Equation Modeling (ESEM) (Asparouhov & Muthén, Reference Asparouhov and Muthén2009). This procedure provides the goodness-of-fit indices usually obtained in the model of structural equations. In this way, one and two-factor models were tested, as proposed in the theoretical models.
At the univariate level, skew and kurtosis indices should not be greater than 2 and 7, respectively (e.g., Curran, West, & Finch, Reference Curran, West and Finch1996), while at the multivariate level, it has been suggested that matters get troublesome when Mardia’s normalized multivariate kurtosis is greater than 3 (e.g., Bentler & Wu, Reference Bentler and Wu2002). The descriptive statistics of items showed that the skew index ranged from –0.13 to 1.86, the kurtosis index ranged from –.97 to 3.30, and the Mardia’ normalized multivariate kurtosis was 11.13. Thus, there was acceptable univariate normality, but the high value of Mardia’s coefficient suggests that the data were multivariate nonnormal. We did not use any data imputation technique because there were no missing data.
We used a robust maximum likelihood estimator (MLR), with standard errors and tests of fit that are robust in relation to nonnormality and nonindependence of observations (Muthén & Muthén, 2008–2010) and an oblique geomin rotation with an epsilon value of .5. The geomin rotation is recommended when factor indicators have substantial loadings on more than one factor resulting in a variable complexity greater than one (Asparouhov & Muthén, Reference Asparouhov and Muthén2009). Items were considered as continuous variables because they have seven categories, and the input for the analyses was the correlation matrix. Four goodness-of-fit indices were considered: the robust chi-square test statistic, the root-mean-square error of approximation (RMSEA), the comparative fit index (CFI), and the Tucker-Lewis index (TLI). It is well known that chi square test statistic is very sensitive to sample size and it is difficult to achieve a satisfactory fit as the sample size increases. For the RMSEA, values less than .05 and .08 reflect a close fit and a reasonable fit to the data, respectively. For both the CFI and TLI, values greater than .90 and .95, respectively, typically reflect acceptable and excellent fit to the data (Hu & Bentler, Reference Hu and Bentler1999; Marsh, Hau, & Wen, Reference Marsh, Hau and Wen2004).
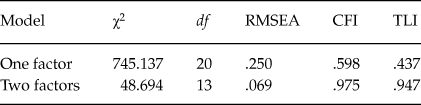
The results corresponding to the goodness-of-fit indices and factor loadings are shown in Tables 2 and 3, respectively. A unidimensional model is not appropriate to describe the Irritation Scale because the values of all goodness-of-fit indices were unacceptable (Table 2). Moreover, the bidimensional model presented a good adjustment. Although the chi-square test statistic was significant, χ2(13) = 48.694, p < .001, indicating lack of fit, this results is expected by the big sample size (N = 578). However, all indices of practical fit indicated reasonable fit to the data (Jackson, Gillaspy, & Purc-Stephenson, Reference Jackson, Gillaspy and Purc-Stephenson2009): RMSEA = .069, CFI = .975, and TLI = .947 (see Table 2). The fit of the two-factor model is adequate, but is in contrast to results of Mohr et al. (Reference Mohr, Müller, Rigotti, Aycan and Tschan2006) who showed inadequate fit based on RMSEA values, even after eliminating Items 5 and 8 (because of cross loading).
Goodness-of-fit indices for the theoretical models

Note:
χ2 = robust chi-square test statistic, df = degrees of freedom, RMSEA = root-mean-square error of approximation, CFI = comparative fit index, and TLI = Tucker-Lewis index.
Factor loadings of two-factor model

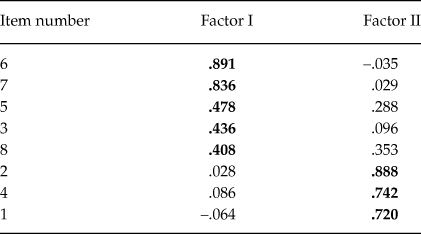
In Table 3 the factor loadings of the eight items within the two factor model are displayed. The first factor, corresponding to emotional irritation, is composed by Items 3, 5, 6, 7, and 8; while the second factor, corresponding to cognitive irritation, includes Items 1, 2 and 4. The correlation between both factors was .246.
Therefore, the results corroborate the proposed aim of the study in that the factor structure of the instrument contains the presence of two factors, giving support to the structural validity of the construct of irritation (Messick, Reference Messick1995).
Criterion-related Validity
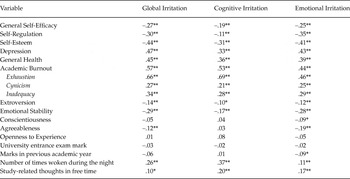
In order to analyze these results, the observed correlations between the Irritation Scale and the other variables are summarized below. The results obtained from this analysis are shown in Table 4. As shown in this Table, the Pearson correlation coefficients indicate that all variables displayed significant correlations in the manner expected, giving support to the external aspect of construct validity (Messick, Reference Messick1995).
Correlations between the variables and the Irritation Scale (criterion-related validity)

Note:
*p < .05; **p < .01.
The Irritation Scale shows significant, positive correlations with the state of depression. The results obtained show significant, positive correlations between the state of depression and global irritation (r = .47, p < .01, medium effect size), as well as between depression and the two irritation factors, emotional and cognitive.
The Irritation Scale shows significant and positive correlations with the state of academic burnout. The results obtained show significant and positive correlations between the overall state of irritation and the syndrome of academic burnout (r = .57, p < .01, large effect size), as well as between the state of burnout and the two components of irritation. In terms of the three dimensions of burnout: exhaustion, cynicism, and lack of adaptation to the context, significant and positive correlations with the irritation scores also appeared. The results corresponding to these three dimensions are reflected in Table 4 with their corresponding levels of statistical significance.
The positive correlation between irritation and burnout is similar to that found in previous studies where the relationship between irritation and the state of work-related burnout has been explored in samples of teachers (Merino et al., Reference Merino, Carbonero, Moreno and Morante2006).
Thus, these data confirm the theoretical model which predicts a positive relationship between the Irritation Scale and negative constructs such as the state of depression and burnout, in this case within an academic setting.
The state of irritation shows significant and negative correlations with overall perceived self-efficacy, self-regulation, and self-esteem. The results obtained confirm that as much global irritation (r = –.27, p < .01, small effect size); as emotional and cognitive irritation show significant and negative correlations with overall perceived self-efficacy, as predicted in the theoretical model. The results obtained are similar in the case of self-regulation, also confirming that as much global irritation (r = –.30, p < .01, medium effect size) as its two dimensions show significant and negative correlations with self-regulation. Similar results were found for self-esteem, as shown in Table 4.
These data corroborate the predictions of the theoretical model regarding the negative relationship between the Irritation Scale and positive variables such as overall self-efficacy, self-regulation or self-esteem.
The Irritation Scale shows significant and negative correlations with the state of health. To interpret the results obtained with this variable, it must be taken into account that the state of health, as assessed by the GHQ, is worse the greater the score on the questionnaire. Therefore, the objective in this case should be expressed in the following terms: The Irritation Scale will show significant positive correlations with the scores obtained in the GHQ.
The results obtained in this case are positive and significant, therefore providing empirical evidence as to the construct validity of the instrument, as much in the case of overall irritation as (r = .45, p < .01, medium effect size) in that of its two components.
The Irritation Scale shows significant and negative correlations with some personality dimensions, specifically extroversion, emotional stability and agreeableness. In the case of overall irritation, the results are all significant, as much in relation to extroversion (r = –.14, p < .01, small effect size), as emotional stability (r = –.29, p < .01, small effect size) and agreeableness (r = –.12, p < .01, small effect size). Emotional irritation also shows significant correlations with extroversion (r = –.12, p < .01), emotional stability (r = –.28, p < .01) and agreeableness (r = –.19, p < .01), all of them with small effect size. Finally, cognitive irritation also shows significant correlations with extroversion (r = –.10, p < .05, small effect size), and emotional stability (r = –.17, p < .01, small effect size). However, there is no significant correlation between cognitive irritation and agreeableness; these results show a lesser affinity with the results shown for emotional irritation and overall irritation.
The Irritation Scale shows significant and negative correlations with academic performance. This hypothesized relationship was only partially supported, given that the only significant relationship was observed between emotional irritation and the marks from the previous academic year (r = –.09, p < .05, small effect size). Significant correlations with cognitive and overall irritation were not found.
Finally, the relationship between the scale and two other correlates was tested; one related to problems with insomnia and the other with recurring thoughts during leisure time. In the case of sleeping problems, the relationship was significant as much in the case of overall irritation (r = .26, p < .01, small effect size), as in the case of its two components, cognitive irritation (r = .37, p < .01, medium effect size) and emotional irritation (r = .11, p < .01, small effect size). On the other hand, in the case of recurring thoughts during leisure time, significant correlations were also found with global irritation and the two components, all of them with small effect size, as predicted in the theoretical model.
Discussion
In light of the results obtained in this study, it can be confirmed that the Irritation Scale offers optimum psychometric properties for use in the assessment of stress among university students, a different setting to that in which it has been used.
All the objectives proposed in this study were confirmed. Firstly, the internal consistency data, measured using Cronbach’s alpha coefficient, are very favorable, as much for the Scale for overall irritation as for each of its two components, Cognitive Irritation and Emotional Irritation. Also, the validation of the two aforementioned factors on the scale, through factor analysis, confirms the same structure offered by the Irritation Scale when used in workplace contexts with different samples of workers (Merino et al., Reference Merino, Carbonero, Moreno and Morante2006; Mohr et al., Reference Mohr, Müller, Rigotti, Aycan and Tschan2006). Finally, in terms of the results for the criterion-related validity, all of the objectives have been confirmed. Thus, significant and negative correlations were obtained between both factors of the Irritation Scale and positive constructs such as self-esteem, general perceived self-efficacy and self-regulation, as predicted by the theoretical model. On the other hand, significant and positive correlations were obtained between the Irritation Scale and negative variables; implying that showing higher levels of irritation, whether cognitive or emotional, is associated with higher scores in constructs such as depression, academic burnout and a worse state of general health.
The Irritation Scale also shows significant, negative relationships with certain personality dimensions such as extroversion, emotional stability, conscientiousness, and agreeableness. Both factors, cognitive and emotional irritation, showed similar scores in extroversion and emotional stability. Meanwhile, conscientiousness and agreeableness only yielded significant correlations with emotional irritation.
Finally, in terms of its relationship with academic performance, the results were not as sound as those previously reported, given that out of the two variables used, the marks on university entrance exams and the marks from the previous academic year, the only significant relationship observed was between emotional irritation and the marks from the previous year. This may be due to the fact that, among other reasons, the present study chose a retrospective measure of academic performance, as students were asked about their past performance. This constitutes a limitation to the study. For future research, estimates of present and future academic performance should be included.
Therefore, in conclusion, it can be stated that the Irritation Scale, which has been proven useful in workplace environments, is also an appropriate tool for measuring levels of stress among university students, as much for its psychometric properties of internal consistency, as for its factor and construct validity. Thus, one application of this research is the possibility to use the Irritation Scale to measure stress among university students.
Although in this study we have found similar results for the two dimensions of the Irritation Scale, cognitive and emotional irritation, there are some remarkable differences between them. For example, cognitive irritation showed a large effect size correlation with the component exhaustion of the academic burnout and a medium effect size with number of times woken during the night, whereas emotional irritation showed only a medium effect size correlation with exhaustion. Furthermore, in the case of self-regulation, emotional irritation presented medium effect size whilst cognitive irritation showed only a small effect size.
In terms of the limitations of this study, it must be noted that, although the sample was considerably large (N = 578), the subjects were all from the same country. Therefore, future research could study whether the scale shows the same results with a sample of international university students. Another possible limitation concerns the extent to which measurement of irritability and relationship between constructs are equivalent for women and men (Byrne, Reference Byrne2008). This issue could be addressed in future research.
In terms of possible future lines of research there is, for example, the possibility to carry out a comparative study with students from different universities or plans of study to identify whether there are any significant differences between them. Other lines of study may also be considered, such as the relationship between irritation and the degree of commitment, the locus of control (Muhonen & Torkelson, Reference Muhonen and Torkelson2004), time managing practices (Macan, Shahani, Dipboye, & Phillips, Reference Macan, Shahani, Dipboye and Phillips1990), the psychological detachment (Sonnentag & Bayer, Reference Sonnentag and Bayer2005) or the dropout rate. Further research can also consider a SEM-Analysis with irritation as an outcome or as a mediating variable between stressors and psychological and physical symptoms.