Introduction
The properties of materials are critically influenced by the presence or absence of single atoms. For example, the electronic, magnetic, and optical properties of semiconductors depend upon the concentration of dopant atoms. Likewise, the segregation of impurity atoms to defects, such as grain boundaries, often results in catastrophic failure of structural materials. Reference Duscher, Chisholm, Alber and Ruhle1 Impurity atoms at grain boundaries also lead to dramatic changes in the electronic Reference Kim, Duscher, Browning, Sohlberg, Pantelides and Pennycook2 and ionic conductivity of a material. Reference Frechero, Rocci, Sanchez-Santolino, Kumar, Salafranca, Schmidt, Diaz-Guillen, Dura, Rivera-Calzada, Mishra, Jesse, Pantelides, Kalinin, Varela, Pennycook, Santamaria and Leon3 Point defects in materials, such as phosphorous impurities in silicon and nitrogen-vacancy centers in diamond, are some of the leading candidates for the emerging field of quantum computing. Reference Xiang, Ashhab, You and Nori4 Imaging the location of single impurity or dopant atoms within such materials, ideally along with information about its dynamical behavior is, therefore, an important pursuit in materials science, with the ultimate goal being the ability to control the position of atoms within the material. Reference Kalinin, Borisevich and Jesse5,Reference Jesse, Borisevich, Fowlkes, Lupini, Rack, Unocic, Sumpter, Kalinin, Belianinov and Ovchinnikova6
The correction of aberrations in the scanning transmission electron microscope (STEM) has made imaging and spectroscopy of individual atomic columns a routine task. It is also possible to identify the three-dimensional (3D) structure of a material using electron tomography incorporating STEM annular dark-field (ADF) imaging. Reference Yang, Chen, Scott, Ophus, Xu, Pryor, Wu, Sun, Theis, Zhou, Eisenbach, Kent, Sabirianov, Zeng, Ercius and Miao7 The improvement in the depth-of-focus in aberration-corrected STEM, when combined with image simulations, now allows identification of the depth location of isolated dopant atoms from the contrast in STEM ADF images. Reference Ishikawa, Lupini, Findlay, Taniguchi and Pennycook8–Reference LeBeau, Findlay, Allen and Stemmer10
Aberration correction also improves the signal-to-noise ratio in ADF images, which allows atomic-resolution images to be obtained at faster scan rates with lower beam currents and at low-to-moderate acceleration voltages (20–300 kV). Reference Krivanek, Chisholm, Dellby, Murfitt, Pennycook and Nellist11 Together, these factors also lead to an improvement in the temporal resolution for acquiring STEM images. It is now possible to sequentially acquire multiple atomic-resolution images of materials at a fast scan rate of a few seconds, or less, per frame. Moreover, the use of acceleration voltages below the threshold for knock-on damage of the bulk atoms allows various diffusion processes to be deliberately excited by the beam and then to be observed in real-time using time-sequential STEM ADF imaging. This ability has opened up a new frontier in materials characterization by enabling direct observations of the dynamics of single dopant or impurity atoms in materials. In the past few years, time-sequential STEM imaging has led to new insights about diffusion processes both on the surface and within materials, motion of vacancies, single impurity atoms and few-atom clusters in two-dimensional (2D) materials, dislocation motion in materials, behavior of impurity atoms at grain boundaries and atomic-scale insights into phase transformations.
In this article, we begin with a brief discussion of the various electron-beam–specimen interactions that can induce low-energy excitation of atoms and then review some state-of-the-art applications using STEM imaging to study material processes controlled by single-atom dynamics.
Electron-beam–specimen interactions
When a specimen is exposed to an electron beam, the atoms in the material gain energy and momentum through elastic and inelastic collisions. A large transfer of energy and momentum from the beam to the specimen leads to irreversible damage in the form of mass loss, which occurs either through direct knocking out of atoms or through radiolysis. Beam damage in different classes of materials in conventional transmission electron microscopy (TEM) or STEM has been studied extensively. Egerton et al. Reference Egerton, Li and Malac12,Reference Egerton, McLeod, Wang and Malac13 provide a general review of various beam-damage mechanisms. The activation energy for diffusion of atoms in crystalline materials is, however, significantly smaller (∼0–5 eV) than the energy required for direct knock out from the lattice (typically >10 eV), although the reduced number of bonds for surface atoms means that these can typically be sputtered relatively easily. Reference Egerton, McLeod, Wang and Malac13 For bulk atoms, atomic displacements are more likely than pure knock-on events to occur during fast sequential imaging in STEM.
For purely elastic scattering, the amount of energy transferred to an atom increases with increasing scattering angle and is maximum for head-on collision. The energy transfer also increases with decreasing atomic number (i.e., for the same scattering angle, there is a larger energy transfer to lighter atoms). An atom is likely to move to a different site if the transferred energy is greater than the activation barrier to reach the saddle point. The activation barrier can be estimated from radioisotope experiments. Increasingly, however, the saddle point and minimum energy paths for atomic diffusion are obtained from first-principles density functional theory (DFT) calculations using the nudged elastic-band method, which works by optimizing a series of intermediate images along the diffusion path. Reference Henkelman, Uberuaga and Jónsson14 With the increase in computing power and the availability of improved exchange-correlation functionals in DFT (that approximate the many-body interactions between electrons), the activation barrier of different diffusion mechanisms in the presence of impurities and defects can be calculated with high accuracy. The synergistic combination of STEM and DFT has become a powerful tool to study materials; STEM images provide a view of the static and dynamic atomic structure while DFT calculations provide information about the barrier and the material functionality.
It is also possible to control the amount of elastic energy transferred to different atoms and excite atoms across different barriers by controlling the acceleration voltage of the incident electrons. One of the key advantages of aberration-correction in STEM is that the range of microscope voltages at which a particular spacing can be resolved is extended, due to the improved resolution. We anticipate that the increased use of aberration correction at carefully selected voltages will become a powerful tool to study bulk-diffusion processes in real time.
Inelastic scattering also transfers energy to the specimen atoms by exciting core electrons to unoccupied states. Such electronic excitations can result in atomic displacements by a variety of processes, such as the conversion of the excitation energy into momentum through electron–phonon coupling, or due to Coulomb repulsion of ions from an induced electric field (radiolysis). Atomic displacement due to inelastic scattering processes is more prominent in materials with higher resistivity due to the localized nature of electronic excitations. The induced electric field under the probe has been inferred as the cause of controlled migration of Nb and Ge atoms in silicate glasses enabling writing of nanorings (rings of Nb and Ge atoms within the glass matrix with diameters of a few tens of nm) using a STEM probe, Reference Jiang, Hembree, Spence, Qiu, de Abajo and Silcox15 and of the cooperative movement of the atoms resulting in phase segregation and phase transformation. Reference Su, Wang, Ma and Jiang16 The mechanisms for atom displacements due to inelastic processes are complex, Reference Jiang17 and we suggest that a better understanding is needed to better control the displacement behavior.
Atom dynamics on surfaces
Surfaces give rise to novel physical phenomena and determine the catalytic and sensory activity of a material. Single atoms or small atomic clusters are known to play a decisive role in catalytic activity by serving as active sites and increasing the turnover frequency of the catalyst. An understanding of the surface diffusivity of single atoms may lead to ways to limit their aggregation behavior. Scanning tunneling microscopes (STMs) have been instrumental for observing atom-scale surface diffusion mechanisms on materials. Reference Parkinson, Novotny, Argentero, Schmid, Pavelec, Kosak, Blaha and Diebold18,Reference Gohlke, Mishra, Restrepo, Lee, Windl and Gupta19 However, the mechanical movement of the tip in STMs limits the time resolution to the order of a frame per minute. Reference Parkinson, Novotny, Argentero, Schmid, Pavelec, Kosak, Blaha and Diebold18 Moreover, highly resistive materials, such as wide-bandgap oxides that serve as commercial catalyst supports, are unsuitable for STM characterization.
STEM provides an alternative route to overcome these challenges and observe single-atom dynamics on both conductive and insulating surfaces with improved time resolution. In fact, some of the initial observations of atom diffusion on surfaces were made in the 1970s using an early STEM instrument at the University of Chicago by Isaacson and co-workers, who reported the diffusion behavior of heavy uranium and silver atoms on a carbon support. Reference Isaacson, Langmore, Parker, Kopf and Utlaut20,Reference Isaacson, Kopf, Utlaut, Parker and Crewe21 With aberration-correction, it is now possible to image the dynamics of single gold atoms, their dimers, and nanoparticles with 0.2 s exposures. Reference Batson22 Batson has shown that Au clusters exhibit very different dynamic behavior under the beam, depending on their size, Reference Batson22 using time-sequential STEM ADF imaging. While single Au atoms prefer to form dimers and multi-atom clusters, 1-nm-size clusters tend to break up into smaller ones. Clusters larger than 2 nm were observed to be stable against dissolution, but exhibited changes in orientation. In the future, such experiments can be performed on other noble metal systems to understand their tendency to either coalesce into larger clusters or dissolve into smaller particles along with the atomic-scale mechanisms. Such studies may provide insights to achieve higher catalytic activity by improving the dispersion of the noble element atoms. Sequential STEM ADF images have also revealed dynamic fluctuation of surface atoms in CdSe nanocrystals, which when combined with DFT calculations, show a continuously varying bandgap that can be attributed to the emission of white light from the nanocrystals. Reference Pennycook, McBride, Rosenthal, Pennycook and Pantelides23
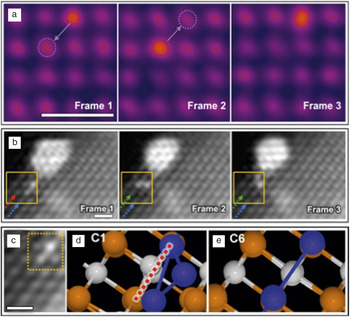
More recently, sequential STEM ADF imaging has been used to demonstrate the dynamic behavior of catalytically active Ir atoms and clusters on the surface of MgO (an industrial support for catalysts) with sub-second temporal resolution; see Figure 1 . Reference Han, Iddir, Uzun, Curtiss, Browning, Gates and Ortalan24 The movement of a single Ir atom on the MgO (100) surface under an electron beam is shown in Figure 1a. The heavy Ir atom (Z is 77) appears brighter in the Z-contrast image, wherein the intensity is roughly proportional to Z Reference Kim, Duscher, Browning, Sohlberg, Pantelides and Pennycook2 . Along the (100) orientation of MgO, which has a rock salt structure, alternating atomic columns are terminated with Mg and O atoms. In the time series, an Ir atom can be observed to hop back and forth diagonally, which suggested that Ir prefers to bind to either Mg or O. When combined with the binding energy obtained using DFT calculations, it could be confirmed that Ir prefers binding to O, and therefore, sits directly above it rather than at either the Mg-site or the interstitial site between Mg and O. The migration of a tri-iridium cluster (Ir3) through a rotational motion over MgO(110) to eventually sinter with a larger iridium cluster was also reported in the same article Reference Han, Iddir, Uzun, Curtiss, Browning, Gates and Ortalan24 and is shown in Figure 1b. Here, two Ir atoms were observed to be stacked on top of an Mg column with the third Ir atom rotating around the stacked atoms. By comparing the binding energy of different Ir3 configurations on MgO calculated using DFT, the authors showed that the configuration observed in the STEM images is most likely due to a time averaging of two configurations with a low barrier that results in a high-frequency conformation change (Figure 1c–e). Their work shows how combinations of STEM sequential imaging and DFT calculations can provide crucial insights about processes that are beyond the current temporal resolution of the STEM, but could have an important effect on the material functionality such as catalytic or sensory activity.
Atom dynamics on surfaces. Sequential Z-contrast scanning transmission electron microscope images of (a) a single Ir adatom on a MgO(001) surface showing diagonal hops and (b) rotational migration of an Ir3 cluster on a MgO(110) surface. (c) Direct comparison of experimentally observed configurations of an Ir3 cluster on MgO with (d–e) two theoretically predicted configurations. The red dashed line in (d) shows the axis about which the cluster oscillates at a high frequency. (a–c) Scale bars = 0.5 nm. Adapted with permission from Reference Han, Iddir, Uzun, Curtiss, Browning, Gates and OrtalanReference 24. © 2015 American Chemical Society.

Atom dynamics in 2D materials
Two-dimensional materials, such as graphene and transition-metal dichalcogenides, exhibit novel properties due to the confinement of electrons, and are currently one of the most extensively studied classes of materials. The use of electrons with low primary energies (30–120 keV) below the knock-on damage threshold of atoms in 2D materials has made aberration-corrected transmission electron microscopy (both STEM and conventional TEM) a powerful technique to characterize the structure and dynamics of 2D materials at the atomic scale. Reference Krivanek, Zhou, Chisholm, Idrobo, Lovejoy, Ramasse, Dellby, Bell and Erdman25,Reference Krivanek, Chisholm, Nicolosi, Pennycook, Corbin, Dellby, Murfitt, Own, Szilagyi, Oxley, Pantelides and Pennycook26
TEM experiments have revealed the dynamics of carbon atoms on the edge of a hole in a graphene sheet, which results in an oscillation between the armchair and zigzag edge reconstructions. Reference Girit, Meyer, Erni, Rossell, Kisielowski, Yang, Park, Crommie, Cohen, Louie and Zettl27 The migration of grain boundaries in graphene has been characterized by optimizing the TEM acceleration voltage to simulate high-temperature events. Reference Kurasch, Kotakoski, Lehtinen, Skakalova, Smet, Krill, Krasheninnikov and Kaiser28 While the boundary between two large graphene grains showed only small fluctuations due to bond rotations, curved grain boundaries around smaller grains were observed to disappear with time, resulting in a pristine lattice by minimizing the grain boundary energy—a classical observation of grain growth including snapshots of atom migrations involved in the process.
TEM experiments have also shown dynamic filling of vacancies in 2D materials by impurity atoms or self interstitials. Reference Komsa, Kurasch, Lehtinen, Kaiser and Krasheninnikov29–Reference Komsa, Kotakoski, Kurasch, Lehtinen, Kaiser and Krasheninnikov31 For example, S vacancies in MoS2 were observed to be filled by impurity atoms during the acquisition of a sequence of TEM images. Reference Komsa, Kotakoski, Kurasch, Lehtinen, Kaiser and Krasheninnikov31 This opened up the prospect of changing the functionality of MoS2 by doping with impurity atoms, for instance, with Mn, to obtain 2D dilute magnetic semiconductors. Reference Mishra, Zhou, Pennycook, Pantelides and Idrobo32 Other TEM investigations have revealed the dynamics of point defect clusters such as a Fe dimer Reference He, He, Robertson, Kirkland, Kim, Ihm, Yoon, Lee and Warner33 and tetravacancy Reference Robertson, Lee, He, Yoon, Kirkland and Warner34 in graphene.
More recently, in situ heating experiments in a TEM have made it possible to untangle thermally driven dynamical processes from those induced by the electron beam. Reference Chen, He, Robertson, Kirkland and Warner35,Reference Gong, Robertson, He, Lee, Yoon, Allen, Kirkland and Warner36 As an example, dislocations in graphene were observed to be more mobile at 800°C compared to their beam-induced motion at room temperature. Reference Gong, Robertson, He, Lee, Yoon, Allen, Kirkland and Warner36 Furthermore, at the elevated temperature, the dislocation motion also involved complex metastable defects as intermediate structures that were not observed at room temperature. Such experiments offer the prospect of directly obtaining activation barriers and diffusivity by monitoring the motion of atoms as a function of different temperatures, rather than relying solely on DFT calculations where the quantitative accuracy of the predicted barriers is known to suffer from the use of approximate exchange-correlation functionals. Reference Freysoldt, Grabowski, Hickel, Neugebauer, Kresse, Janotti and Van de Walle37
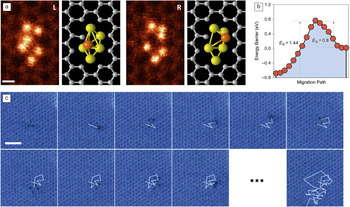
Concurrently, STEM experiments have provided novel insights into the dynamic behavior of atoms in 2D materials. For example, the dynamic behavior of a Si6 cluster trapped in a graphene nanopore was demonstrated using time-sequential ADF imaging in a STEM operating at a low acceleration voltage of 60 keV. Reference Lee, Zhou, Pennycook, Idrobo and Pantelides38 During the image acquisition, the Si6 cluster was repeatedly observed to oscillate between two configurations with a single Si atom changing its position, as shown in Figure 2a. Based on DFT calculations, the right configuration was found to be metastable with respect to the left and the Si atom had to overcome a smaller barrier of 0.8 eV to move to the left compared to a 1.44 eV barrier required to move from left to the right (Figure 2b). Using Boltzmann statistics, the change from the stable to the metastable configuration can be expected to take ∼1011 s at room temperature. However, due to the momentum transfer from the electron beam, it was possible to sample the higher-energy metastable landscapes without destroying the cluster.
Atom dynamics in 2D materials. (a) Selected frames from a sequence of scanning transmission electron microscope annular dark-field (STEM ADF) images showing the dynamics of a Si6 nanocluster trapped in a graphene pore with the 3D structure obtained from density functional theory calculations. The highlighted orange Si atom jumped repeatedly from left to right during the image sequence. Scale bar = 0.2 nm. Reference Lee, Zhou, Pennycook, Idrobo and Pantelides38 (b) Calculated energy barriers (E B) for the conformational transformation (left-hand side of the plot corresponds to the left image). (c) Ten consecutive frames and the final frame (57) from a sequence of STEM ADF images showing the random walk of a graphene divacancy. Scale bar = 1 nm. Reprinted with permission from Reference Kotakoski, Mangler and MeyerReference 39. © 2014 Macmillan Publishers Ltd.

The momentum transfer from the STEM probe has also been used to stimulate and follow the migration of a divacancy in graphene, as shown in Figure 2c. Reference Kotakoski, Mangler and Meyer39 Based on the root-mean-square distance traveled by the divacancy and the number of jumps obtained by monitoring its trajectory during an extended time period of several minutes, the divacancy motion could be categorized as a random walk at the atomic scale. The dynamics of impurity atoms in 2D materials have also been characterized using sequential STEM imaging. Susi et al. reported the beam-induced motion of threefold-coordinated Si dopants in graphene. Reference Susi, Kotakoski, Kepaptsoglou, Mangler, Lovejoy, Krivanek, Zan, Bangert, Ayala, Meyer and Ramasse40 By combining the STEM observations with first-principles molecular dynamics simulations, they attributed the dynamic motion of the Si atoms to the momentum transfer from the electron beam to a neighboring carbon atom, which resulted in a direct exchange of the Si and C atoms. In a recent study, sequential STEM ADF imaging was used to study the dynamic motion of Pt impurity atoms in MoS2, where the Pt atoms were observed to hop between S vacancy sites. Reference Li, Wang, Sawada, Han, Samuels, Allen, Kirkland, Grossman and Warner41
Compared to the plane-wave and stationary illumination in a TEM, the use of a focused electron probe that is rastered across the specimen in STEM offers several advantages, including the direct determination of atoms by using the contrast in an ADF image and simultaneous acquisition of spectroscopy signals that contain the information about the electronic structure of the atom. Reference Pennycook and Nellist42,Reference Pennycook43 Of further relevance for the dynamic study of 2D materials is that the STEM probe can be used to controllably impart energy and momentum to specific atoms and manipulate their position. Lin et al. have demonstrated formation of metallic nanowires that are less than a nanometer in width by controllable irradiation of 2D transition metal dichalcogenides using the STEM probe. Reference Lin, Cretu, Zhou, Suenaga, Prasai, Bolotin, Cuong, Otani, Okada, Lupini, Idrobo, Caudel, Burger, Ghimire, Yan, Mandrus, Pennycook and Pantelides44 Susi et al., following up on their earlier work, Reference Susi, Kotakoski, Kepaptsoglou, Mangler, Lovejoy, Krivanek, Zan, Bangert, Ayala, Meyer and Ramasse40 have demonstrated with some success the ability to move threefold-coordinated Si atoms in graphene in a desired direction by controllably positioning the electron probe on specific neighboring C atoms around Si. Reference Susi, Meyer and Kotakoski45 These studies open up an exciting frontier of both imaging and manipulating atoms using the STEM.
Atom diffusion in bulk materials
The diffusion of dopant atoms in bulk materials governs heat-treatment processes, creep resistance, and fatigue strength of structural materials, as well as the efficiency of ionic conductors, such as fuel cells and batteries, and the lifetime of semiconductor devices. Interfaces, grain boundaries, dislocations, and complex defects are known to result in complex diffusion mechanisms that have a strong effect on the dopant diffusivity but are often difficult to model computationally. In recent years, time-sequential STEM ADF imaging has provided fundamental insights into the diffusion behavior of atoms in bulk materials, Reference Ishikawa, Mishra, Lupini, Findlay, Taniguchi, Pantelides and Pennycook46 nanowires, Reference Oh, van Benthem, Molina, Borisevich, Luo, Werner, Zakharov, Kumar, Pantelides and Pennycook47 and more recently, at grain boundaries Reference Bowers, Ophus, Gautam, Lancon and Dahmen48,Reference Peter, Liebscher, Kirchlechner and Dehm49 and dislocations. Reference Li, Zhang, Pennycook, Wu, Lupini, Paudel, Pantelides, Yan and Pennycook50
Oh et al. reported, in 2008, their initial observations of gold atoms in silicon nanowires changing their position between substitutional and various interstitial sites in successive STEM images. Reference Oh, van Benthem, Molina, Borisevich, Luo, Werner, Zakharov, Kumar, Pantelides and Pennycook47 That work set the stage for future identification of the diffusion pathway of single dopants inside materials under appropriate combinations of STEM operation conditions and activation barriers for dopants. Ishikawa et al. demonstrated the diffusion of Ce and Mn single dopants inside w-AlN crystals with the wurtzite structure, as shown in Figure 3 . Reference Ishikawa, Mishra, Lupini, Findlay, Taniguchi, Pantelides and Pennycook46 In an aberration-corrected STEM operating at 200 kV, Ce dopants substituted for Al atoms (CeAl) were observed to move to predominantly different CeAl sites in AlN, with a jump in every ∼3 frames acquired with a frame time of 4 s and a dose of ∼7.5 × 10⁴ e/Å2. An important observation in this work was the correlated motion of CeAl, rattling back and forth between two neighboring Al sites, which suggest that the diffusion is mediated by Al vacancies (the dopant can easily return to its previous location if the Al vacancy remains unfilled).
Single Ce atom diffusion within wurtzite-structured aluminum nitride (w-AlN). (a–g) Selected frames from a sequence of scanning transmission electron microscope annular dark-field images of a w-AlN single crystal doped with Ce viewed along the
 $\left[ {11\bar 20} \right]$
axis. Single Ce atom locations are marked by white arrowheads in each panel and the observed Ce trace as a function of time is overlaid in (h). Scale bar = 0.3 nm.
Reference Ishikawa, Mishra, Lupini, Findlay, Taniguchi, Pantelides and Pennycook46

These observations were confirmed by DFT calculations that point toward the presence of a large concentration of Al vacancies, due to their low formation energy, in this material. Moreover, the calculated activation energy for CeAl diffusion to an Al vacancy was found to be small, with barriers of 0.3–0.6 eV, which correlated well with the large number of Ce jumps observed in the experiments. The small diffusion barrier for the relatively large, heavy, Ce atoms was attributed to the high compressive strain induced by the small host lattice. Further DFT calculations predicted an increase in the barrier, and consequently, fewer atomic jumps, for a smaller dopant atom such as Mn, in the same matrix. Subsequent sequential STEM imaging of Mn-doped AlN confirmed the theoretical prediction, as the Mn dopants were observed to be much more stable (fewer jumps) under similar beam conditions.
Occasionally, Ce atoms were observed to temporarily occupy interstitial sites, which were attributed to an interstitial kick-out mechanism in which a Ce substitutional atom removes an adjacent Al interstitial. The activation barrier for such a kick-out mechanism was determined to be 3.1 eV using DFT calculations. The observation of such a high-energy diffusion mechanism activated by the electron beam demonstrated the capability to study processes that can play an active role at higher temperatures, such as during creep. The strong correlation between the theoretically predicted activation barrier and the experimentally observed jump frequency for two different dopants highlight that in future, it should be possible to experimentally measure the activation energy by varying the acceleration voltage or the temperature of the sample.
Li et al. have recently used sequential STEM imaging to reveal the dynamics of dislocations in CdTe, Reference Li, Zhang, Pennycook, Wu, Lupini, Paudel, Pantelides, Yan and Pennycook50 a promising absorber material for solar cells where dislocations are known to result in localized states and affect the efficiency of the solar cells. Reference Li, Wu, Pennycook, Lupini, Leonard, Yin, Paudel, Al-Jassim, Yan and Pennycook51 Shockley partial dislocations with Cd-cores were observed to be more mobile than Te-core partials. Similarly, Shockley partial dislocations having unpaired atomic columns with dangling bonds in the core were observed to be more mobile compared to those without. Bowers et al. used sequential STEM imaging to demonstrate the dynamics of atoms at an incommensurate grain boundary in Au, wherein a collective motion of atoms leads to the coalescence of two interfacial steps. Reference Bowers, Ophus, Gautam, Lancon and Dahmen48 The migration of Ag atoms at an asymmetric Cu grain boundary has been reported along with an analysis of the effect of different imaging conditions. Reference Peter, Liebscher, Kirchlechner and Dehm49 These reports highlight the power of combining sequential STEM imaging with atomistic simulations to resolve complex dynamical processes that are known to play a key role in affecting material properties, but until recently, their direct observation had not been possible experimentally.
Atomic-scale tracking of phase transitions
Diffusive phase transformations play a critical role in the structure and performance of materials. For instance, ionic conductivity of different oxygen-deficient phases in transition-metal perovskites can be significantly different, which affects the performance of solid-oxide fuel cells (SOFCs). In Li-ion batteries, the continuous cycling of Li-ions in the cathode material during charge and discharge cycles can lead to new phases in the cathode, with different compositions that affect the diffusivity of lithium. Commonly, SOFC and Li-ion battery materials have complex chemical compositions with multiple elements, which results in several competing phases. This necessitates direct probing of their atomic structure and dynamics to reveal the atomic mechanisms for the phase transformations in order to improve the efficiency and lifetime of such devices.
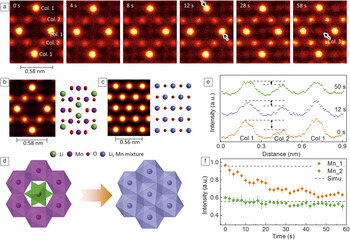
Recently, sequential STEM imaging studies have started providing important insights into such diffusional phase transformations by allowing direct atomic-scale tracking of elements. Reference Su, Wang, Ma and Jiang16, Reference Gao, Ishikawa, Tochigi, Kumamoto, Shibata and Ikuhara52–Reference Yao, Majumdar, Akaslompolo, Inkinen, Qin and van Dijken55 Gao et al. recently demonstrated the atomic-scale pathway for the transition of a battery material LiMn2O4−δ from its spinel to rock-salt phase using sequential STEM imaging. Reference Gao, Ishikawa, Tochigi, Kumamoto, Shibata and Ikuhara52 They showed that the electron-beam-induced phase transition involved a correlated movement of the Li and Mn cations with only a small distortion of the anion sublattice as shown in the time-sequential images in Figure 4a, where a new site of “Col. 3” appears and the intensity at the site increases as a function of time, as marked by arrow in the far right panel. In the spinel structure, the Li ions are tetrahedrally coordinated (Litet) while the Mn ions occupy octahedral sites (Mnoct) (Figure 4b). In the rock-salt phase, both Li(Lioct) and Mn(Mnoct) ions occupy octahedral sites (Figure 4c). During sequential STEM imaging, the lighter Li ions were observed to migrate from Litet sites to the empty face-shared octahedral sites in the spinel phase. Concurrently, the heavier Mn ions were also observed to migrate to edge-shared empty octahedral sites, passing through a tetrahedral interstitial site. The cation migrations were accompanied by small shifts of oxygen atoms to a higher symmetry position. The phase transition of spinel to rock salt, as shown schematically in Figure 4d, also resulted in a phase boundary of approximately ∼1–3 unit cells that involved a disordered arrangement of Li and Mn ions occupying different tetrahedral and octahedral sites along with cation vacancies. Direct observation of such complex diffusion behavior may lead to strategies to either accelerate or inhibit phase transitions to promote Li-diffusivity such as by introducing oxygen vacancies or cations with different size and charges.
Phase transition of LiMn2O4–δ induced by electron-beam irradiation. (a) Selected sequential Z-contrast scanning transmission electron microscope (STEM) images of LiMn2O4-δ viewed along the [110]spinel direction. Simulated Z-contrast STEM images and structure models of (b) spinel LiMn2O4 and (c) rock salt LiMnO2, respectively. (d) Schematic view of phase transition from spinel to rock-salt structures. (e) Selected Z-contrast intensity profiles along the direction of columns 1–2–1 indicated by black arrows in (a). (f) Z-contrast intensity evolution at Mn columns of 1 or 2 are plotted as a function of time and the simulated Z-contrast intensities are given by dotted lines. Reference Gao, Ishikawa, Tochigi, Kumamoto, Shibata and Ikuhara52

In another class of compounds, with a large concentration of oxygen vacancies and attractive for oxygen ion conductors, sequential STEM imaging has been used to study phase transitions involving the dynamic behavior of oxygen vacancies as opposed to cations in the Li-ion compounds. Reference Jang, Kim, He, Mishra, Qiao, Biegalski, Lupini, Pantelides, Pennycook, Kalinin and Borisevich54,Reference Yao, Majumdar, Akaslompolo, Inkinen, Qin and van Dijken55 For example, in LaCoO3−δ perovskites, disordered oxygen vacancies have been observed to order into alternate Co-planes on exposure to the electron beam, which results in the formation of the brownmillerite phase with alternating layers of CoO6 octahedra and CoO4 tetrahedra. The ordering of oxygen vacancies is accompanied by small changes in the octahedral and tetrahedral connectivity and lattice spacings. Reference Jang, Kim, He, Mishra, Qiao, Biegalski, Lupini, Pantelides, Pennycook, Kalinin and Borisevich54 Pennycook et al. have applied sequential STEM imaging to demonstrate the atomic mechanisms involved during the controlled reduction of Mn3O4 to MnO under an electron beam. Reference Pennycook, Jones, Pettersson, Coelho, Canavan, Mendoza-Sanchez, Nicolosi and Nellist56 These early reports underscore the knowledge gained by sequential STEM imaging to controllably induce a variety of diffusional phase transformations and study their atomic mechanisms.
Future developments
We have shown how sequential STEM imaging offers unprecedented insights into the dynamic behavior of single atoms on the surface and inside materials. In the near future, this technique is well positioned to extensively benefit from ongoing instrumental developments in aberration correctors, STEM probes, scanning techniques and new methods for image processing and acquisition.
The development of aberration correctors that allow increase of the illumination angle of the STEM probe, by correcting higher order aberrations, will lead to improvements in the depth resolution of the microscope. Reference Sawada, Shimura, Hosokawa, Shibata and Ikuhara57–Reference Ishikawa, Lupini, Hinuma and Pennycook59 Such developments should facilitate tracking single dopant atoms in three dimensions—the ultimate in solid-state diffusion imaging. Controlling the position of the beam to a specific unit cell within a given atomic column will allow controlled energy and momentum transfer to specific atoms. Combining this control with optimization of the microscope accelerating voltage and dose rate may allow specific mechanisms to be selectively excited. New scanning techniques, such as spiral scans that allow acquisition of images at faster rates by decreasing the scan flyback times (the interval for the scanning probe to return to the starting point of the next line after scanning the previous one), Reference Sang, Lupini, Unocic, Chi, Borisevich, Kalinin, Endeve, Archibald and Jesse60 will lead to improvements in the temporal resolution in sequential imaging allowing us to observe fast processes with low energy barriers (<0.5 eV).
In the future, dynamic control over the beam position may enable atoms to be directed to specific sites inside materials. Reference Kalinin, Borisevich and Jesse5 Such a development could allow the fabrication or optimization of novel materials from the single atom level. New image processing and acquisition algorithms that can denoise images Reference Furnival, Leary and Midgley61 or allow faster acquisition based on compressive sensing, Reference Stevens, Yang, Carin, Arslan and Browning62 will further improve the temporal resolution. Alternatively, by reducing the beam current, such algorithms will allow the study of dynamics in beam-sensitive materials and potentially allow control over atom dynamics that are dominated by inelastic energy transfer. The combination of temperature (either heating or cooling) with the image processing and acquisition algorithms should allow more complicated mechanisms to be untangled. Reference Chen, He, Robertson, Kirkland and Warner35,Reference Gong, Robertson, He, Lee, Yoon, Allen, Kirkland and Warner36 The introduction of different chemical vapors should allow deliberate fabrication of materials with varying chemical composition. Reference Sang, Xie, Lin, Alhabeb, Van Aken, Gogotsi, Kent, Xiao and Unocic63
Summary
We have shown how aberration-corrected STEM can be used to reveal the dynamics of single dopant atoms inside materials, allowing direct imaging of technologically important solid-state diffusion processes. The cases most suited to this form of analysis consist of single heavy dopant atoms inside a lighter matrix, although it has also been shown that such techniques can be applied to track changes of lighter lithium atoms in lithium-based battery materials and vacancies in oxide-based materials. The results are important both for the extension of classical diffusion studies to the single-atom level, as well as to enable the development of new microscopy techniques. The key advantage of transmission electron microscopy is the sensitivity to behavior inside a thin piece of material rather than just on the surface or in a 2D material. In these cases, high-angle ADF imaging offers a unique sensitivity to single heavy dopants. Reference Pennycook and Jesson64,Reference Pennycook and Jesson65 Combined with other developments, such as improved aberration correctors or higher-sensitivity imaging, this may allow the study of defects in three dimensions and potentially the direct imaging of individual vacancies in motion. Reference Kim, Zhang, Raghavan and Stemmer66
It is significant that the electron beam can be used both to excite and to monitor these processes at, or near, the atomic scale. More precise control could allow specific effects to be excited and perhaps allow control of materials design from the single-atom scale-up.
Acknowledgments
The authors are grateful to the collaborators that made the work presented and cited here, in particular, S.T. Pantelides, A.Y. Borisevich, P. Gao, N. Shibata, and Y. Ikuhara. R.M. acknowledges financial support through the National Science Foundation (Grant No. DMREF-1729787). Research at Oak Ridge National Laboratory was supported by the Division of Materials Sciences and Engineering, Office of Basic Energy Sciences. S.J.P. is grateful to the National University of Singapore for funding.

Rohan Mishra is an assistant professor of Mechanical Engineering and Materials Science at Washington University in St. Louis. He received his PhD degree in materials science and engineering from The Ohio State University in 2012. He was a postdoctoral researcher in the STEM Group at Oak Ridge National Laboratory with a joint appointment from Vanderbilt University (2012–2015). His research focuses on the rational design of materials for energy applications using a synergistic combination of electronic-structure calculations and scanning transmission electron microscopy. Mishra can be reached by phone at 314-935-5585 or by email at rmishra@wustl.edu.

Ryo Ishikawa is an assistant professor in the Institute of Engineering Innovation at The University of Tokyo, Japan. He received his PhD degree in materials science from The University of Tokyo in 2011. He is currently interested in three-dimensional atomic-resolution imaging in scanning transmission electron microscopy. Ishikawa can be reached by phone at +81-3-5841-7723 or by email at ishikawa@sigma.t.u-tokyo.ac.jp.

Andrew R. Lupini is a staff member in the Materials Science and Technology Division at Oak Ridge National Laboratory. He received his PhD degree in physics from the University of Cambridge, UK, in 2001. He was one of the developers of the first aberration corrector to achieve an improved resolution in scanning transmission electron microscopy (STEM), and is the author of more than 100 papers. His current research interests include pushing monochromated STEM to atomic resolution, single-atom electron energy-loss spectroscopy and analysis, and interpretation of large multidimensional image sets. Lupini can be reached by phone at 865-387-0288 or by email at arl1000@ornl.gov.

Stephen J. Pennycook is a professor in the Department of Materials Science and Engineering, National University of Singapore, an adjunct professor at The University of Tennessee, and adjoint professor at Vanderbilt University. Previously, he was Corporate Fellow in the Materials Science and Technology Division of Oak Ridge National Laboratory and leader of the Scanning Transmission Electron Microscopy Group. He completed his PhD degree in physics at the Cavendish Laboratory, University of Cambridge, UK, in 1978. Since then, he has been actively pursuing the development and materials applications of atomic resolution Z-contrast microscopy and electron energy-loss spectroscopy. Pennycook is a Fellow of the Materials Research Society, the American Physical Society, the American Association for the Advancement of Science, the Microscopy Society of America, and the Institute of Physics. He has received the Microbeam Analysis Society Heinrich Award, the Materials Research Society Medal, the Institute of Physics Thomas J. Young Medal and Award, and the Materials Research Society Innovation in Materials Characterization Award. He has published 38 books and book chapters, and more than 500 papers and 250 invited presentations. His latest book is Scanning Transmission Electron Microscopy. Pennycook can be reached by phone at +(65) 6516-5193 or by email at steve.pennycook@nus.edu.sg or msepsj@nus.edu.sg.