I. INTRODUCTION
Supercapacitors (SCs), as an important next generation energy storage device, have recently attracted extensive interest. Reference Stoller and Ruoff1–Reference Yan, Wang, Wei and Fan3 It is generally accepted that electrode materials are one of dominating factors that influence the capacitive performance of SCs. Reference Simon and Gogotsi4 Among various electrode materials, carbon electrode materials represent today more than 80% of the commercially manufactured SCs Reference Chen, Ramachandran, Mani and Saraswathi5 and are considered as the most promising materials for future capacitors with excellent performances.
At the same time, the disadvantages of carbon-based SC, including unstable power density at high current density, have been recognized as major challenges for the furtherance of SC technologies. Reference Jiang, Lee and Li6 So, over the years, significant efforts have been devoted to research the energy storage mechanism of carbon electrode materials and achieved some subversive conclusions.
To overcome the obstacle of unstable power density at high current density, the most intensive approach is the building of hierarchical interpenetrating structures. For the mesoporous structures, especially the mesopores with sizes of 2–5 nm, Reference Chmiola, Yushin, Gogotsi, Portet, Simon and Taberna7 numerous studies have already demonstrated that “ion-transferring channels” were formed in the mesopores, which facilitated the ultrafast ion transport during the charge/discharge process. Therefore, the extensive of mesopores resulted in better capability for high-drain-rate operations and led to a good power-output characteristic.
To improve energy density of the carbon-based SCs, one of the most direct ways is to achieve a high specific capacitance which generally results from the combination of electrical double-layer capacitance (C EDL) and pseudocapacitance. From the equation of C EDL (C = εA/d, where ε is the dielectric constant of electrolyte, A is the surface area of electrode, and d is the charge separation distance), we can easily find that large surface area contributes to a high C EDL. As we all know that micropores are the major contributor to the specific surface area of porous carbons, generating more micropores is an efficient approach to getting a high C EDL. Furthermore, Gogotsi and co-workers Reference Chmiola, Yushin, Gogotsi, Portet, Simon and Taberna7,Reference Largeot, Portet, Chmiola, Taberna, Gogotsi and Simon8 have given an answer to the basic question: what is the best pore size to achieve the highest capacitance for C EDL by researching micropores less than 1 nm. Their results revealed that an anomalous capacitance increase was observed as the decrease of micropore size in carbon occurs, which is owing to the desolvation effect when the solvated ions got into the narrow pores (smaller than the size of solvated ions) during the charge process, and that the micropores with a width close to the size of ions are most efficient in a double-layer formation, leading to a maximum C EDL. Therefore, micropores are necessary for a high energy density and proper control over micropore size matching the electrolyte ions is more significant to getting a high C EDL rather than just going after the quantity of the specific surface area. Meanwhile, the pseudocapacitance due to the presence of electrochemically active sites such as doped heteroatoms (e.g., N, O and S) and redox couples (hydroquinone (HQ)/benzoquinone) can be coupled with the C EDL to enhance the overall capacitance of electrode materials, thus increasing the energy density. Reference Zhong, Kim, McGann, Chun, Whitacre, Jaroniec, Matyjaszewski and Kowalewski9–Reference Singh and Paul11 These electrochemically active sites can not only act as efficient active sites in faradaic reactions, but also make the carbon surface more hydrophilic, leading to effective diffusion of aqueous electrolyte into the inner pores of the carbons.
Over the years, various carbons such as activated carbons, carbon fibers, carbon aerogels, template porous carbons, carbon cloth, and graphene have been widely investigated as electrode materials for SCs. Among these carbons, petroleum coke-based activated carbons (PCACs) prepared by alkali activation have attracted great interests in SCs due to their relatively low cost, high surface area, stable physicochemical properties, relatively good electrical properties, and hydrophilic surface functional groups. Reference Jiang, Lee and Li6 Unfortunately, there are still more or less defects in PCACs reported previously in terms of energy and power density at high current densities. So, it is a huge challenge to design and fabricate a nanostructured PCAC material, combining all structural merits (optimized combination of mesopores, micropores, heteroatoms-doping, and redox couples) for high performance SCs, and to give a clear and proper model for this kind of activated carbons. In the present work, a new insight into the design of a functionalized PCAC for SC with both high power and energy densities is provided. Firstly, KOH activation was used to prepare a series of PCACs with more micropores less than 1 nm and abundant mesopores between 2 and 5 nm, leading to the large surface area and hierarchical porous structure. Secondly, HQ which can provide redox couples during electrochemical reaction in the electrolyte Reference Singh and Paul11 was physisorbed on the PCAC by simply stirring the mixture of HQ solution and the carbon. In this functionalized PCAC, the mesopores and micropores acted as the “ion-transferring channels” and “ion-adsorption sites” respectively. On the other hand, both heteroatom functional groups and redox couples could act as “faradaic reaction sites”. Therefore, this unique functionalized PCAC can be an ideal candidate to afford both high power and energy density especially at high current densities.
II. EXPERIMENTAL
A. Preparation of PCAC
PCACs were prepared according to the following procedure: the petroleum coke (PC; Shengli Refinery of Qilu Petrochemical Company, Zibo, China) was agitated vigorously with KOH at different weight ratios (KOH:PC = 1, 2, 3, 4 or 5) and heated under N2 flow at a rate of 5 °C/min up to the temperature 800 °C, then held for 2 h. These PCACs were washed to neutral by pure water for several times and dried in a vacuum oven at 80 °C for 12 h to get dry samples. The samples were cooled down to the room temperature by natural cooling-off process. These samples were denoted as PCAC-X where X (X = 1, 2, 3, 4 or 5) stands for the KOH:PC weight ratio.
B. Preparation of functionalized activated carbon
For the preparation of functionalized activated carbon which was modified by HQ, HQ (0.025 g) was dissolved in ethanol (10 mL) under stirring for 2 h to obtain a solution. Then, the as-synthesized PCAC-4 (0.1 g) was transferred into the solution and mixed under sonication for 5 min. Subsequently, the mixture was subjected to continuous magnetic stirring at a constant temperature (25 °C) for 5 h. After that, the resultant was collected by vacuum filtration and dried at 60 °C for overnight. The as-prepared sample was termed as HQ/PCAC-4.
C. Material characterizations
The microscopic morphologies of the as-synthesized samples were observed using field emission scanning electron microscopy (SEM; FEI Sirion 200 FEI Company, Hillsboro, Oregon) and transmission electron microscopy (TEM; JEM-2100, JEOL Ltd., Tokyo, Japan) techniques. Nitrogen adsorption–desorption isotherms were measured at 77 K on Tristar 3000 analyzer (Micromeritics, Norcross, Georgia). The specific surface area (S BET) of the samples was calculated by the multipoint Brunauer–Emmett–Teller (BET) method from the adsorption data in the relative pressure (P/P 0) range between 0.06 and 0.3. The total micropore volume (V 0) was deduced by the t-plot method, and the total pore volume (V t) was estimated from the adsorbed amount of liquid nitrogen at a relative pressure of 0.99. The pore size distribution was calculated by using the Horvath–Kawa model. An elemental analyzer (ANTEK 9000, ANTEK, Houston, Texas) was used to analyze the elemental composition of the synthesized samples.
D. Electrode fabrication and electrochemical measurement
For electrochemical measurements, PCACs or HQ/PCAC-4 and poly(tetrafluoroethylene) as a binder at a weight ratio of 95:5 were smeared onto Ni foam (for tests in KOH electrolyte) or Pt mesh (for tests in H2SO4 electrolyte) and pressed at 100 kg/cm2 as working electrodes. Before electrochemical measurements, the electrodes were vacuum impregnated with 3 M KOH or 1 M H2SO4 electrolyte for 15 min to guarantee that the active materials were thoroughly wetted by the electrolyte. The electrochemical capacitive performances of samples were investigated on a CHI660D electrochemical workstation. The electrochemical characteristics including cyclic voltammetry (CV), galvanostatic charge–discharge (GCD) and electrochemical impedance spectroscopy (EIS) were conducted in a three-electrode cell using a platinum film as a counter electrode and a saturated calomel electrode (SCE) as a reference electrode. A potential window of −1 to 0 V (in KOH electrolyte) or 0–1 V (in H2SO4 electrolyte) versus SCE reference electrode was applied to the electrochemical measurements. The EIS measurements were performed over a frequency range from 0.01 Hz to 100 kHz with 5 mV ac amplitude. The specific gravimetric capacitances were calculated by using the following equations: C g = IΔt/(mΔV), where C g is the specific gravimetric capacitance (F/g), I is the discharge current, Δt is the time spent for a full discharge, m is the mass of the active material contained in one electrode, and ΔV is the voltage change during a full discharge. From the discharge curve measured with the two-electrode system, the energy density (E) and power density (P) in the Ragone plots were calculated as follows: E = (1/2)C TΔV 2 and P = E/Δt, respectively, where C T, ∆t, ∆V, are the total specific capacitance of the SC cell (F/g), the discharge time (s), the potential window of discharge (V), respectively.
III. RESULTS AND DISCUSSION
A. Morphology and structure of PCACs
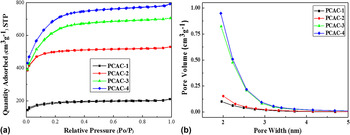
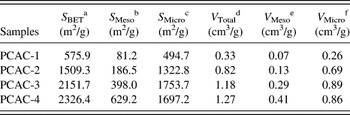
According to IUPAC classification, the isotherms of all samples showed a shape of type I [Fig. 1(a)], which is an indicative of the microporous character. The nitrogen uptake at low relative pressure (P/P 0 < 0.02) increased sharply with the rise of KOH/PC weight ratio, suggesting that more micropores were generated at higher KOH dosage. Reference Wu, Sun, Tan, Yang, Feng and Müllen12 Table I shows the pore-structure parameters of these carbons. The KOH activation had marked effects on the porosity parameters of the PCACs. The BET surface area of the PCAC-4 reached as high as 2326.4 m2/g. When KOH/PC mass ratio was less than 3, the BET surface areas of PCACs increased mainly due to the generation of micropores. At high KOH dosage (KOH/PC mass ratio ≥ 3), the mesopore surface areas increased drastically, while the micropore surface area decreased, indicating that overusing KOH could result in the collapse of micropores and formation of small mesopores. Reference Xing, Huang, Zhuo, Yuan, Wang, Hulicova-Jurcakova, Yan and Lu13 This phenomenon could also be observed in Table S1 (Supplementary Material). Figure 1(b) shows the pore size distribution of PCACs, which was calculated from the desorption isotherms. All of samples presented predominant micropores due to the sharp increase of pore size distribution curves as approaching the micropore size range (<2 nm). With the increase of KOH/PC weight ratio, PACA-3 and PACA-4 exhibited a complex pore system consisting of not only the micropores (<2 nm) but also a large amount of mesopores in a range of 2–4 nm, indicating that overusing KOH could generate a hierarchical micro–meso porous structure. The large surface area and developed pore structure were generated by KOH activation, which could provide huge amount of “ion-adsorption sites”, a large adsorption interface for electrolyte ions to form the electric double layer (EDL), which was beneficial for its SC application.
(a) Nitrogen adsorption–desorption isotherms of PCACs measured at 77 K and (b) pore size distribution curves of PCACs by Barrett–Joyner–Halenda (BJH) method using slit-like pores as a pore model.

Surface properties and pore-structure parameters of PCACs.

a BET surface area.
b Mesopore surface area calculated by BJH method using adsorption branch.
c Micropore surface area S micro = S BET − S Meso.
d Total pore volume, measured at P/P 0 = 0.99.
e Mesopore volume calculated by BJH method using adsorption branch.
f Microporous volume V Micro = V Total − V Meso.
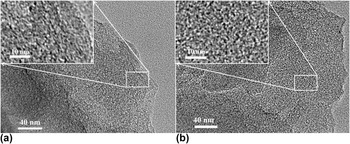
The TEM images of PCAC-1 and PCAC-4 (Fig. 2) clearly show the gradual evolution of the graphitic structure with the increase of KOH/PC weight ratio. For the PCAC-1, massive long curved graphene layers were observed, which may lead to the lack of micropores. As the KOH/PC weight ratio increases, these long curved graphene layers were transformed into short graphene layers with partially ordered arrangement. It could be seen that worm-like micropores were formed by the stacking of curved graphene planes due to deep activation at high KOH dosage in PCAC-4 [Fig. 2(b)]. It was further revealed that highly microporous structures for carbon materials can be formed during the process of KOH activation. Reference Puthusseri, Aravindan, Madhavi and Ogale14–Reference Pittman, He, Wu and Gardner16 It is also observed that PCAC-4 contained pores ranging from 2 nm to 5 nm due to deep activation, which also agrees well with the N2 adsorption results.
TEM images of (a) PCAC-1 and (b) PCAC-4.

B. Capacitive performance of PCACs in KOH electrolyte
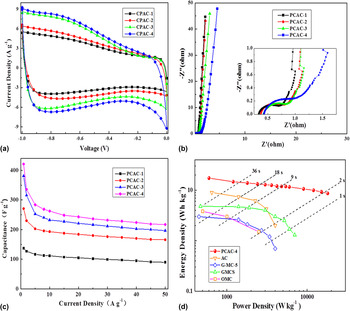
CV [Fig. 3(a)] was used to evaluate the capacitive behavior of PCACs as electrode materials. The distorted segment of CV curves with a wide hump but no obvious redox peaks appear within the potential window of −1.0 to −0.3 V. This CV shape may be related to three principal factors: (i) faradaic reactions induced by the heteroatoms (O) on the surface may occur mostly within the potential window of −1.0 to −0.3 V Reference Andreas and Conway17−Reference Cai, Xing, Liu, Zeng, Xue, Qiao and Yan20 ; (ii) the redox potential of various heteroatomic functional groups in KOH electrolyte are different from each other. The overlap and superposition of these multiple faradaic peaks contribute to the wide hump but no obvious redox peaks Reference Lin, Chen, Liu, Yang, Bi, Xu and Huang21 ; (iii) solvated ions penetrate into ultramicropores under strong electrostatic force with gradually enhanced voltages, which increase the capacitance according to the equation: C = εA/d. Reference Chmiola, Yushin, Gogotsi, Portet, Simon and Taberna7,Reference Largeot, Portet, Chmiola, Taberna, Gogotsi and Simon8,Reference Simon and Gogotsi22,Reference Raymundo-Pinero, Kierzek, Machnikowski and Béguin23 Furthermore, the CVs of the PCAC-4 maintained this distorted rectangular shape even at a high scan rate (Fig. S1), indicating that the ultramicropores and the heteroatoms can be utilized even at this high scan rate. This also confirms that hierarchical pore texture, containing both mesopores and micropores, of PCACs facilitates very fast ion diffusion from electrolyte into micropores, thus resulting in an outstanding high-rate performance.
Capacitive performance of PCACs determined in a three-electrode cell in 3 M KOH electrolyte: (a) CV curves at a scan rate of 10 mV/s; (b) Nyquist plots at various frequencies, the inset is the magnified Nyquist plots at high-frequency region; (c) specific capacitance at various current densities from 1 to 50 A/g. Capacitive performance of PCAC-4 determined in a two-electrode cell in 3 M KOH electrolyte: (d) energy density versus power density of SCs (Ragone plot) showing the position of PCAC-4 relative to AC, Reference Wang, Li, Liu, Lu and Cheng24 G-CM-5, Reference Lei, Liu, Wang, Sun, Lu and Zhao25 GMCS, Reference Lei, Christov and Zhao26 OMC. Reference Zhi, Zhao, Liu, Chen, Liu and Huang27

EIS data in typical Nyquist plots of PCACs [Fig. 3(b)] also showed the excellent capacitive performance. The Nyquist plots exhibited a semicircle in high-frequency region. The equivalent series resistance (ESR) of PCACs remained stable (in the range of 0.33–0.43) at different KOH dosages [Fig. 3(b)(inset)], revealing the high conductivity of these carbons. In the Warburg region (from 8.3 to 17.8 Hz), the Nyquist plot was a straight line with a slop near 45° which reflects the ion diffusion process from the electrolyte into electrode materials. At the low frequency region, the plot showed a line intersecting with the real axis at a near 90° angle, indicating ideal capacitive behavior of PCACs.
High-rate supercapacitive performance is a dominant factor for the practical application of electrode materials. Figure 3(c) shows the variation of specific capacitance of PCACs with increasing current densities from 1 to 50 A/g. The specific capacitances were calculated from the GCD at different current densities ranging from 1 A/g to 50 A/g. As shown in Fig. 3(c), the specific capacitance of PCACs decreases gradually with the increase of current density, revealing that the electrode surface could not be sufficiently utilized by the electrolyte ions during fast charging. The maximum specific capacitance of the PCAC-4 was 421 F/g at 1 A/g, which was three times higher than the specific capacitance of the PCAC-1 (137 F/g at 1 A/g). This reveals that the capacitance of carbon electrode materials can be significantly and efficiently improved by increasing KOH dosage. Furthermore, the specific capacitances of PCACs remained almost stable with increasing current densities from 20 to 50 A/g, which is attributed to the hierarchical micro-meso porous structure of PCACs carbons. Remarkably, the specific capacitance of PCAC-4 could still be maintained to an unprecedented value of 217 F/g even at an ultrahigh current density of 50 A/g. However, when the specific surface area decreases for the reason of overusing KOH, the capacitive performance weakened seriously (Fig. S2).
The energy density and power density at an operating voltage of 1.2 V for PCACs are plotted in Figs. S3 and 3(d). It shows that the energy density of PCACs rises with the increase of KOH/PC weight ratio from 1 to 4. The maximum energy density of 17.2 W h/kg for PCACs was achieved. At a very high power density of 18,000 W/kg, PCAC-4 could still deliver a high energy density of 8.6 W h/kg. Moreover, a few typical carbons recently reported were compared with PCACs to further evaluate the capacitive performance of PCACs [Fig. 3(d)]. The energy and power densities of PCAC-4 are much higher than those of similar materials (SMs) at a long current drain time of 36 s. At high rates and current drain times shorter than 2 s, the gap of the energy and power densities between PCAC-4 and SMs is further broadened.
C. Morphology of PCAC-4 and HQ/PCAC-4
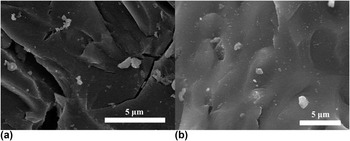
SEM images of PCAC-4 and HQ/PCAC-4 are shown in Fig. 4. It was noted that the morphology of HQ/PCAC-4 was extremely similar to PCAC-4, which indicates that the appropriate amount of HQ could be well dispersed into the porous structure and physisorbed inside the pores of PCAC-4.
SEM images of (a) PCAC-4 and (b) HQ/PCAC-4.

D. Capacitive performance of PCACs and HQ/PCAC-4 in H2SO4 electrolyte
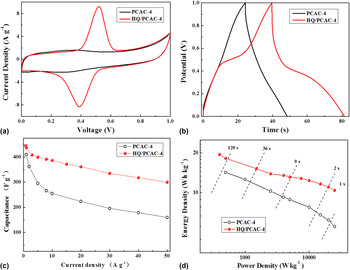
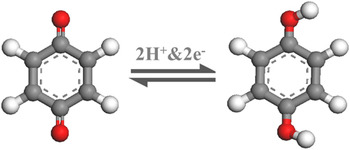
CV measurement is considered as the appropriate tool to distinguish between faradaic and non-faradaic types of energy storage mechanism. CV [Fig. 5(a)] was used to evaluate the capacitive behavior of PCAC-4 and HQ/PCAC-4 as electrode materials. The distorted CV of PCAC-4 curves with a weak hump but no obvious redox peaks within the potential window of 0.2–0.4 V could be seen, which indicates that faradaic reactions induced by the heteroatoms on the surface occur. However, the CV curve of HQ/PCAC-4 displayed a shape of a part of the CV curves of PCAC-4 (0–0.2 V and 0.6–1.0 V) combined with a pair of faradaic peaks in the potential range of 0.2–0.6 V. Reference Hou, Guo and Wang28 The faradaic peaks were caused by the reversible redox reaction of the adsorbed HQ molecules (Scheme 1) in the 1 M H2SO4. In the potential range of 0–0.2 V and 0.6–1.0 V, the CV curves of HQ/PCAC-4 and PCAC-4 coincide completely, indicating that the adsorbed HQ did not block the pores of PCAC-4. Otherwise, the adsorbed HQ would surely decrease the response current of the PCAC-4 in these potential ranges. The peaks of HQ had nearly symmetrical wave-shapes, revealing that the surface confined redox reaction have a good reversibility and a fast charge transfer process.
Capacitive performance of PCAC-4 determined in a three-electrode cell in 1 M H2SO4 electrolyte: (a) CV curves at a scan rate of 5 mV/s; (b) GCD curves of 10 A/g; (c) specific capacitance at various current densities from 1 to 50 A/g. Capacitive performance of PCAC-4 and HQ/PCAC-4 determined in a two-electrode cell in 1 M H2SO4 electrolyte: (d) energy density versus power density (Ragone plot) of PCAC-4 and HQ/PCAC-4 SCs.

The equation showing the overall redox chemistry of HQ.

GCD tests [Fig. 5(b)] were carried out in the potential range of 0–1 V (versus SCE) to further compare electrochemical performance of HQ/PCAC-4 and PCAC-4. It could be noted that the charge/discharge plots of PCAC-4 exhibited a shape of symmetrical triangles and small IR voltage drops at relatively high current density of 10 A/g, indicating high coulombic efficiency and small ESR. HQ/PCAC-4 exhibited a longer discharge time compared with the PCAC-4. In addition, the charge/discharge plots of HQ/PCAC-4 presented plateaus characteristic of redox reactions in the potential range of 0.2–0.6 V at relatively high current density of 10 A/g, revealing that the HQ could still react sufficiently with electrolyte during fast charging or discharging. This is in good agreement with the CV results.
Figs. 5(c) and S4 show the variation of specific capacitance of HQ/PCAC-4 and PCACs with increasing current densities from 1 to 50 A/g in 1 M H2SO4. As shown in Fig. S4, the specific capacitance of PCACs decreased with the increase of current density, revealing that the electrode surface could not be fully utilized by the electrolyte ions during fast charging. The maximum specific capacitance of the HQ/PCAC-4 was 445.8 F/g at 1 A/g. HQ/PCAC-4 reached an unprecedented value of 300.2 F/g at a very high current density of 50 A/g, retaining 78% of its capacitance measured at 10 A/g, which is attributed to the hierarchical micro-meso porous structure and fast redox reaction of HQ/PCAC-4.
Figure 5(d) shows the energy density and power density for PCAC-4 and HQ/PCAC-4. It was shown that the energy density of HQ/PCAC-4 was enhanced after adsorption of HQ. The maximum energy density of PCACs was 19.5 W h/kg. At a very high power density of 25,000 W/kg, HQ/PCAC-4 could still deliver a high energy density of 10.4 W h/kg, which is almost two times higher than the specific capacitance of the PCAC-4 (5.5 W h/kg at 25,000 W/kg). This result may be related to three reasons: (i) the adsorbed HQ increased the wettability of the carbon surface in the aqueous electrolyte, enlarging the electrolyte/electrode interface for EDL formation; (ii) the diffusion resistance of H+ (required by the redox of HQ) into the inner pores was lower than that of SO4 2−; (iii) the PCAC-4 could act as a current collector for the adsorbed HQ, guaranteeing fast electron transfer. So this unique structure eventually increases the overall capacitive performance of HQ/PCAC-4.
IV. CONCLUSION
In summary, based on an efficient activation method by KOH, hierarchical micro-meso porous PCACs were prepared from low valuable PC. Meanwhile, the HQ was physisorbed on PCACs by simple stirring experiment to get functionalized activated carbon (HQ/PCAC-4). Then the PCACs and HQ/PCAC-4 were utilized for SC application in 3 M KOH and 1 M H2SO4 electrolyte, respectively. Firstly, the hierarchical micro-meso porous texture can facilitate fast ion diffusion, resulting in their outstanding high-rate capacitive performance. Besides, the abundant micropores and heteroatoms in the PCACs can act as “ion-adsorption sites” and “faradaic reaction sites”, respectively, which enhance their capacitances and lead to high energy densities. Thirdly, pseudocapacitance can be incorporated through physisorption of HQ on active carbons without blocking porous channel, resulting in better/higher high-rate performance and energy densities of HQ/PCAC-4 than those of PCAC-4.
Supplementary Material
To view supplementary material for this article, please visit https://doi.org/10.1557/jmr.2016.405.
ACKNOWLEDGMENTS
This work was financially supported by National Natural Science Foundation of China (21476264), Distinguished Young Scientist Foundation of Shandong Province (JQ201215), Taishan Scholar Foundation (ts20130929) and Fundamental Research Funds for the Central Universities (15CX05029A, 15CX08009A).