1. Introduction
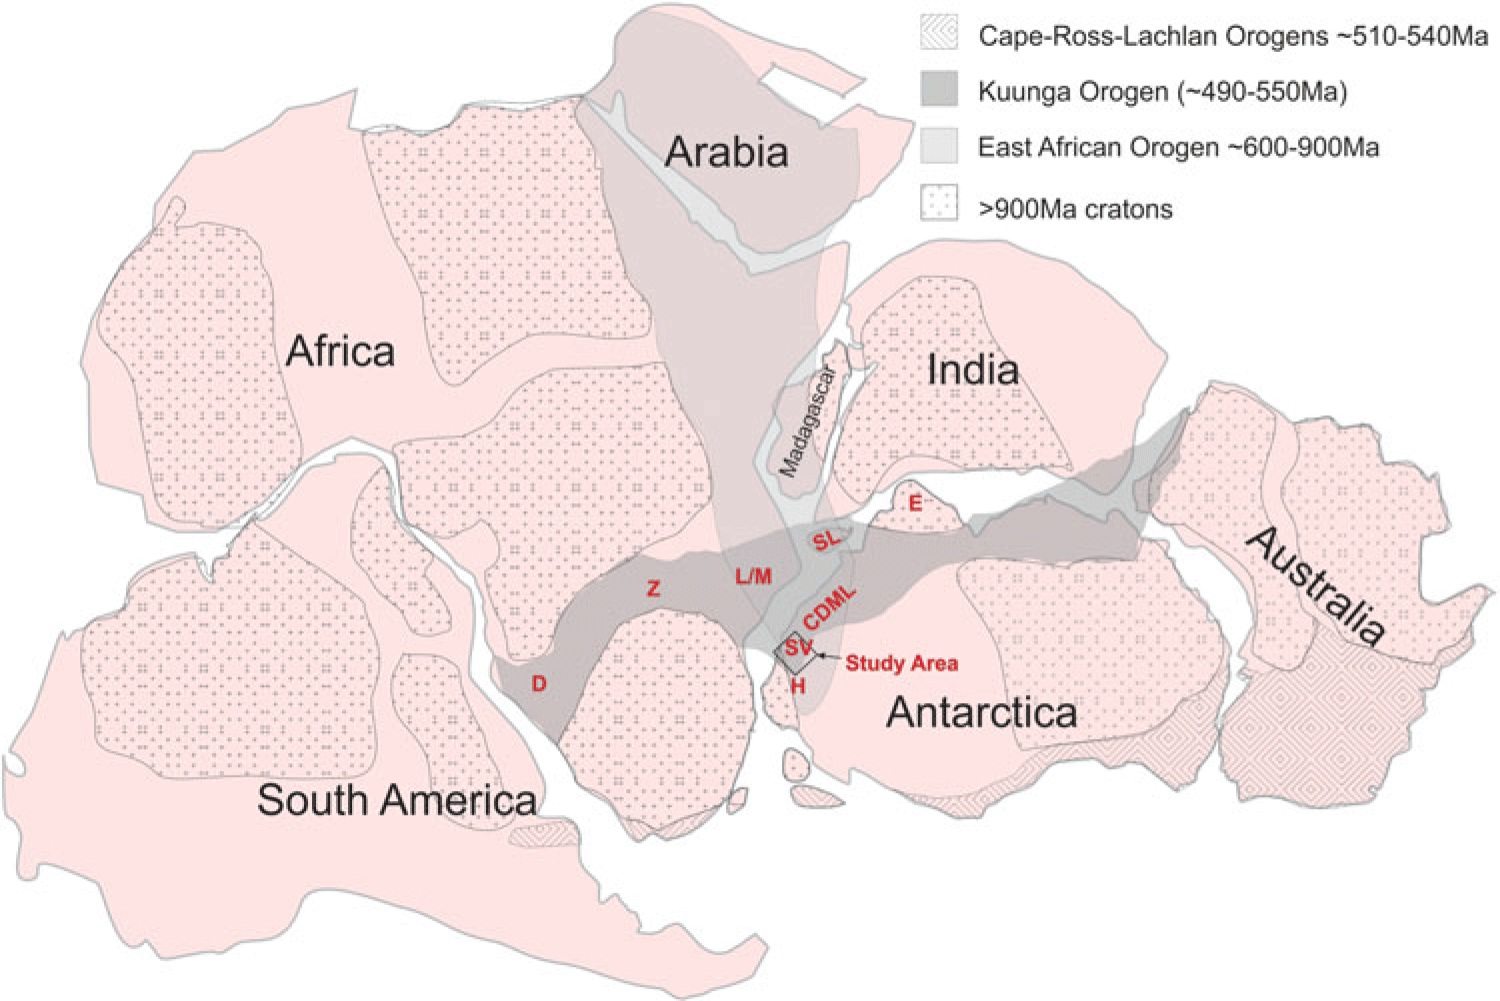
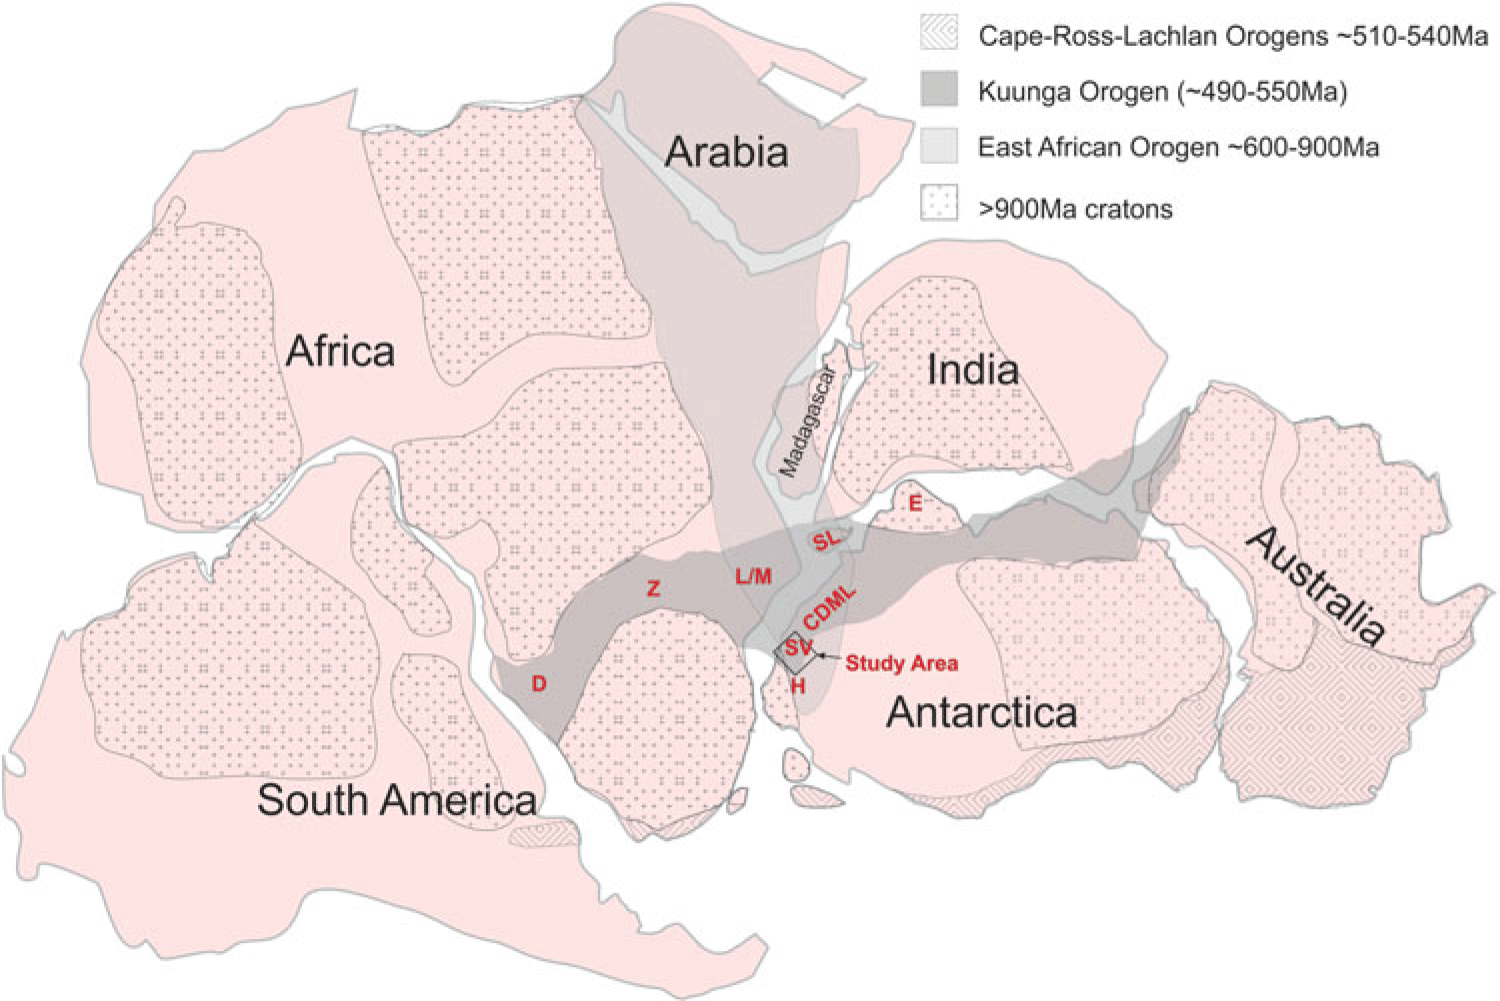
Western Dronning Maud Land (WDML) is strategically located in an area where the inferred extents of the East African Orogeny (EAO) and the Kuunga Orogenies (KO) overlap (Figs 1, 2). The processes and timing of these orogenies are inferred to have contributed to the amalgamation of Gondwana, and consequently an understanding of the nature of deformation in the study area (Fig. 2) can contribute to an insight into the interpreted configurations and timing of Gondwana amalgamation.
Reconstruction of Gondwana showing the location of the study area in a locality within the inferred extents of the East African Orogeny and the Kuunga Orogeny. D = Damara, Namibia; Z = Zambesi, Zambia; M/L = Mozambique/Lurio belts, Mozambique; SL = Sri Lanka, E = Enderby Land, Antarctica; H = Heimefrontfjella, Antarctica.
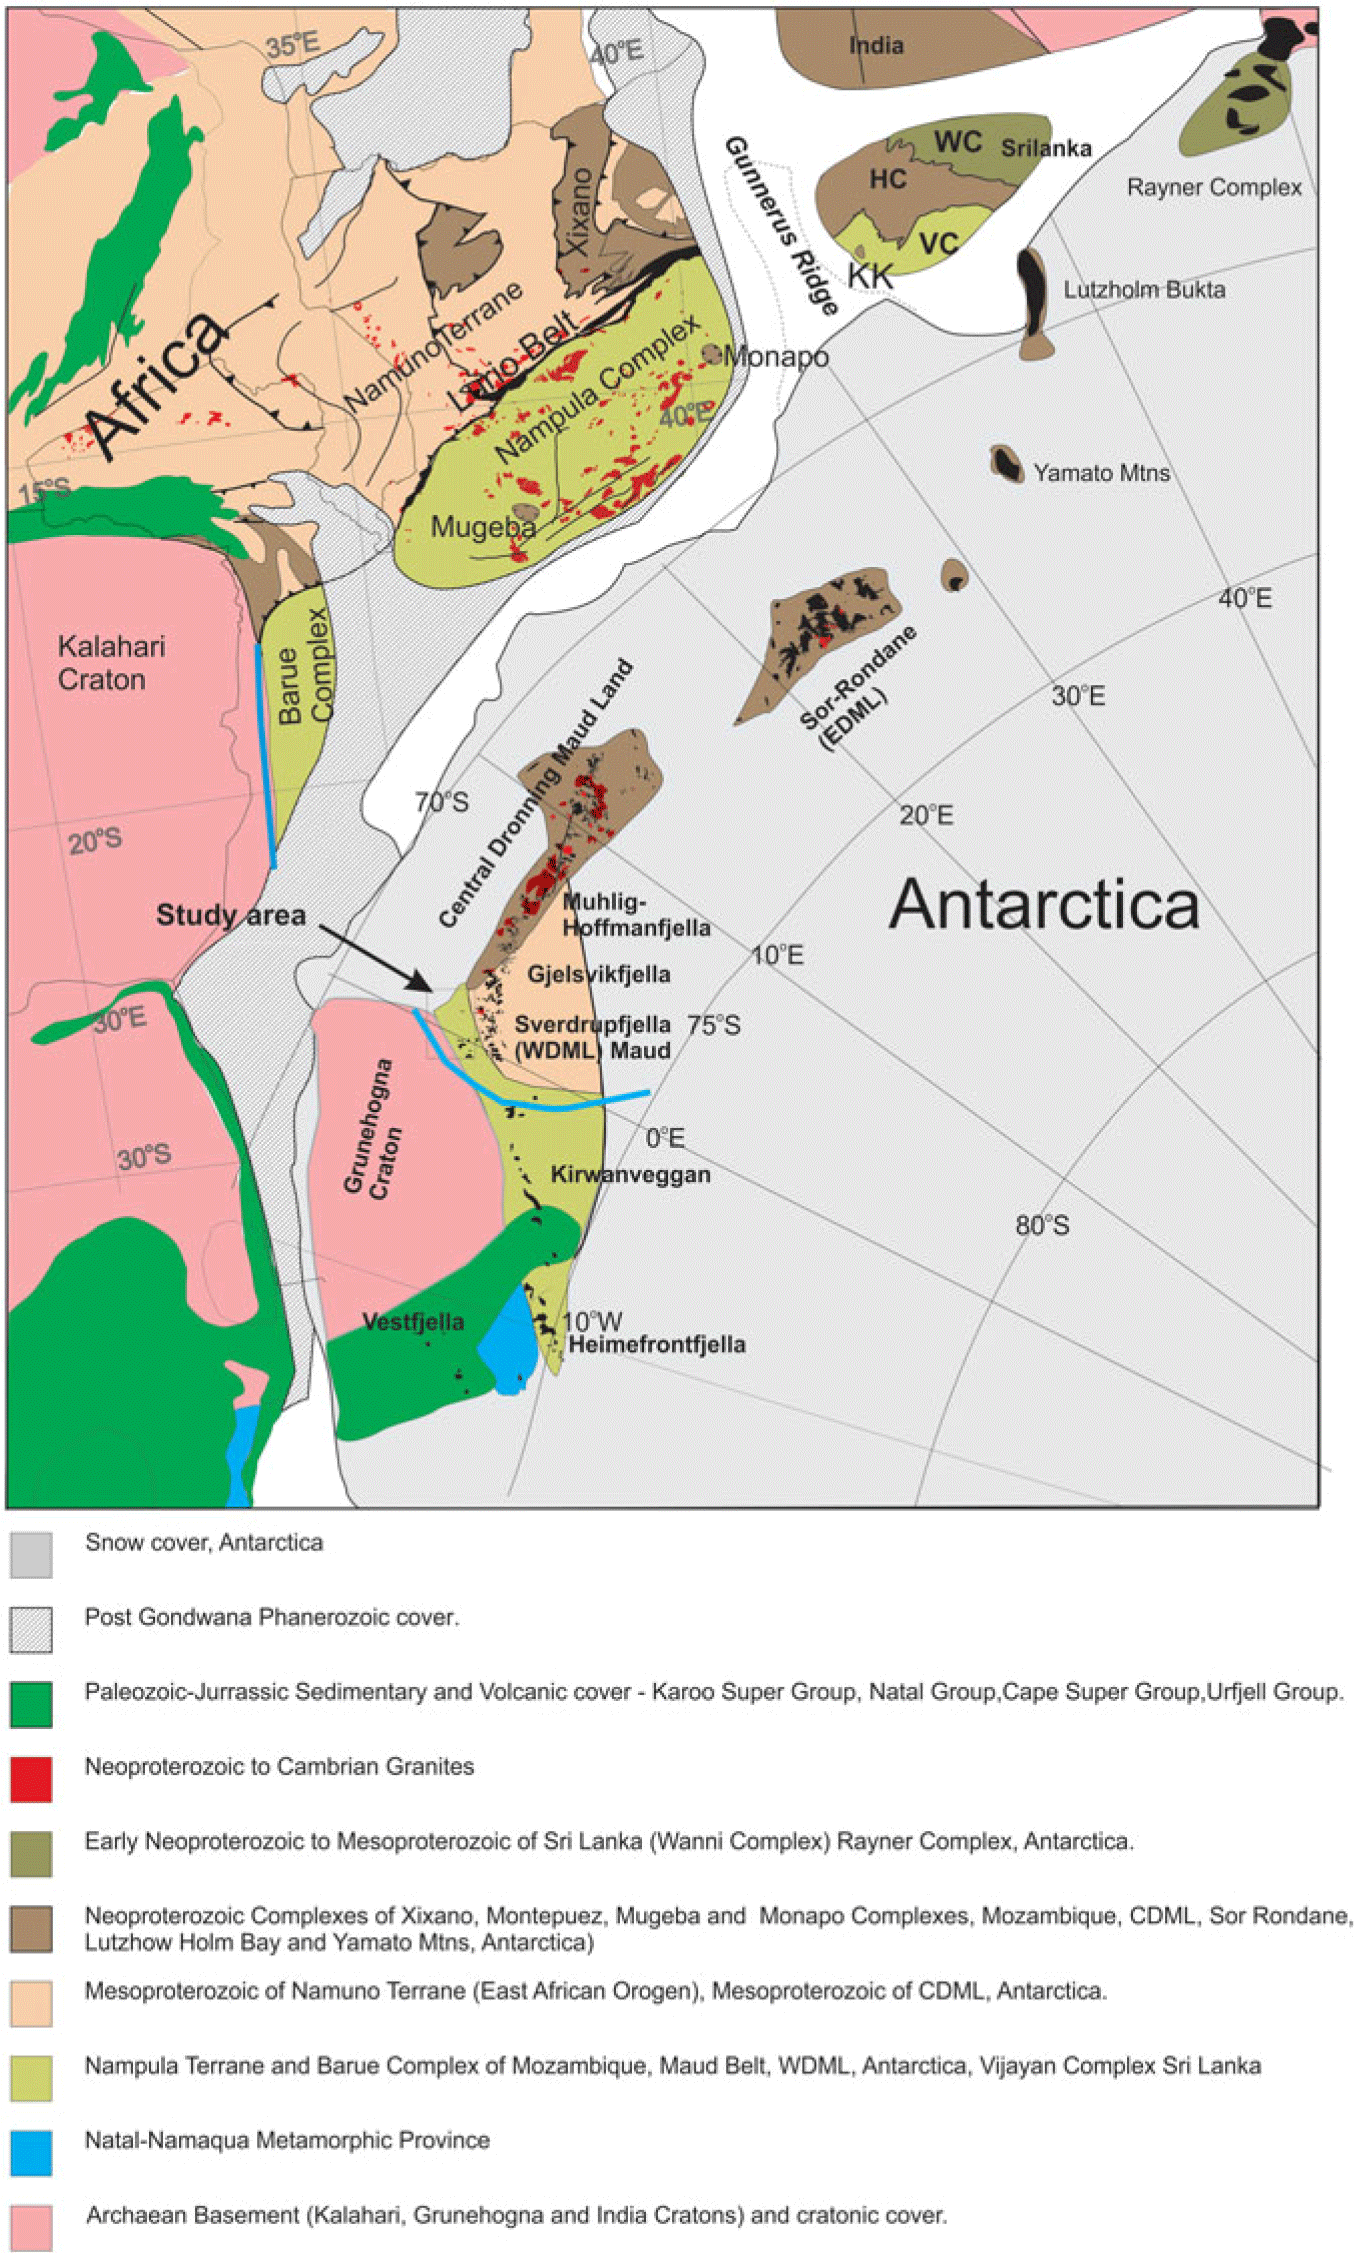
Simplified geological map of a portion of reconstructed Gondwana showing correlated units between the different continental blocks. The study area location is shown along the boundary of the Kalahari Craton and Maud Belt. Abbreviations for Sri Lanka are WC = Wanni Complex, HC = Highlands Complex, VC = Vijayana Complex and KK = Kataragama Klippen. The blue line reflects the nappe extent inferred in this study.

1.a. East African Orogeny
The EAO was originally proposed by Stern (Reference Stern1994, Reference Stern2002) to extend from the Arabian–Nubian shield to northern Mozambique and was inferred to involve a Wilson cycle from c. 900 Ma to c. 600 Ma in which East Gondwana collided with West Gondwana with the opening and closure of the Mozambique Ocean. Jacobs et al. (Reference Jacobs, Fanning, Henjes-Kunst, Olesch and Paech1998) proposed a geographical extension to the EAO, to central Dronning Maud Land (CDML), Antarctica, and a geochronological extension to include c. 500 Ma age deformation in Dronning Maud Land (DML). The age of the deformation was constrained by K–Ar and Ar–Ar dating of mica and amphibole in Heimefrontfjella (Jacobs et al. Reference Jacobs, Ahrendt, Kreutzer and Weber1995, Reference Jacobs, Bauer, Spaeth, Thomas and Weber1996, Reference Jacobs, Falter, Weber, Jessberger and Ricci1997, Reference Jacobs, Hansen, Henjes-Kunst, Thomas, Weber, Bauer, Armstrong and Cornell1999). Jacobs et al. (Reference Jacobs, Fanning, Henjes-Kunst, Olesch and Paech1998, Reference Jacobs, Bauer and Fanning2003a, b, c), Jacobs and Thomas (Reference Jacobs and Thomas2004) and subsequent papers concluded that an intercontinental-scale transpressional sinistral shear structure for the East African Antarctic Orogen was involved in the amalgamation of East and West Gondwana, stretching from central East Africa to Heimefrontfjella (Figs 1, 2). Within the study area (Fig. 2), a suture was inferred along the west as part of the large-scale shear structure. The nature of the suture in the study area was not defined, however, but was inferred to be sinistral northwards in southern Africa and dextral to the south in Heimefrontfjella. The positioning of the sutures of the intercontinental-scale sinistral shear along the E and W was reportedly inferred from earlier publications of Grunow et al. (Reference Grunow, Hanson and Wilson1996), Shackleton (Reference Shackleton1996) and Wilson et al. (Reference Wilson, Grunow and Hanson1997). The sutures defined by Shackleton (Reference Shackleton1996) along the west comprise orthogonal W- to WNW-directed thrust fault zones toward cratonic blocks in central and southern Africa and west Dronning Maud Land (WDML) with no strike-slip component defined. Shackleton (Reference Shackleton1996) recognized top-to-the-SE thrust zones in the Lurio Belt and Sri Lanka, and Grunow et al. (Reference Grunow, Hanson and Wilson1996) and Wilson et al. (Reference Wilson, Grunow and Hanson1997) discuss various permutations of sutures in southern Africa and Antarctica and suggested an eastern suture linking the Lutzo-Holmbukta area with the Shackleton Range across Antarctica, separating a Pan-African Belt in the west from an Antarctic Craton in the east. Fitzsimons (Reference Fitzsimons2000) similarly inferred Cambrian sutures through the Sri Lanka – Lutzo Holmbukta areas and a separate one in the Shackleton range area but did not support continuity between the two areas. Mieth & Jokat (Reference Mieth and Jokat2014) conclude that there is no aeromagnetic geophysical data in support of an inferred suture linking Lutzo Holmbukta with the Shackleton Range. Fitzsimons (Reference Fitzsimons2000) reflects a dominant 650–550 Ma orogen across the Nampula Terrane of northern Mozambique; however, subsequent data from that area (Grantham et al. Reference Grantham, Macey, Ingram, Roberts, Armstrong, Hokada, Shiraishi, Jackson, Bisnath, Manhica, Satish-Kumar, Motoyoshi, Osanai, Hiroi and Shiraishi2008; Bingen et al. Reference Bingen, Jacobs, Viola, Henderson, Skår, Boyd, Thomas, Solli, Key and Daudi2009; Macey et al. Reference Macey, Thomas, Grantham, Ingram, Jacobs, Armstrong, Roberts, Bingen, Hollick, de Kock, Viola, Bauer, Gonzales, Bjerkgård, Henderson, Sandstad, Cronwright, Harley, Solli, Nordgulen, Motuza, Daudi and Manhiça2010) have reported a dominantly Mesoproterozoic basement which has a metamorphic overprint of <570 Ma with ages >600 Ma only recorded in granulite-grade klippen (Grantham et al. Reference Grantham, Macey, Horie, Kawakami, Ishikawa, Satish-Kumar, Tsuchiya, Graser and Azevedo2013; Macey et al. Reference Macey, Miller, Rowe, Grantham, Siegfried, Armstrong, Kemp and Bacalau2013).
Structural data published from Heimefrontfjella and Gjelsvijfjella (Jacobs et al. Reference Jacobs, Bauer, Spaeth, Thomas and Weber1996, Reference Jacobs, Bauer and Fanning2003a), both areas in DML adjacent to the study area, contributed to the inferred EAO extension to Heimefrontfjella (Fig. 2). In Heimefrontjella, a dextral oblique strike-slip curvilinear shear zone in the north reportedly becomes a frontal ramp with dip-slip in the south (Jacobs et al. Reference Jacobs, Bauer, Spaeth, Thomas and Weber1996). Late D3 shearing of Pan-African c. 500 Ma age is inferred as having a top-to-SE sense of shear. At this locality, the dextral sense of shear is inferred to contribute to the escape southwards of a smaller crustal block (Jacobs & Thomas, Reference Jacobs and Thomas2004). Age constraints from these structures are reported in Jacobs et al. (Reference Jacobs, Ahrendt, Kreutzer and Weber1995, Reference Jacobs, Bauer, Spaeth, Thomas and Weber1996, Reference Jacobs, Falter, Weber, Jessberger and Ricci1997, Reference Jacobs, Hansen, Henjes-Kunst, Thomas, Weber, Bauer, Armstrong and Cornell1999), with Ar–Ar ages on biotite being typically c. 500 Ma and hornblende ages c. 550–500 Ma except for the Kottas Terrane with hornblende ages of c. 1000 Ma.
In Gjelsvikfjella, at the western end of CDML (Fig. 2), Jacobs et al. (Reference Jacobs, Bauer and Fanning2003b) recognized two events, with an early dilational event at c. 558 Ma and a later event between 530 and 490 Ma with limited associated deformation. Whereas the association with deformation with these events was reported, the deformation trajectory directions were not reported. Significantly, a WNW–ESE-oriented thrust fault with top-to-the-S and -SSW stretching lineations was described; however, no strike-slip sinistral deformation was reported. Baba et al. (Reference Baba, Horie, Hokada, Owada, Adachi and Shiraishi2015) report a shear zone with location and orientation in Gjelsvikfjella similar to that of Jacobs et al. (Reference Jacobs, Bauer and Fanning2003b), and describe granulites in the hanging wall with ages between c. 598 Ma and 633 Ma, indicating that the S to SSW thrusting is younger than c. 598 Ma. Jacobs et al. (Reference Jacobs, Bauer and Fanning2003b) reported granitoid and limited basic magmatism in Gjelsvikfjella and further east in CDML and Mozambique (Jacobs et al. Reference Jacobs, Bingen, Thomas, Bauer, Wingate, Feitio, Satish-Kumar, Motoyoshi, Osanai, Hiroi and Shiraishi2008), which they described as being late tectonic and related to extensional post-orogenic collapse related to delamination of the orogenic root of the EAO. The direction of inferred extension was not defined. Structural trend maps from CDML are described in Jacobs et al. (Reference Jacobs, Fanning, Henjes-Kunst, Olesch and Paech1998, Reference Jacobs, Klemd, Fanning, Bauer, Colombo, Yoshida, Windley and Dasgupta2003c) showing an ENE-striking shear in the Orville Shear Zone, with sinistral sense of shear inferred to be of Pan-African age (Bauer et al. Reference Bauer, Thomas, Jacobs, Yoshida, Windley and Dasgupta2003). The Orvinfjella Shearzone has been correlated with the Namama Shearzone (Cadoppi et al. Reference Cadoppi, Costa and Sacchi1987) in Mozambique (Grantham et al. Reference Grantham, Maboko, Eglington, Yoshida, Windley and Dasgupta2003), where it terminates within the Nampula Complex and consequently does not represent a suture.
1.b. Kuunga Orogeny
In a detailed study of geochronological data, Meert (Reference Meert2003) proposed a marginally younger orogenic event (c. 570–530 Ma) over-printing the EAO and termed it the Kuunga Orogeny (KO) (Fig. 1). The KO was interpreted as extending from the Damara in Namibia, through the Zambesi belt, across northern Mozambique, into DML, Antarctica, through southern India and Sri Lanka, south of Enderby Land, Antarctica, and into western Australia (Fig. 1). In support of the Kuunga Orogeny, Grantham et al. (Reference Grantham, Macey, Ingram, Roberts, Armstrong, Hokada, Shiraishi, Jackson, Bisnath, Manhica, Satish-Kumar, Motoyoshi, Osanai, Hiroi and Shiraishi2008), proposed a continent–continent collision setting between N and S Gondwana, based on correlated lithological, structural, geochronological and metamorphic P–T conditions between southern Africa, DML and Sri Lanka. The collisional model proposed N Gondwana being thrust southwards over S Gondwana involving a mega-nappe structure with tectonic transport of up to c. 500 km between N Mozambique and DML (Figs 1, 2). Fundamental to the mega-nappe model are (a) the significance of klippen structures along the northern margin of southern Gondwana comprising the Naukluft Nappes of the Damara Orogen in Namibia, Urungwe Klippen (N Zimbabwe), Mavhuradohna Complex (NE Zimbabwe), Mugeba and Monapo Klippen (Mozambique) and Kataragama Klippen (Sri Lanka) (Fig. 1; Grantham et al. Reference Grantham, Macey, Ingram, Roberts, Armstrong, Hokada, Shiraishi, Jackson, Bisnath, Manhica, Satish-Kumar, Motoyoshi, Osanai, Hiroi and Shiraishi2008) and (b) the recognition that the lithologies in CDML are lithologically and geochronologically dissimilar to those of the Nampula Complex (Fig. 2) in Mozambique but similar to those of the Namuno Terrane, north of the Lurio Belt (Fig. 2) (Grantham et al. Reference Grantham, Macey, Ingram, Roberts, Armstrong, Hokada, Shiraishi, Jackson, Bisnath, Manhica, Satish-Kumar, Motoyoshi, Osanai, Hiroi and Shiraishi2008). The locations of the latter three klippen, correlated with the Namuno Complex, are shown in Figure 2 and imply that the Nampula Complex (Mozambique) and Vijayan Complex (Sri Lanka) were in the footwall of a nappe complex, the hanging wall now largely removed by erosion. The geology of CDML was also inferred to be allochthonous, being correlatable with rocks from the Namuno Terrane of northern Mozambique (Grantham et al. Reference Grantham, Macey, Ingram, Roberts, Armstrong, Hokada, Shiraishi, Jackson, Bisnath, Manhica, Satish-Kumar, Motoyoshi, Osanai, Hiroi and Shiraishi2008). The wider and larger extent of the CDML nappe structure was inferred to result from lower erosion rates in ice-covered Antarctica (Grantham et al. Reference Grantham, Macey, Ingram, Roberts, Armstrong, Hokada, Shiraishi, Jackson, Bisnath, Manhica, Satish-Kumar, Motoyoshi, Osanai, Hiroi and Shiraishi2008), recognizing that the Antarctic ice sheet is inferred to have grown at least since 35 Ma (Rose et al. Reference Rose, Ferraccioli, Jamieson, Bell, Corr, Creyts, Braaten, Jordan, Fretwell and Damaske2013), as well as loading of the continent under the Antarctic ice sheet (Grantham et al. Reference Grantham, Macey, Ingram, Roberts, Armstrong, Hokada, Shiraishi, Jackson, Bisnath, Manhica, Satish-Kumar, Motoyoshi, Osanai, Hiroi and Shiraishi2008) given that the Antarctic ice sheet is up to 5 km thick locally. In contrast, the Nampula Complex has experienced higher rates of erosion and uplift, reflected by fission track data since Gondwana break-up c. 190 Ma ago, being located in a subtropical climate (Daszinnies et al. Reference Daszinnies, Jacobs, Wartho, Grantham, Lisker, Ventura and Glasmacher2009). Grantham et al. (Reference Grantham, Macey, Horie, Kawakami, Ishikawa, Satish-Kumar, Tsuchiya, Graser and Azevedo2013) described further details of lithological, geochronological and metamorphic similarities between the Monapo Klippen in Mozambique and eastern Sør Rondane in DML, in support of the mega-nappe model, and extending it onto the Antarctic continent. Grantham et al. (Reference Grantham, Kramers, Eglington and Burger2019) broadened the longitudinal extent of the mega-nappe in the west to Gjelsvikfjella and eastern Sverdrupfjella from the original inference of CDML in Grantham et al. (Reference Grantham, Macey, Ingram, Roberts, Armstrong, Hokada, Shiraishi, Jackson, Bisnath, Manhica, Satish-Kumar, Motoyoshi, Osanai, Hiroi and Shiraishi2008) and constrained the latitudinal extent of the mega-nappe in WDML to Sverdrupfjella and N Kirwanveggan, based on new 40Ar/39Ar age and Nd/Sr whole-rock radiogenic isotope data. The 40Ar/39Ar cooling ages from biotite and hornblende in Sverdrupfjella and Kirwanveggan demonstrate that ∼500 Ma metamorphism and deformation did not extend to southern Kirwanveggan and beyond to Heimefrontfjella, indicating that extension of the EAO along the eastern margin of the Kalahari Craton was invalid, given that Heimefontfjella is separated from Kirwanveggan by sedimentary basins of c. 550 Ma old Urfjell Group and overlying Karoo-age sedimentary rocks in Kirwanveggan (Fig. 2). Grosch et al. (Reference Grosch, Frimmel, Abu-Alam and Košler2015) and Grantham et al. (Reference Grantham, Kramers, Eglington and Burger2019) conclude that east Sverdrupfjella was tectonically emplaced over West Sverdrupfjella in mid- to late Pan-African times. Grantham et al. (Reference Grantham, Kramers, Eglington and Burger2019) demonstrate that east Sverdrupfjella is isotopically distinct from west Sverdrupfjella, having juvenile protoliths with Nd depleted mantle ages (TDm) <c. 1800 Ma, in contrast to western Sverdrupfjella with TDm ages >c. 2000 Ma. Syntectonic granitic veins intruding both E and W Sverdrupfjella, with isotopic characteristics consistent with being sourced from the older W Sverdrupfjella basement crust, with ages of c. 490 Ma, show top-to-the-SE sense of shear during emplacement with extensional and compressional displacements in a simple shear setting (Grantham et al. Reference Grantham, Kramers, Eglington and Burger2019).
The term Maud Belt was proposed by Groenewald (Reference Groenewald, Findlay, Unrug, Banks and Veevers1993) referring to the lithologies underlying WDML which were assumed to be Mesoproterozoic in age, based on the available data. The extent of the Maud Belt has been revised in Mendonidis et al. (Reference Mendonidis, Thomas, Grantham and Armstrong2015) in which it is now recognized that the Maud Belt is marginally younger, at c. 1140 Ma, than the Natal–Namaqua Belts of southern Africa at c. 1225 Ma (Grantham et al. Reference Grantham, Manhica, Armstrong, Kruger and Loubser2011), the boundary between the two belts being located in Heimefrontfjella. Northwards in Gondwana, the Maud Belt, now recognized as being exposed in W Sverdrupfjella (Grantham et al. Reference Grantham, Kramers, Eglington and Burger2019), is correlated with the Barue Complex and its extension to the Nampula Complex in N Mozambique (Grantham et al. Reference Grantham, Manhica, Armstrong, Kruger and Loubser2011) (Fig. 2). Consequently in Antarctica, the c. 1140 Ma Maud Belt is restricted to western Sverdrupfjella, with eastern Sverdrupfjella being correlated with the CDML domain (Grantham et al. Reference Grantham, Kramers, Eglington and Burger2019). Extensions of the Maud Belt are, however, inferred to extend through the Barue and Nampula complexes of N Mozambique into the Vijayan Complex in Sri Lanka (Fig. 2) (Grantham et al. Reference Grantham, Macey, Ingram, Roberts, Armstrong, Hokada, Shiraishi, Jackson, Bisnath, Manhica, Satish-Kumar, Motoyoshi, Osanai, Hiroi and Shiraishi2008, Reference Grantham, Manhica, Armstrong, Kruger and Loubser2011; Wai-Pan Ng et al. Reference Wai-Pan Ng, Whitehouse, Tama, Jayasingha, Wonga, Denyszyn, Yiu and Chang2017).
In proposing the mega-nappe model, it was recognized that the inferred distance over which the nappe was emplaced varied significantly. Whereas the distance that the Kuunga nappe is thought to have covered between northern Mozambique and DML is c. 500–600 km, the emplacement distance related to the Urungwe Klippen, emplaced onto the northern Zimbabwe Craton in Zimbabwe, is significantly less and c. <100 km (Grantham et al. Reference Grantham, Macey, Ingram, Roberts, Armstrong, Hokada, Shiraishi, Jackson, Bisnath, Manhica, Satish-Kumar, Motoyoshi, Osanai, Hiroi and Shiraishi2008). The differential in distance between the two areas is channelled along the eastern margin of the Kalahari Craton and the Maud Belt to the east (Fig. 2), inferring a top-to-the-SE, dextral sense of shear for the hanging wall of the nappe at c. 530–500 Ma, east of the Kalahari Craton, with the Maud Belt of western Sverdrupfjella and its correlatives in Mozambique and Sri Lanka representing the footwall (Fig. 2).
The structural data described below, collected from the Straumsnutane area in 2012/13, were aimed at determining whether any structures could be identified there, that could be consistent with the nappe model extending onto the Kalahari Craton. The structural data described below from Sverdrupfjella were collected during PhD studies (Grantham, unpub. PhD thesis, Univ. Natal (Pietermaritzburg), 1992), are summarized in Grantham et al. (Reference Grantham, Jackson, Moyes, Groenewald, Harris, Ferrar and Krynauw1995, Reference Grantham, Macey, Ingram, Roberts, Armstrong, Hokada, Shiraishi, Jackson, Bisnath, Manhica, Satish-Kumar, Motoyoshi, Osanai, Hiroi and Shiraishi2008) and were an integral component used in the formulation of the mega-nappe model in Grantham et al. (Reference Grantham, Macey, Ingram, Roberts, Armstrong, Hokada, Shiraishi, Jackson, Bisnath, Manhica, Satish-Kumar, Motoyoshi, Osanai, Hiroi and Shiraishi2008). In describing and discussing the structural evolution of the study area, there has been debate as to the extent and timing of the deformation history involving the description and identification of both Mesoproterozoic and Neoproterozoic/Cambrian (Pan-African) deformation phases, and whether these are recognized in the various areas and can be differentiated structurally and geochronologically. Consequently, in the descriptions and discussions below, the characteristics of both phases of deformation are described.
2. Geology of the study areas
2.a. Ahlmannryggen and Straumsnutane
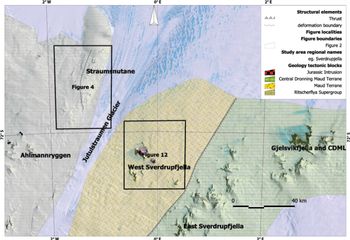
The geology of the study area in WDML comprises two geological terranes with a cratonic area located west of the Jutulstraumen Glacier and a medium-grade metamorphic terrane east of the glacier (Fig. 3). The cratonic terrane is underlain by the ∼3067 Ma old Annandagstoppane Granite (Marschall et al. Reference Marschall, Hawkesworth, Storey, Dhuime, Leat, Meyer and Tamm-Buckle2010) which is overlain by the Ritscherflya Supergroup (Wolmarans & Kent, Reference Wolmarans and Kent1982) comprising a volcano-sedimentary sequence intruded by basic sills of the Borgmassivet Suite. The Ritscherflya Supergroup comprises the sedimentary Ahlmannrygen Group and volcanogenic Jutulstraumen Group (Wolmarans & Kent, Reference Wolmarans and Kent1982). The Straumsnutane Formation basaltic andesites are inferred as forming the topmost sequence of the Jutulstraumen Group, overlying the Fasettfjellet Formation (Watters, Reference Watters1972; Watters et al. Reference Watters, Krynauw, Hunter, Thomson, Crame and Thomson1991).
Map showing the location of the study area in western Dronning Maud Land, Antarctica, spanning the Jutulstraumen Glacier, the geological provinces and localities of maps in Figure 4 and 12 in WDML. Note the inferred thrust fault boundary between east and west Sverdrupfjella (after Grosch et al. Reference Grosch, Frimmel, Abu-Alam and Košler2015; Grantham et al. Reference Grantham, Kramers, Eglington and Burger2019) separating the Maud Belt from CDML terrane.

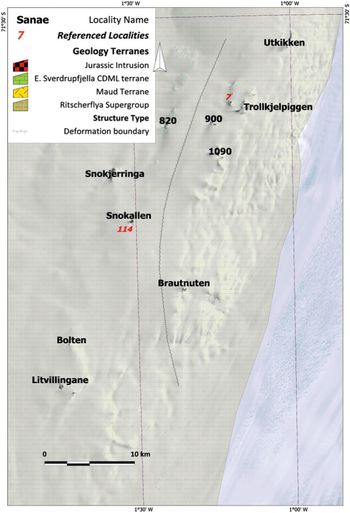
The Straumsnutane area of WDML (Fig. 4) is underlain by basaltic andesites and subordinate intercalated sedimentary rocks of the Straumsnutane Formation. The age of the Straumsnutane Formation is best constrained by the study of the detrital zircons of the sedimentary Ahlmannryggen Group, which underlies the Straumsnutane lavas, conducted by Marschall et al. (Reference Marschall, Hawkesworth and Leat2013) and by the age of Borgmassivet Suite intrusions.
Map showing the nunataks where the Straumsnutane Formation is exposed in WDML and the names of the various nunataks mentioned as well as locality numbers described in the text. The map also shows a dividing line between strongly deformed nunataks in the east and weakly deformed nunataks in the west.

Marschall et al. (Reference Marschall, Hawkesworth and Leat2013) concluded that the depositional age of the Ahlmannryggen Group is <1125 Ma, whereas Hanson et al. (Reference Hanson, Harmer, Blenkinsop, Bullen, Dalziel, Gose, Hall, Kampunzu, Key, Mukwakwami, Munyanyiwa, Pancake, Seidel and Ward2006) report an age for the Borgmassivet Suite of 1107 ± 2 Ma. The data reported by Marschall et al. (Reference Marschall, Hawkesworth and Leat2013) also reflect the fact that many of the zircons analysed were discordant and suggest a lower intercept age of ∼550 Ma, interpreted as resulting from low-grade metamorphism related to the ‘Pan-African’ amalgamation of Gondwana. Other attempts at constraining the age of the Straumsnutane lavas using Rb/Sr methods suggested an age of 848 ± 28Ma (Eastin et al. Reference Eastin, Faure and Neethling1970) with a model age of 1664 ± 35Ma. Watters et al. (Reference Watters, Krynauw, Hunter, Thomson, Crame and Thomson1991) reported Sm/Nd Tchur model ages of between 1300 and 1620 Ma. That the model ages are significantly older than the age of ∼1125 Ma suggests that the lavas have probably been contaminated by older crust in their genesis. Peters et al. (Reference Peters, Haverkamp, Emmermann, Kohnen, Weber, Thompson, Crame and Thompson1990) reported K–Ar ages of 526 ± 11Ma and 522 ± 11Ma from syntectonic white mica from a mylonite zone at Utkikken, N Straumsnutane. Peters (Reference Peters1989) concluded that the white mica had grown syntectonically with K metasomatism, with the mica displaying a strong preferred planar orientation in the shear planes. The radiogenic isotope and whole-rock major and trace element chemistry of the Straumsnutane Formation lavas have been described by Moabi et al. (Reference Moabi, Grantham, Roberts, le Roux, Pant and Dasgupta2017), who concluded that the chemical compositions of the Straumsnutane basaltic andesites indicated that they are comparable to and correlatable with the Borgmassivet Intrusive Suite in WDML as well as the Espungaberra Formation basaltic andesites and Umkondo sills in southern Africa, all forming part of the ∼1100 Ma Umkondo Large Igneous Province (Hanson et al. Reference Hanson, Harmer, Blenkinsop, Bullen, Dalziel, Gose, Hall, Kampunzu, Key, Mukwakwami, Munyanyiwa, Pancake, Seidel and Ward2006).
The most detailed study of the structures of the Ahlmannryggen is that of Perrit & Watkeys (Reference Perrit, Watkeys, Storti, Holdsworth and Salvini2003) who concluded that gentle folding and jointing were the dominant structures. They found that the Ahlmanryggen Group showed open folding with near-horizontal fold axes, trending NE to ENE. From a detailed study of joint patterns in the Borgmassivet and Ahlmannryggen areas, they concluded that the deformation had originated from Pan-African-aged sinistral strike-slip faulting along the boundary between the cratonic Grunehogna and Maud metamorphic terranes. Watters et al. (Reference Watters, Krynauw, Hunter, Thomson, Crame and Thomson1991) described intense shearing dipping 65–70° ESE at the eastern nunataks in Straumsnutane, with the intensity of the shearing dissipating westwards. They reported fairly tight NE-trending folds overturned to the SE in NE Straumsnutane. Spaeth (Reference Spaeth and McKenzie1987) and Spaeth & Fielitz (Reference Spaeth and Fielitz1987) provide the most comprehensive structural studies of Straumsnutane to date. Spaeth (Reference Spaeth and McKenzie1987) described strong SE-dipping planar fabrics, as well as top-to-NW thrust faulting, referring specifically to an exposure (see Fig. 10 further below) at Snokallen. He also provided a description of conjugate mesoscale faulting with slickenside planes, dipping dominantly to the SE.
2.b. Western Sverdrupfjella
Western Sverdrupfjella is underlain by highly deformed and metamorphosed c. 1140 Ma Mesoproterozoic gneisses which have been intruded by Cambrian-age granite veins and pegmatites, metabasic dykes of uncertain age and Jurassic alkaline complexes and dolerite dykes. The chemistry, structural geology and metamorphic history of the gneisses and intrusions of western Sverdrupfjella have been described by Grantham (unpub. PhD thesis, Univ. Natal (Pietermaritzburg), 1992). Grantham et al. (Reference Grantham, Armstrong, Moyes, Hanski, Mertanen, Ramo and Vuollo2006) and Grosch et al. (Reference Grosch, Bisnath, Frimmel and Board2007) describe the chemistry and age of metamorphosed mafic dykes of varying age. Grantham et al. (Reference Grantham, Armstrong, Moyes, Hanski, Mertanen, Ramo and Vuollo2006) report a deformed mafic dyke, which transects migmatitic layering in tonalitic gneisses, with an upper intercept SHRIMP (sensitive high-resolution ion microprobe) U/Pb zircon age of c. 900 Ma and lower intercept age of 523 ± 21 Ma. Harris et al. (Reference Harris, Watters and Groenewald1991), Harris & Grantham (Reference Harris and Grantham1993), Grantham (Reference Grantham, Storey, King and Livermore1996) and Riley et al. (Reference Riley, Leat, Curtis, Millar, Duncan and Fazel2005) describe the geology and chemistry of Jurassic dykes and the alkaline complex at Straumsvola. Grantham et al. (Reference Grantham, Manhica, Armstrong, Kruger and Loubser2011) described tonalitic gneisses from western Sverdrupfjella, Kirwanveggan and northern Mozambique, with ages of c. 1140 Ma, in support of correlating the Maud Belt, DML, and the Barue Complex of central Mozambique. Grosch et al. (Reference Grosch, Frimmel, Abu-Alam and Košler2015) studied the metamorphic P–T conditions between western Sverdrupfjella and the eastern margin of the Ahlmanryggen and concluded that the physical conditions at c. 500 Ma were c. 700 °C and 0.9 GPa and c. 350 °C and 0.3 GPa respectively. In addition, they concluded that western Sverdrupfjella was separated from eastern Sverdrupfjella by a thrust fault zone; however, no structural data were described in support of the conclusion. The structural history of western Sverdrupfjella has been briefly described by Grantham et al. (Reference Grantham, Jackson, Moyes, Groenewald, Harris, Ferrar and Krynauw1995, Reference Grantham, Macey, Ingram, Roberts, Armstrong, Hokada, Shiraishi, Jackson, Bisnath, Manhica, Satish-Kumar, Motoyoshi, Osanai, Hiroi and Shiraishi2008).
Recognizing that detailed structural studies from Straumsnutane and Sverdrupfjella have not previously been reported, this paper is aimed at documenting and interpreting the structural geology of Straumsnutane and western Sverdrupfjella and placing these data in a broader tectonic setting related to the amalgamation of Gondwana.
3. Field description
3.a. Straumsnutane
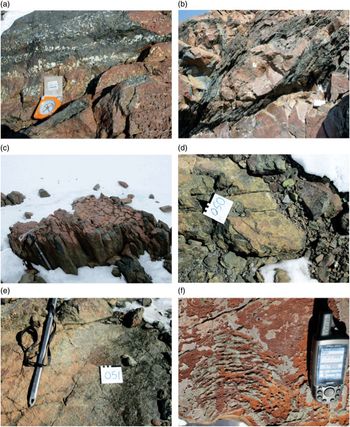
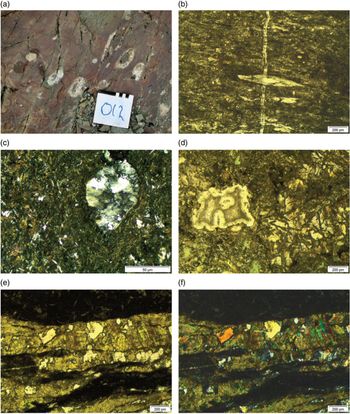
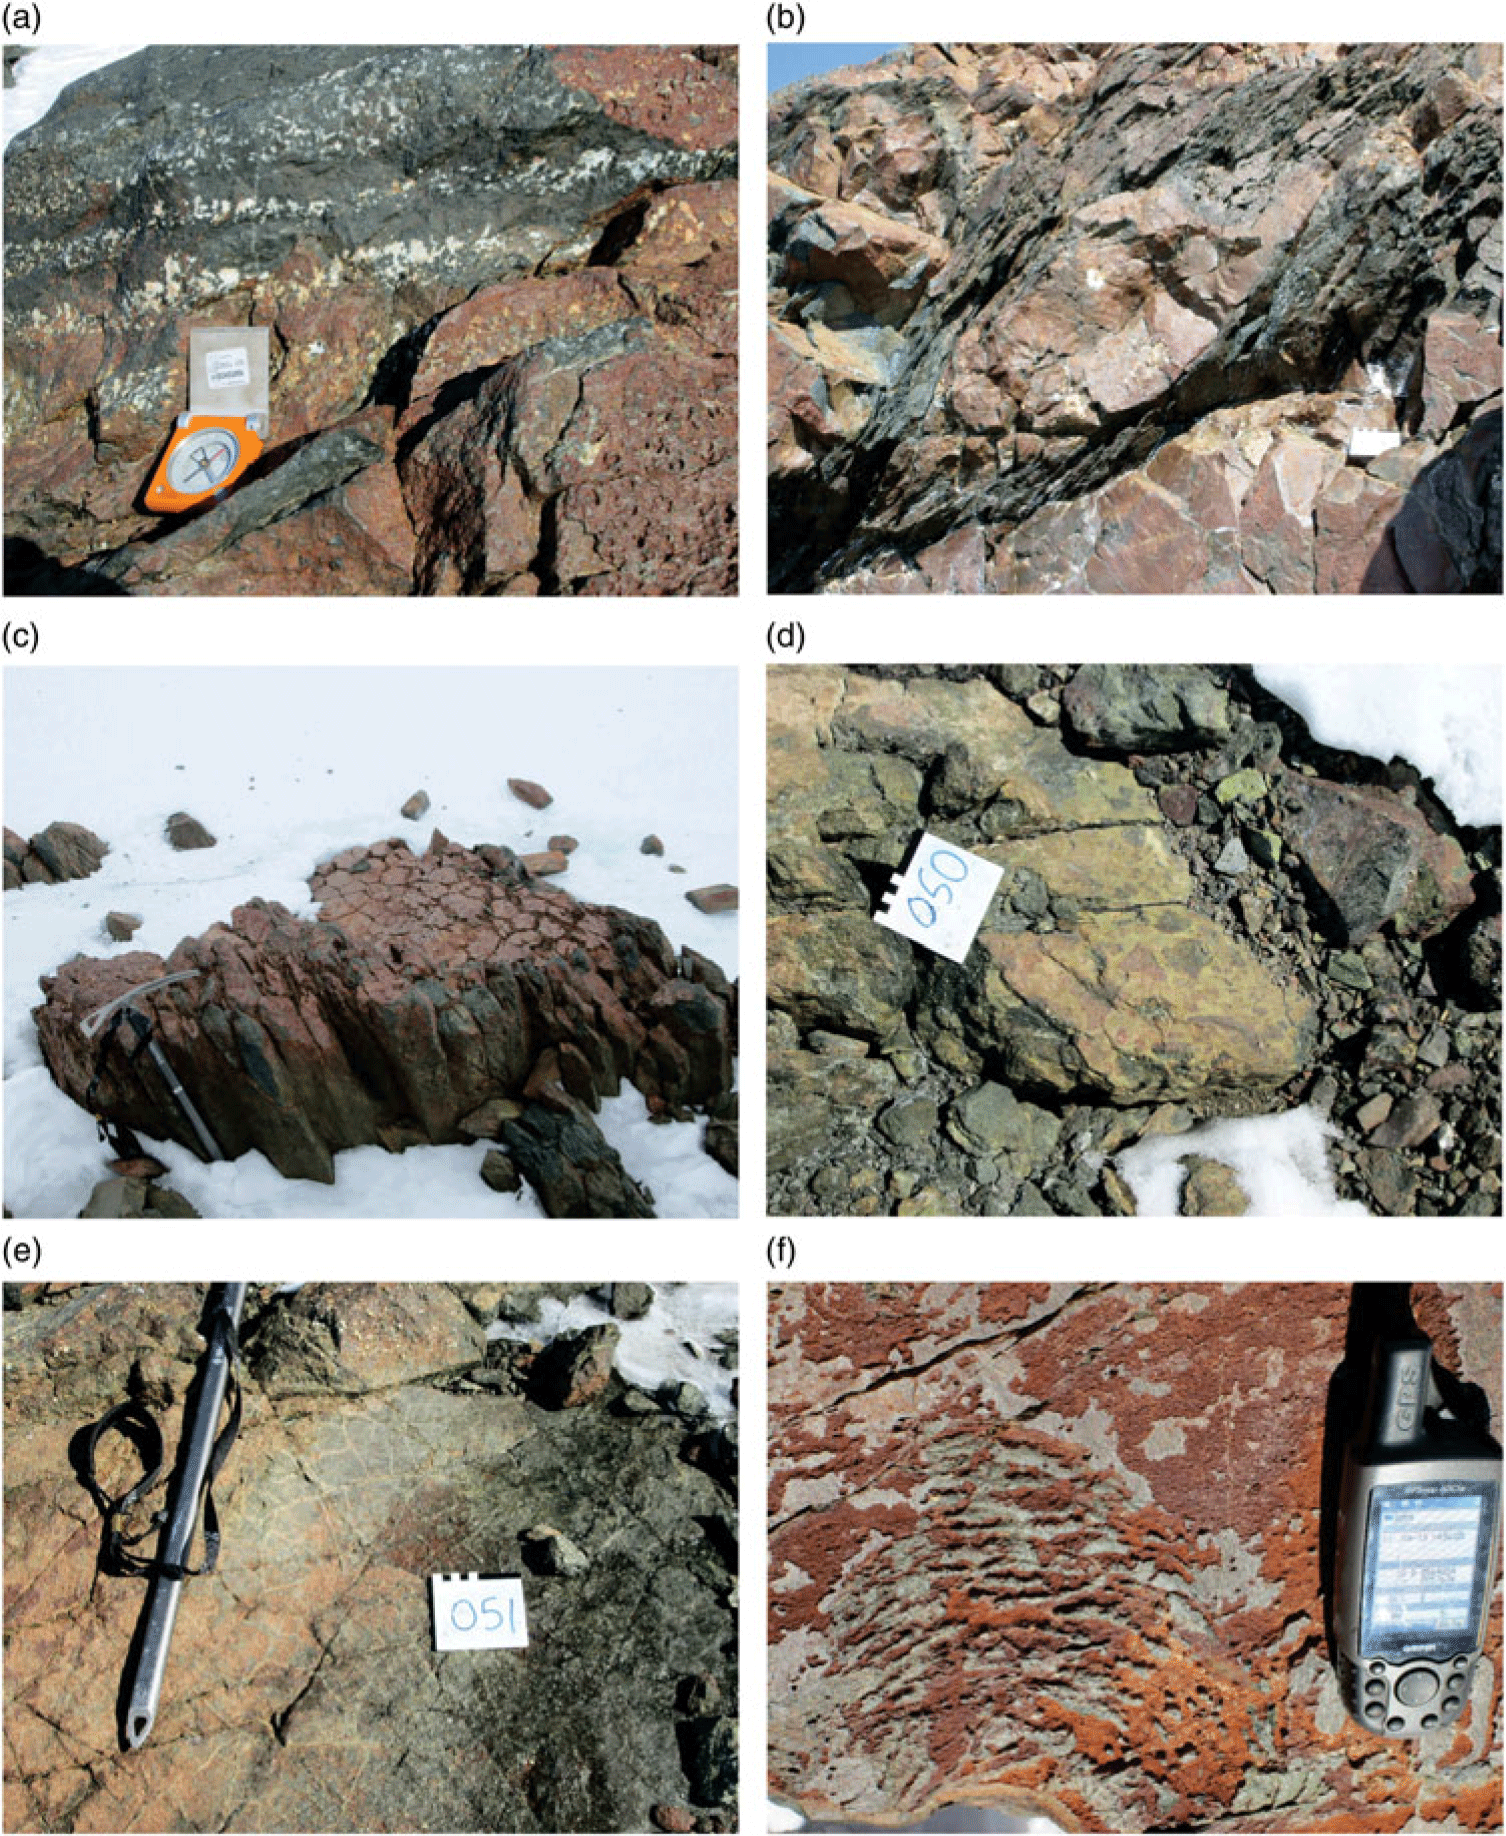
Watters et al. (Reference Watters, Krynauw, Hunter, Thomson, Crame and Thomson1991) provided the most detailed description of the volcanic rocks of the Straumsnutane Formation. They reported flow thicknesses ranging from ∼1 to >50 m, with rocks being variably massive to varying degrees of amygdale development (Fig. 5a). Pillow lavas were estimated to form ∼10 % of the ∼850 m thick sequence. The pillows typically form discrete ellipsoidal bodies with shearing along the inter-pillow groundmass (Fig. 5b). At one locality deformed columnar jointing is preserved (Fig. 5c). Pillowed sequences typically grade upwards into massive lava flows (Watters et al. Reference Watters, Krynauw, Hunter, Thomson, Crame and Thomson1991). At many localities the inter-pillow areas are filled with white quartz and calcite. Thin sedimentary beds are sporadically intercalated with the lava. Nunataks along the eastern margin typically have strong planar fabrics which have destroyed primary features except amygdales. The latter are commonly elongated defining linear features typically oriented parallel to mineral and stretching lineations when developed at the same localities. Primary structures are better preserved and recognized in nunataks away from the Jutulstraumen Glacier and include volcanic breccias (Fig. 5d), cooling cracks (Fig. 5e) and ropy lava textures (Fig. 5f). At some localities large ovoid quartz lenses are seen. The origin of these is uncertain and may be large vesicle fillings. Some of these structures have cores of lavas around which a quartz band is developed (Fig. 6a).
Photographs of primary structures recorded in the Straumsnutane area. Primary structures are best preserved in the western nunataks, with deformation increasing toward the Jutulstraumen Glacier in the east. (a) Layers rich and poor in amygdales. Compass for scale. (b) Flattened pillow lava. Note the strong planar fabric in the inter-pillow material and the unfoliated pillow core. The white square at lower right is 10 cm wide. (c) Partially flattened columnar jointing in basaltic andesite. Ice axe for scale. (d) Volcanic breccia fragments in basaltic andesite. The white square is 10 cm wide. (e) Cooling cracks developed in basaltic andesite. Ice axe for scale. (f) Surface pahoehoe ropy lava texture developed on basaltic andesite. GPS for scale.
Field photograph and photomicrographs of thin-sections. (a) Field photograph showing lenticular quartz tubes/blobs with cores of lavas. White square is 10 cm wide. (b) Photomicrograph of mylonitic fabric and quartz vein in sheared basaltic andesite. (c) Photomicrograph of amygdale in basaltic andesite showing strained quartz filling the amygdale. (d) Photomicrograph of zeolite-filled amygdale at left in lava with partially altered clinopyroxene at right and green chlorite at bottom centre. (e) Photomicrograph (plane polarized light) of epidote–quartz vein showing prismatic epidote. (f) Photomicrograph (crossed polars) of quartz–epidote-filled vein.

Primary minerals preserved in these rocks include clinopyroxene and andesine plagioclase. The rocks are extensively altered, with chlorite, white mica and epidote being common (Fig. 6d, e, f). Amygdales are filled with recrystallized quartz, zeolites and calcite (Fig. 6c, d). Serpentine pseudomorphs after olivine are seen in some samples from more basaltic compositions. Retrogressive prehnite and pumpellyite are described by Moabi et al. (Reference Moabi, Grantham, Roberts, le Roux, Pant and Dasgupta2017). Mylonitized zones have strong planar fabrics (Fig. 6b). A detailed study of the chemistry of the lavas shows they are basaltic andesites whose genesis has probably involved mixing between a MORB (mid-ocean ridge basalt)-like basaltic magma and evolved Achaean crust at depth (Moabi et al. Reference Moabi, Grantham, Roberts, le Roux, Pant and Dasgupta2017).
3.a.1. Structural data
Structures observed in the field can be grouped into folds, thrust faults and associated structures, small mesoscale slickensided fault planes and vein arrays. The most common structures in the field comprise planar foliations, slickensided fault surfaces with strong lineations, and quartz veins. The latter commonly form multiple generational en-echelon arrays. Less common structures include mineral and stretching lineations, and mesoscale folds.
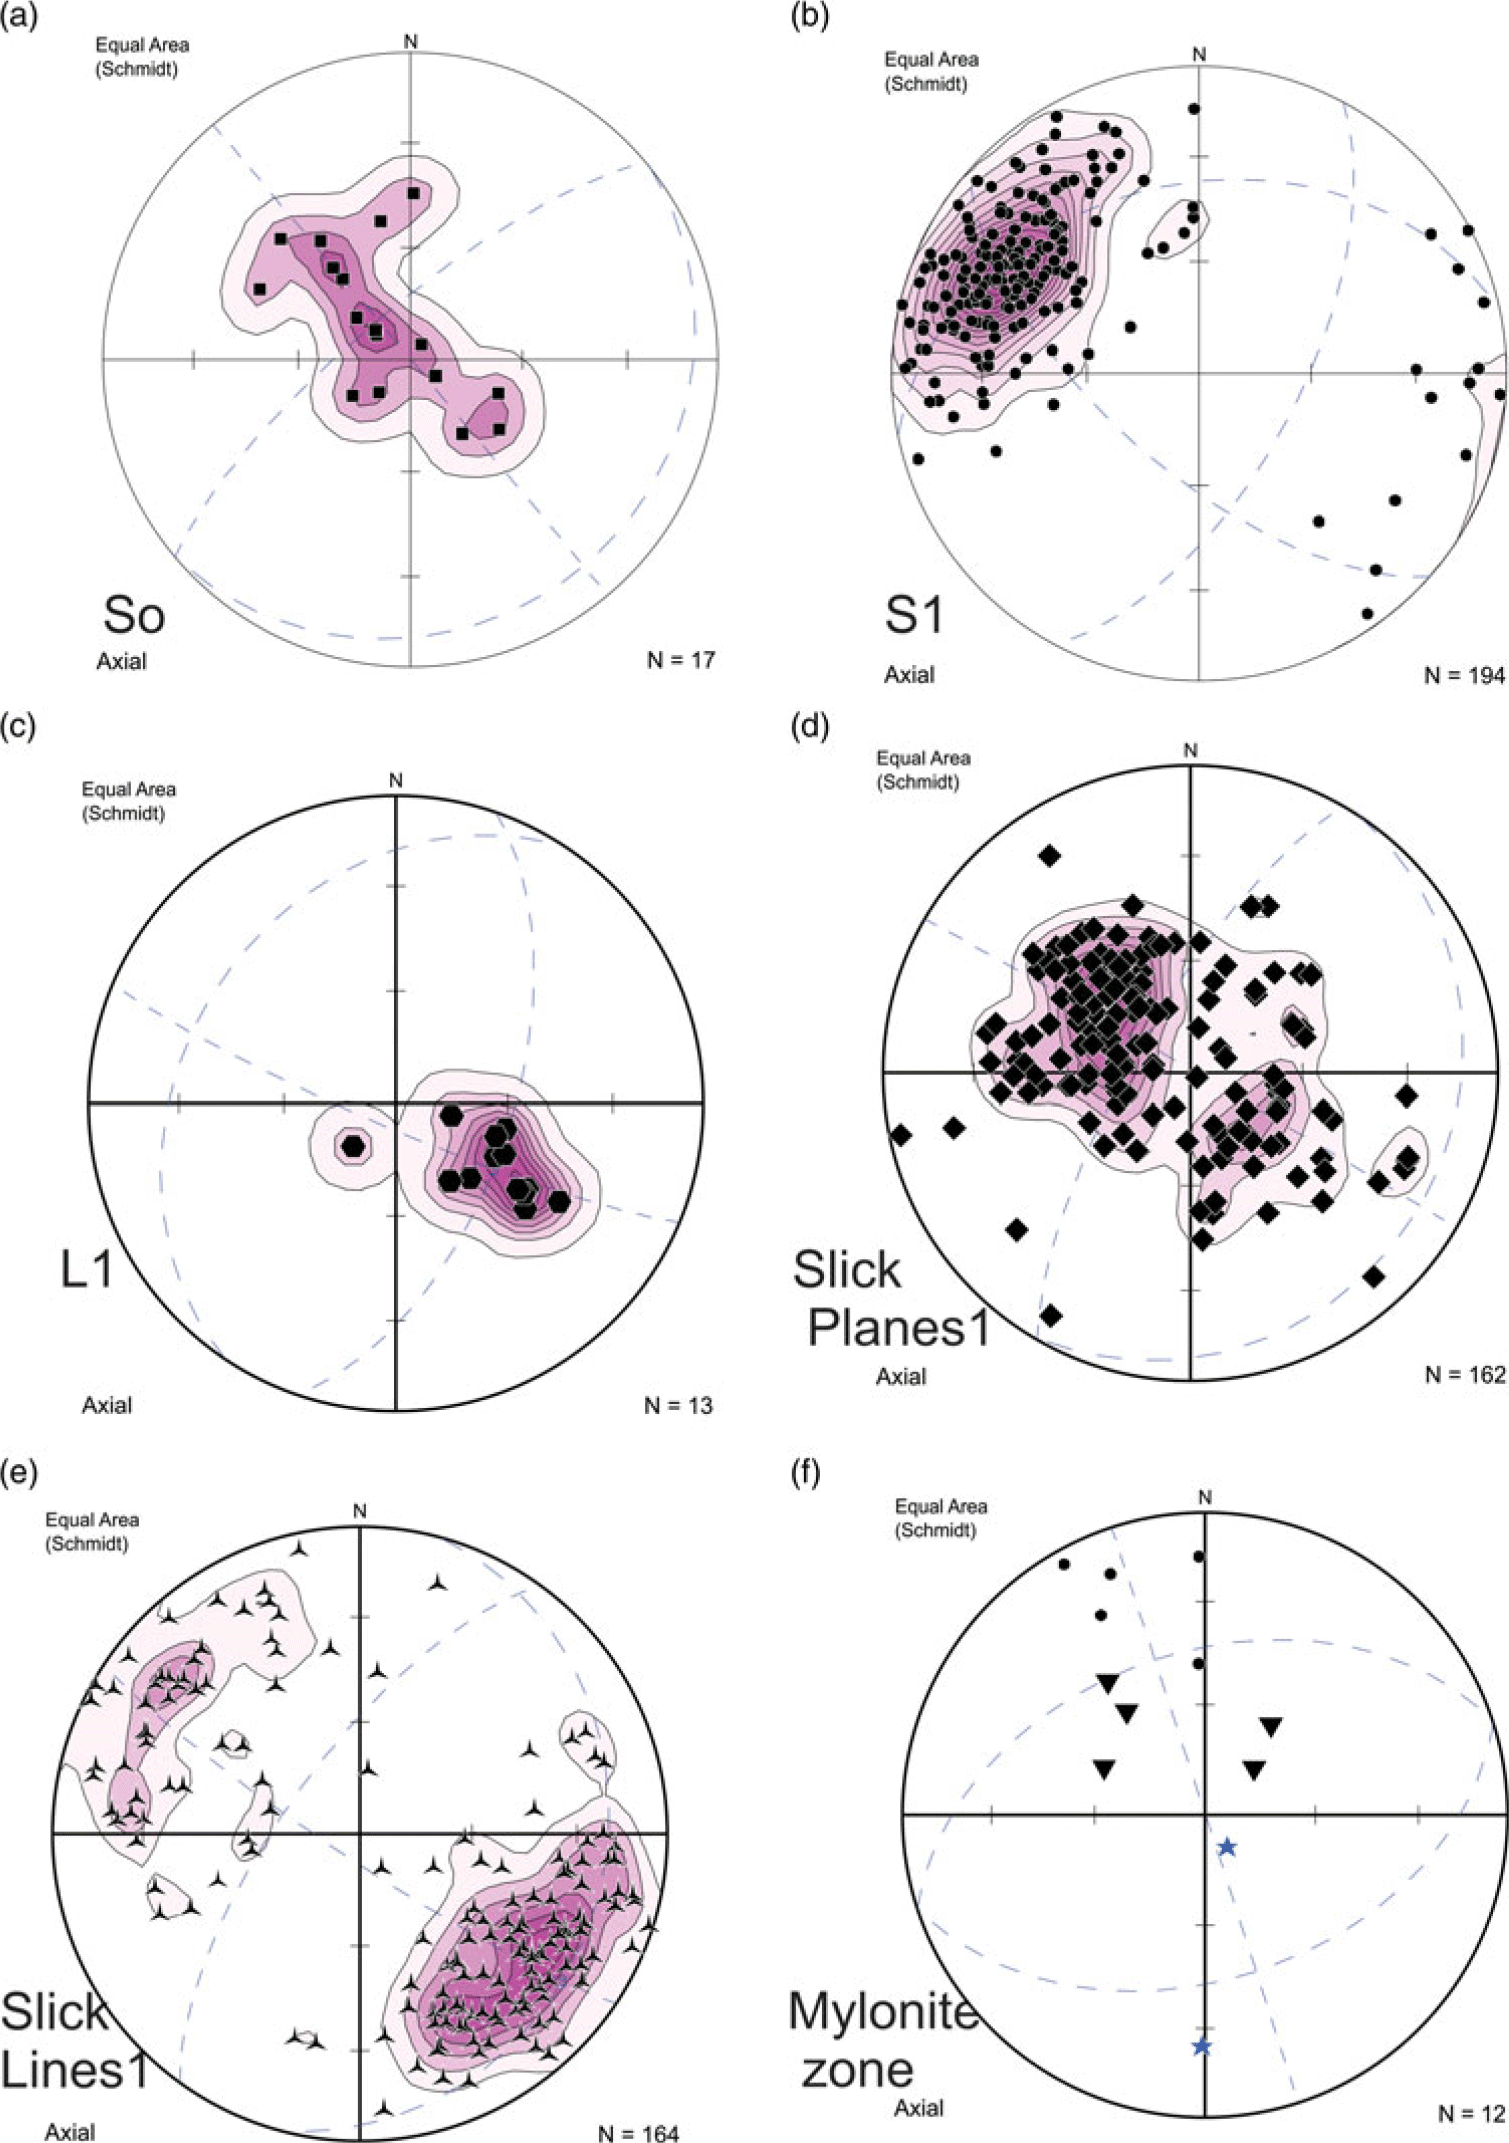
Primary structures defining layering are rarely observed, with the clearest examples being seen at Snokjerringa, the nunatak furthest removed from the Jutulstraumen in the west (Fig. 4) and from Snokallen. Pi pole plots of primary layering, the data for which are mostly derived from Snokjerringa, define a π girdle oriented NW–SE (Fig. 7a), consistent with folding about a near-horizontal NE–SW-oriented fold axis. The SE-dipping layers dip shallowly to moderately (∼45–50°) whereas the NW-dipping layers dip shallowly, suggesting slightly asymmetric folding (Fig. 7a) and a NW-dipping, SE-vergent axial plane. This folding has the same top-to-SE folding orientation described by Watters et al. (Reference Watters, Krynauw, Hunter, Thomson, Crame and Thomson1991). In contrast, schistose planar foliations in the area are strongly developed in the east along the edge of the Jutulstraumen Glacier and are typically steep, dipping dominantly to the SE (Fig. 7b), with primary structures no longer recognizable. Sparse mineral and stretching lineations observed on the foliation planes similarly plunge steeply to the SE (Fig. 7c).
Contoured stereographic projections of (a) poles to primary layering from Snokjerringa defining gentle open folding with NE/SW-oriented fold axis; (b) poles to planar S1 fabrics from the strongly sheared lavas in the west; (c) mineral and stretching lineations; (d) poles to slickensided fault surfaces; (e) lineation directions from slickensided fault surfaces; (f) structural data from the mylonite exposure described in Figure 8. Small dots are poles to planar fabrics in the country rock, inverted triangles are poles to mylonitic layering and stars are lineations in the mylonite and thrust-fault splay plane.

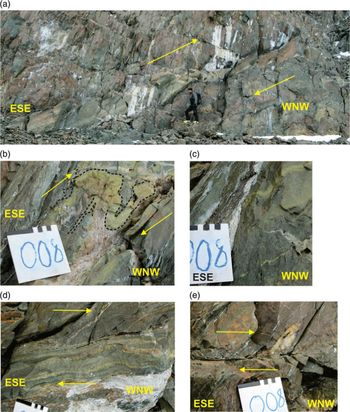
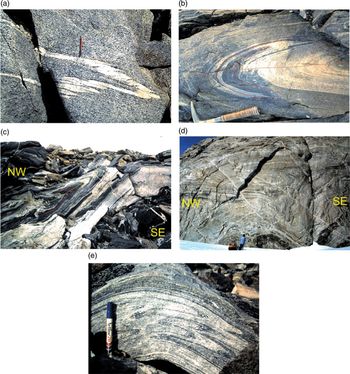
The nunatak group Trollkjellpiggen (Fig. 4) can be divided into an east and a west exposure. At the most southerly exposure of the west nunatak (locality 7, Fig. 4), a well-developed SE- dipping mylonite layer, c. 0.7 m thick, is exposed over c. 25 m before disappearing under scree rubble (Fig. 8a). Adjacent to the mylonite, the rocks have a strong planar fabric, discordant to sub-parallel to the mylonite layer (Fig. 8d), as well as several small splay offshoots (Fig. 8e). One of these splay offshoots shows clear top-to-NW drag features with truncation of a ∼10 cm ovoid quartz lens (Fig. 8e). Within the mylonite band itself, flow folds with top-to-the west geometry are defined by pale green epidote-rich layers (Fig. 8b) as well as localized truncations of internal layering (Fig. 8c). Structural data from this splay offshoot fault are presented in Figure 7f which shows steep SE-dipping planar fabrics, shallower SE-dipping mylonitic layering and steep to shallow, S-plunging lineations. Locally, the mylonite zone is truncated by folded sub-horizontal quartz veins, indicating that quartz veining post-dated the mylonitization.
Photographs of structures recorded in Straumsnutane at locality 7 (Fig. 4). (a) View facing southwards showing a 1–2 m thick ultramylonitic layer, inclined from top right to bottom left, at SW Trollkjellpiggen. Person at lower centre for scale. The structures suggest a top-to-NW sense of shear. (b) Detailed annotated photograph showing a flow fold within the mylonitic layer defined by a pale-green epidote-rich layer showing a top-to-the-NW sense of movement. (c) Photograph of truncation of an epidote-rich layer by younger ramp structure. Note the folded quartz vein at lower right. (d) Photograph of the angular contact between the ultramylonite layer (below) and the foliated basaltic andesite above, showing a top-to-NW shear sense. (e) Photograph of a truncated quartz lens by a thrust-fault splay off the mylonite–ultramylonite layer above showing a top-to-NW shear sense.

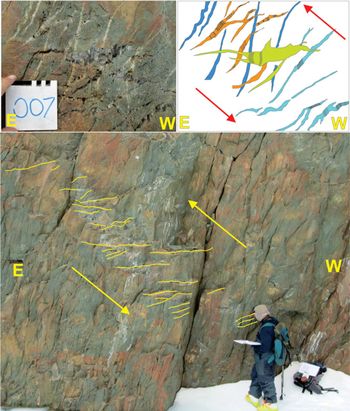
In a small wind scoop, c. 15 m E of the mylonite band, multiple phases of quartz en-echelon vein systems are seen (Fig. 9). Four relative ages of veins can be identified from cross-cutting relationships (Fig. 9 top left and right). The oldest phase of veins is oriented near vertical and shows weak folding (Fig. 9 top left and right). In addition, the filling of the oldest vein does not show any preferred crystal orientation growth. In contrast, the younger vein phases show fibrous quartz growth, with the fibres mostly straight and orthogonal to vein margins, with curvilinear fibre growth being seen locally. The younger veins dip either to the east or are near-horizontal, with some of the veins being weakly sinusoidal. The vein array envelope at this locality dips westwards at ∼45° (Fig. 9 bottom). In those veins showing quartz fibre fills, the orientation of the quartz fibres is dominantly near-vertical, with minor steeply west-dipping fibres or curvilinear fibre growth (Fig. 9 top right). The dip of the vein array, with the weakly sinusoidal shapes, as well as the apparent rotation of veins from near-horizontal to near-vertical with increasing age, suggests a top-to-the-east geometry as shown in Figure 9 (Bons et al. Reference Bons, Elburg and Gomez-Rivas2011), with vein orientations being progressively rotated in an anticlockwise manner.
Photographs of structures recorded in the Straumsnutane area at locality 7 (Fig. 4). (Bottom) En-echelon quartz vein array in the edge of a wind scoop (person for scale). (Top left) Photograph showing different generations of en-echelon quartz vein generations at locality 7. The white square is 10 × 10 cm. (Top right) Sketch figure of veins at top left showing the observed veins and their relative age relationships as well as the orientation of fibrous quartz crystals within the veins shown as black lines. Blue is oldest, orange is intermediate age, green is youngest. The veins reflect an anticlockwise rotation of top-to-SE with relative age.

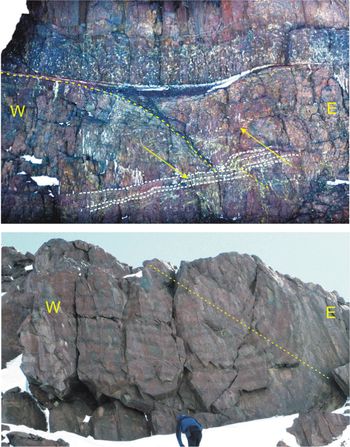
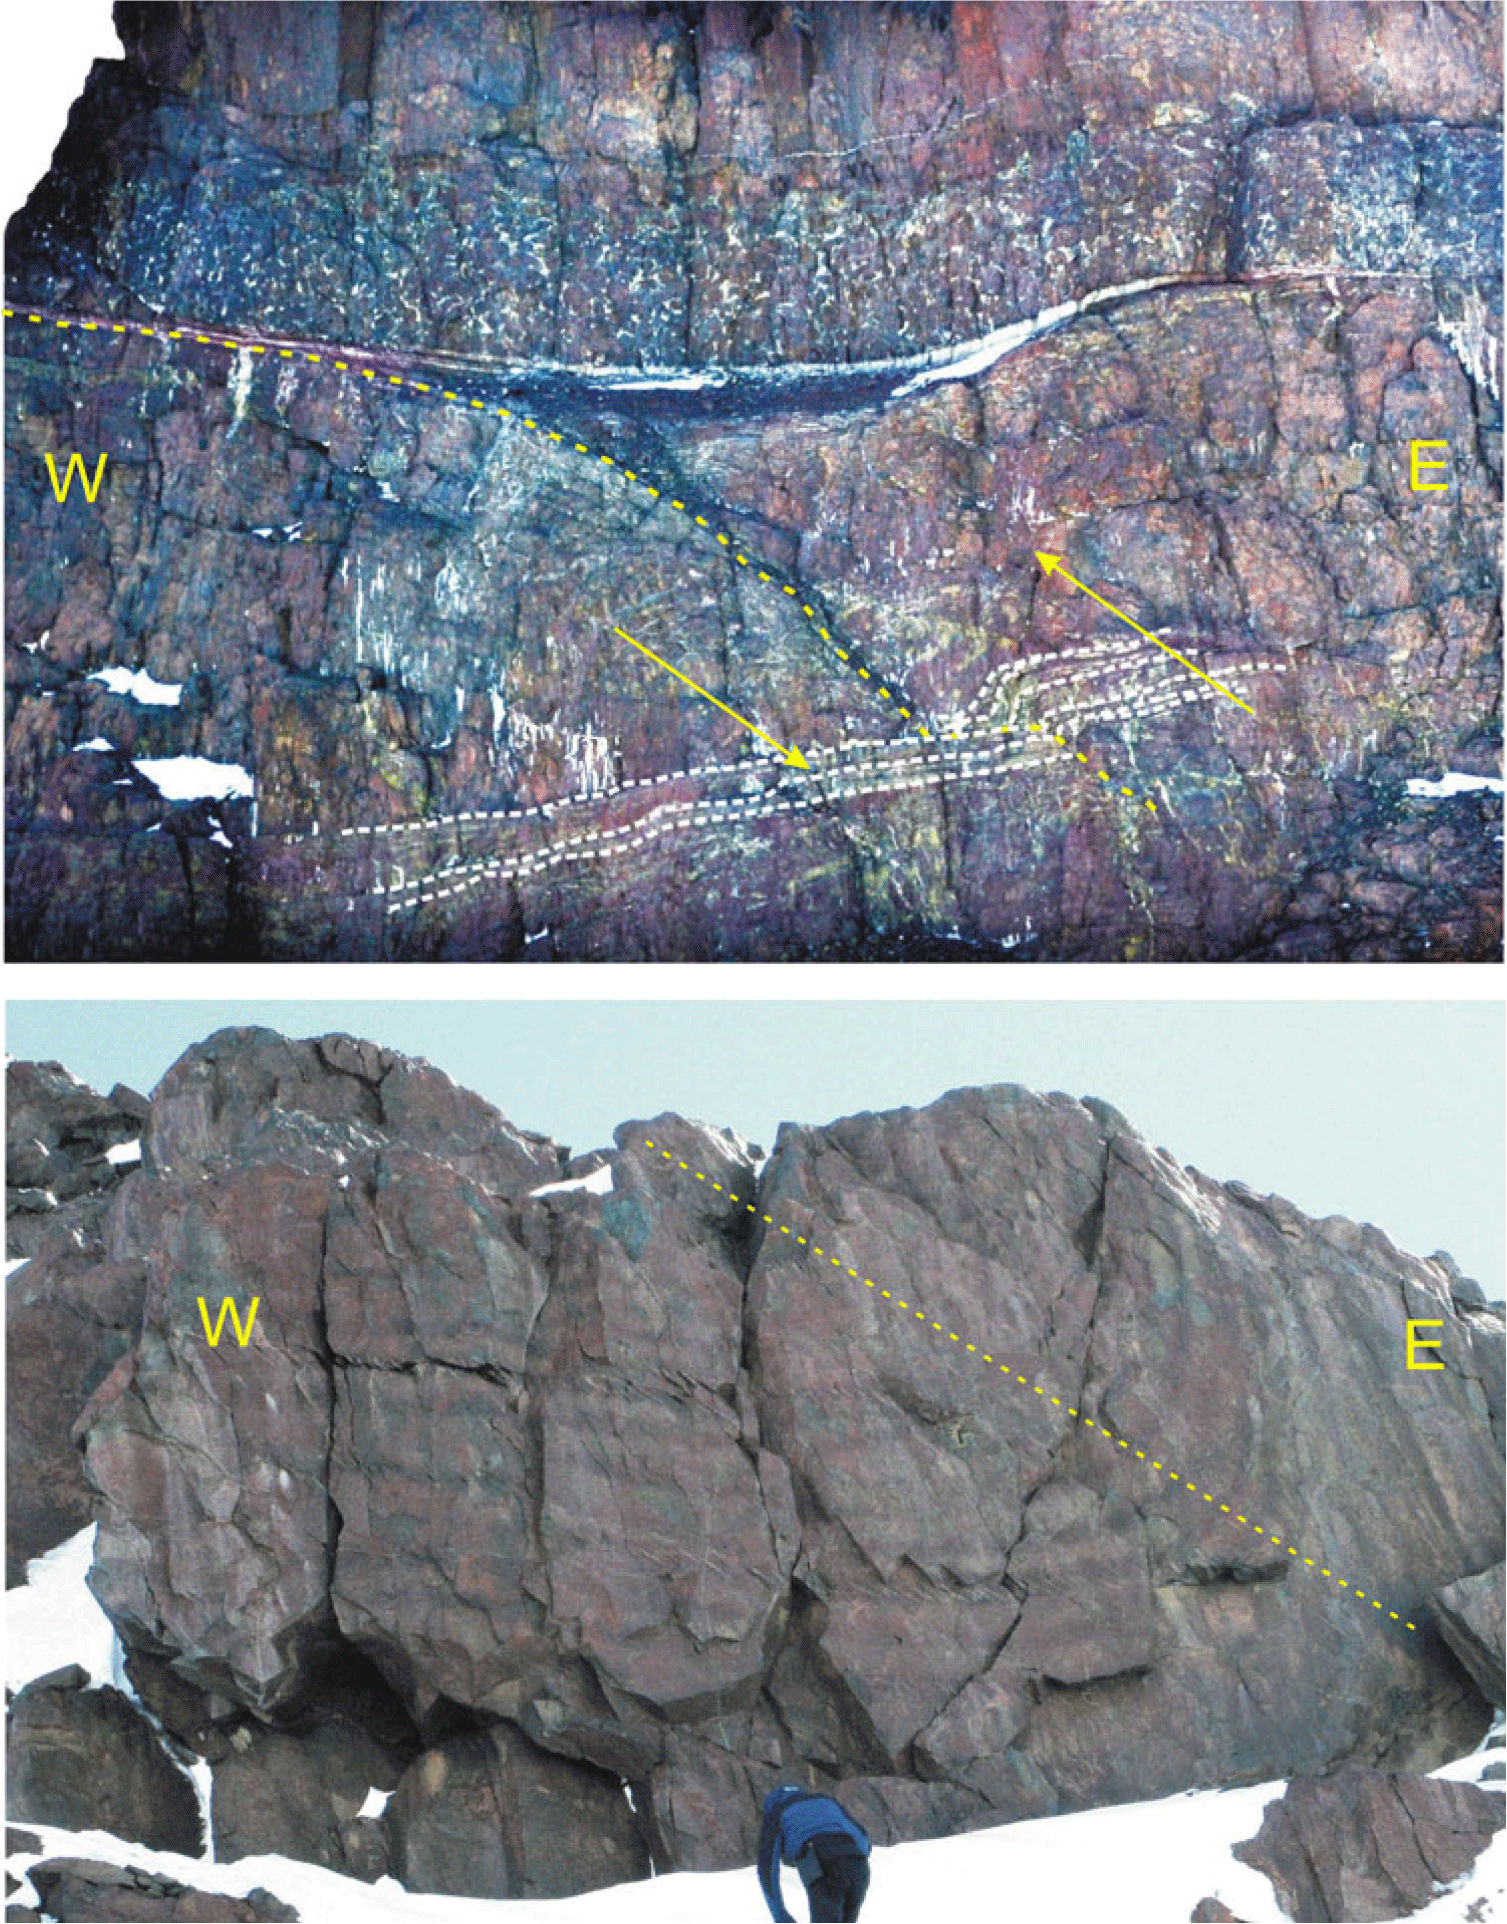
In the exposure on the southern wall of Snokallen (locality 114; Figs 4 and 10 top), a well-defined thrust fault is evident with a top-to-west geometry, similar to the structure at SW Trollkjellpiggen shown in Figure 8. This structure was previously described and similarly interpreted in a sketch by Spaeth (Reference Spaeth and McKenzie1987). In the exposure, it is clear that the layering of overlying sedimentary and pillowed volcanic rocks is not disrupted by the thrust fault (Fig. 10 top), suggesting that the deformation was syndepositional. This inference would consequently constrain the top-to-the west deformation as being of Mesoproterozoic age. A large mesoscale fold with similar WNW-vergent axial plane and coarse axial planar-oriented veins (nunatak 1090; Figs 4 and 10 bottom) has a similar top-to-the-NW sense of deformation to the mylonite at Trollkjellpiggen and thrust fault at Snokallen. These large mesoscale structures suggest top-to-NW deformation during the Mesoproterozoic volcanism and sedimentation in Ahlmanryggen.
Photographs of structures recorded in the Straumsnutane area at locality 114 (Fig. 4). (Above) View northwards at the southern end of Snokallen, showing a thrust fault with top-to-the-west geometry. Note the sediment and pillow-lava layers at the top of the sequence are unaffected by the faulting, suggesting that the faulting was syndepositional. This locality is similarly described and interpreted by Spaeth (Reference Spaeth and McKenzie1987). (Below) Photograph viewed facing north of a synclinal fold defined by layered basaltic andesite at nunatak 1090 (Fig. 4) with top-to-the-west vergence. Note the inclined axial planar fabric preferentially developed in some layers. Dashed line is an inferred axial plane.
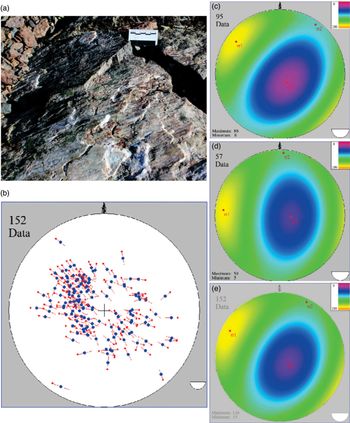
At almost all nunataks in the area, quartz-rich slickensided fault surfaces with varying attitudes and senses of movement with strong lineations are seen (Fig. 11a). Most are typically coated by pale-green amorphous epidote-rich layers and quartz. These slickensided surfaces truncate the planar fabrics at some localities, as well as the mylonite zone in Figure 8, indicating that they appear to be the youngest generation of structures in the area. Their attitudes are shown in Figure 11b, which shows WNW- and ESE-dipping slickensided fault planes, with low angles of dip generally. Hanging wall movement is almost invariably upwards or reverse, with only very few examples of oblique or strike-slip fault movement. Application of the right dihedral method (Angelier & Mechler, Reference Angelier and Mechler1977) was undertaken using Fabric 8 software for palaeostress analysis, using measurements from various individual nunataks and from the area as a whole. The data suggest that the slickensides have resulted from brittle shear with a sense of shear towards both the WNW and ESE (Fig. 11b–e), with σ1 plunging gently towards the WSW. It is possible that these relatively young structures are similar in age to the cross-cutting en-echelon quartz veins, which suggested east-vergent geometry, and thus they are inferred to have formed part of the same deformational phase, having similar senses of shear orientation, and similarly orientated palaeostress ellipsoids. Peters et al. (Reference Peters, Haverkamp, Emmermann, Kohnen, Weber, Thompson, Crame and Thompson1990) reported K–Ar ages of 526 ± 11Ma and 522 ± 11Ma from syntectonic white mica from these structures.
(a) Photograph of an epidote-coated slickensided fault surface with strong lineations typical of many of the planes seen in Straumsnutane. (b–e) Stereographic projections summarizing the orientation of palaeostress interpreted from slickensided fault plane data using Fabric 8 software. (b) Hoeppener diagram showing orientation data from the entire area. The diagram shows poles to slickensided fault planes (blue dots) and the direction of slip of the hanging wall (red arrows). (c–e) Palaeostress reconstructions using right dihedral analysis. Cool (blue-purple) colours indicate low stress concentrations; warm (yellow) colours high stress concentrations: (c) Data from the eastern region of the study area (σ1 = 14°/327°; σ2 = 12°/004°; σ3 = 72°/116°). (d) Data from the western region of the study area (σ1 = 17°/294°; σ2 = 12°/028°; σ3 = 74°/140°). (e) Combined data from the entire Straumsnutane area (σ1 = 20°/303°; σ2 = 12°/038°; σ3 = 72°/148°).

3.b. Western Sverdrupfjella
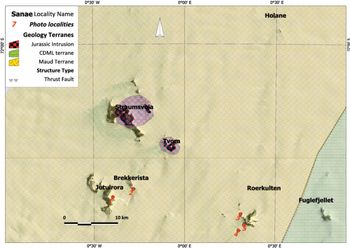
Grantham et al. (Reference Grantham, Jackson, Moyes, Groenewald, Harris, Ferrar and Krynauw1995) subdivided Sverdrupfjella into eastern and western areas (Figs 3, 12). Subsequent analysis of published radiogenic isotope data from the basement gneisses in Sverdrupfjella has shown that nunataks east of and including Fuglefjellet have significantly more juvenile Nd isotopic signatures (εNd(t) between ∼3 and −3) compared to gneisses to the west (εNd(t) between ∼−6 and −15) (Grosch et al. Reference Grosch, Frimmel, Abu-Alam and Košler2015; Grantham et al. Reference Grantham, Kramers, Eglington and Burger2019). In addition, thrust faults with top-to-the-NW sense of displacement are also recognized in most nunataks east of and including Fuglefjellet (Grantham et al. Reference Grantham, Jackson, Moyes, Groenewald, Harris, Ferrar and Krynauw1995), with none recognized in west Sverdrupfjella, west of Fuglefjellet. Pressure–temperature estimates indicate that east Sverdrupfjella is characterized by isothermal decompression paths from c. 1.4 GPa down to c. 0.9 GPa (Groenewald & Hunter, Reference Groenewald, Hunter, Thomson, Crame and Thomson1991; Board et al. Reference Board, Frimmel and Armstrong2005; Pauly et al. Reference Pauly, Marschall, Meyer, Chatterjee and Monteleone2016). In contrast, P–T estimates from west Sverdrupfjella infer maximum pressures of 0.8–0.9 GPa and have a loading anticlockwise P–T path (Grantham, unpub. PhD thesis, Univ. Natal (Pietermaritzburg), 1992; Grantham et al. Reference Grantham, Jackson, Moyes, Groenewald, Harris, Ferrar and Krynauw1995; Grosch et al. Reference Grosch, Frimmel, Abu-Alam and Košler2015). Recognizing the higher pressures in east Sverdrupfjella and the general SE-dipping structural train between east and west Sverdrupfjella, an inverted P–T gradient is apparent, with higher pressure assemblages in east Sverdrupfjella overlying lower pressure rocks in west Sverdrupfjella. Consequently it is inferred that east Sverdrupfjella is allochthonous over west Sverdrupfjella, with the boundary between east and west Sverdrupfjella (Fig. 12) being of a tectonic, structural nature. Grosch et al. (Reference Grosch, Frimmel, Abu-Alam and Košler2015) have also inferred east and west Sverdrupfjella being separated by a tectonic boundary, with east Sverdrupfjella being emplaced tectonically over west Sverdrupfjella. No structural data are provided by Grosch et al. (Reference Grosch, Frimmel, Abu-Alam and Košler2015) in support of the nature of the tectonic boundary.
Map showing western Sverdrupfjella and the names of the various nunataks mentioned in the text and localities where field photos were recorded. The location of this map in Figure 3 shows its extent in western Sverdrupfjella.

Western Sverdrupfjella is underlain by Mesoproterozoic supracrustal gneisses, granitic and metabasic veins and Jurassic alkaline complexes and dolerites. The supracrustal gneisses are subdivided into a Grey Gneiss Complex and Banded Gneiss Complex (Grantham et al. Reference Grantham, Jackson, Moyes, Groenewald, Harris, Ferrar and Krynauw1995), with the Grey Gneiss Complex being interpreted as being dominantly meta-andesitic in composition, typical of island-arc compositions. The Banded Gneiss Complex comprises interlayered quartzofeldspathic to metabasic gneisses, including subordinate rare calc-silicates and semi-pelitic Grt–Bt gneisses. The age and chemistry of the Grey Gneiss Complex are described in Grantham (unpub. PhD thesis, Univ. Natal (Pietermaritzburg), 1992) and Grantham et al. (Reference Grantham, Storey, Thomas, Jacobs and Ricci1997, Reference Grantham, Manhica, Armstrong, Kruger and Loubser2011) with a SHRIMP zircon crystallization age of ∼1140 Ma and metamorphic rim overprints of ∼600–514 Ma. Rocks with composition and mineralogy similar to the Grey Gneiss Complex, but not necessarily of the same age, are subordinate at Fuglefjellet and absent from nunataks east of Fuglefjellet.
3.b.1. Structural data
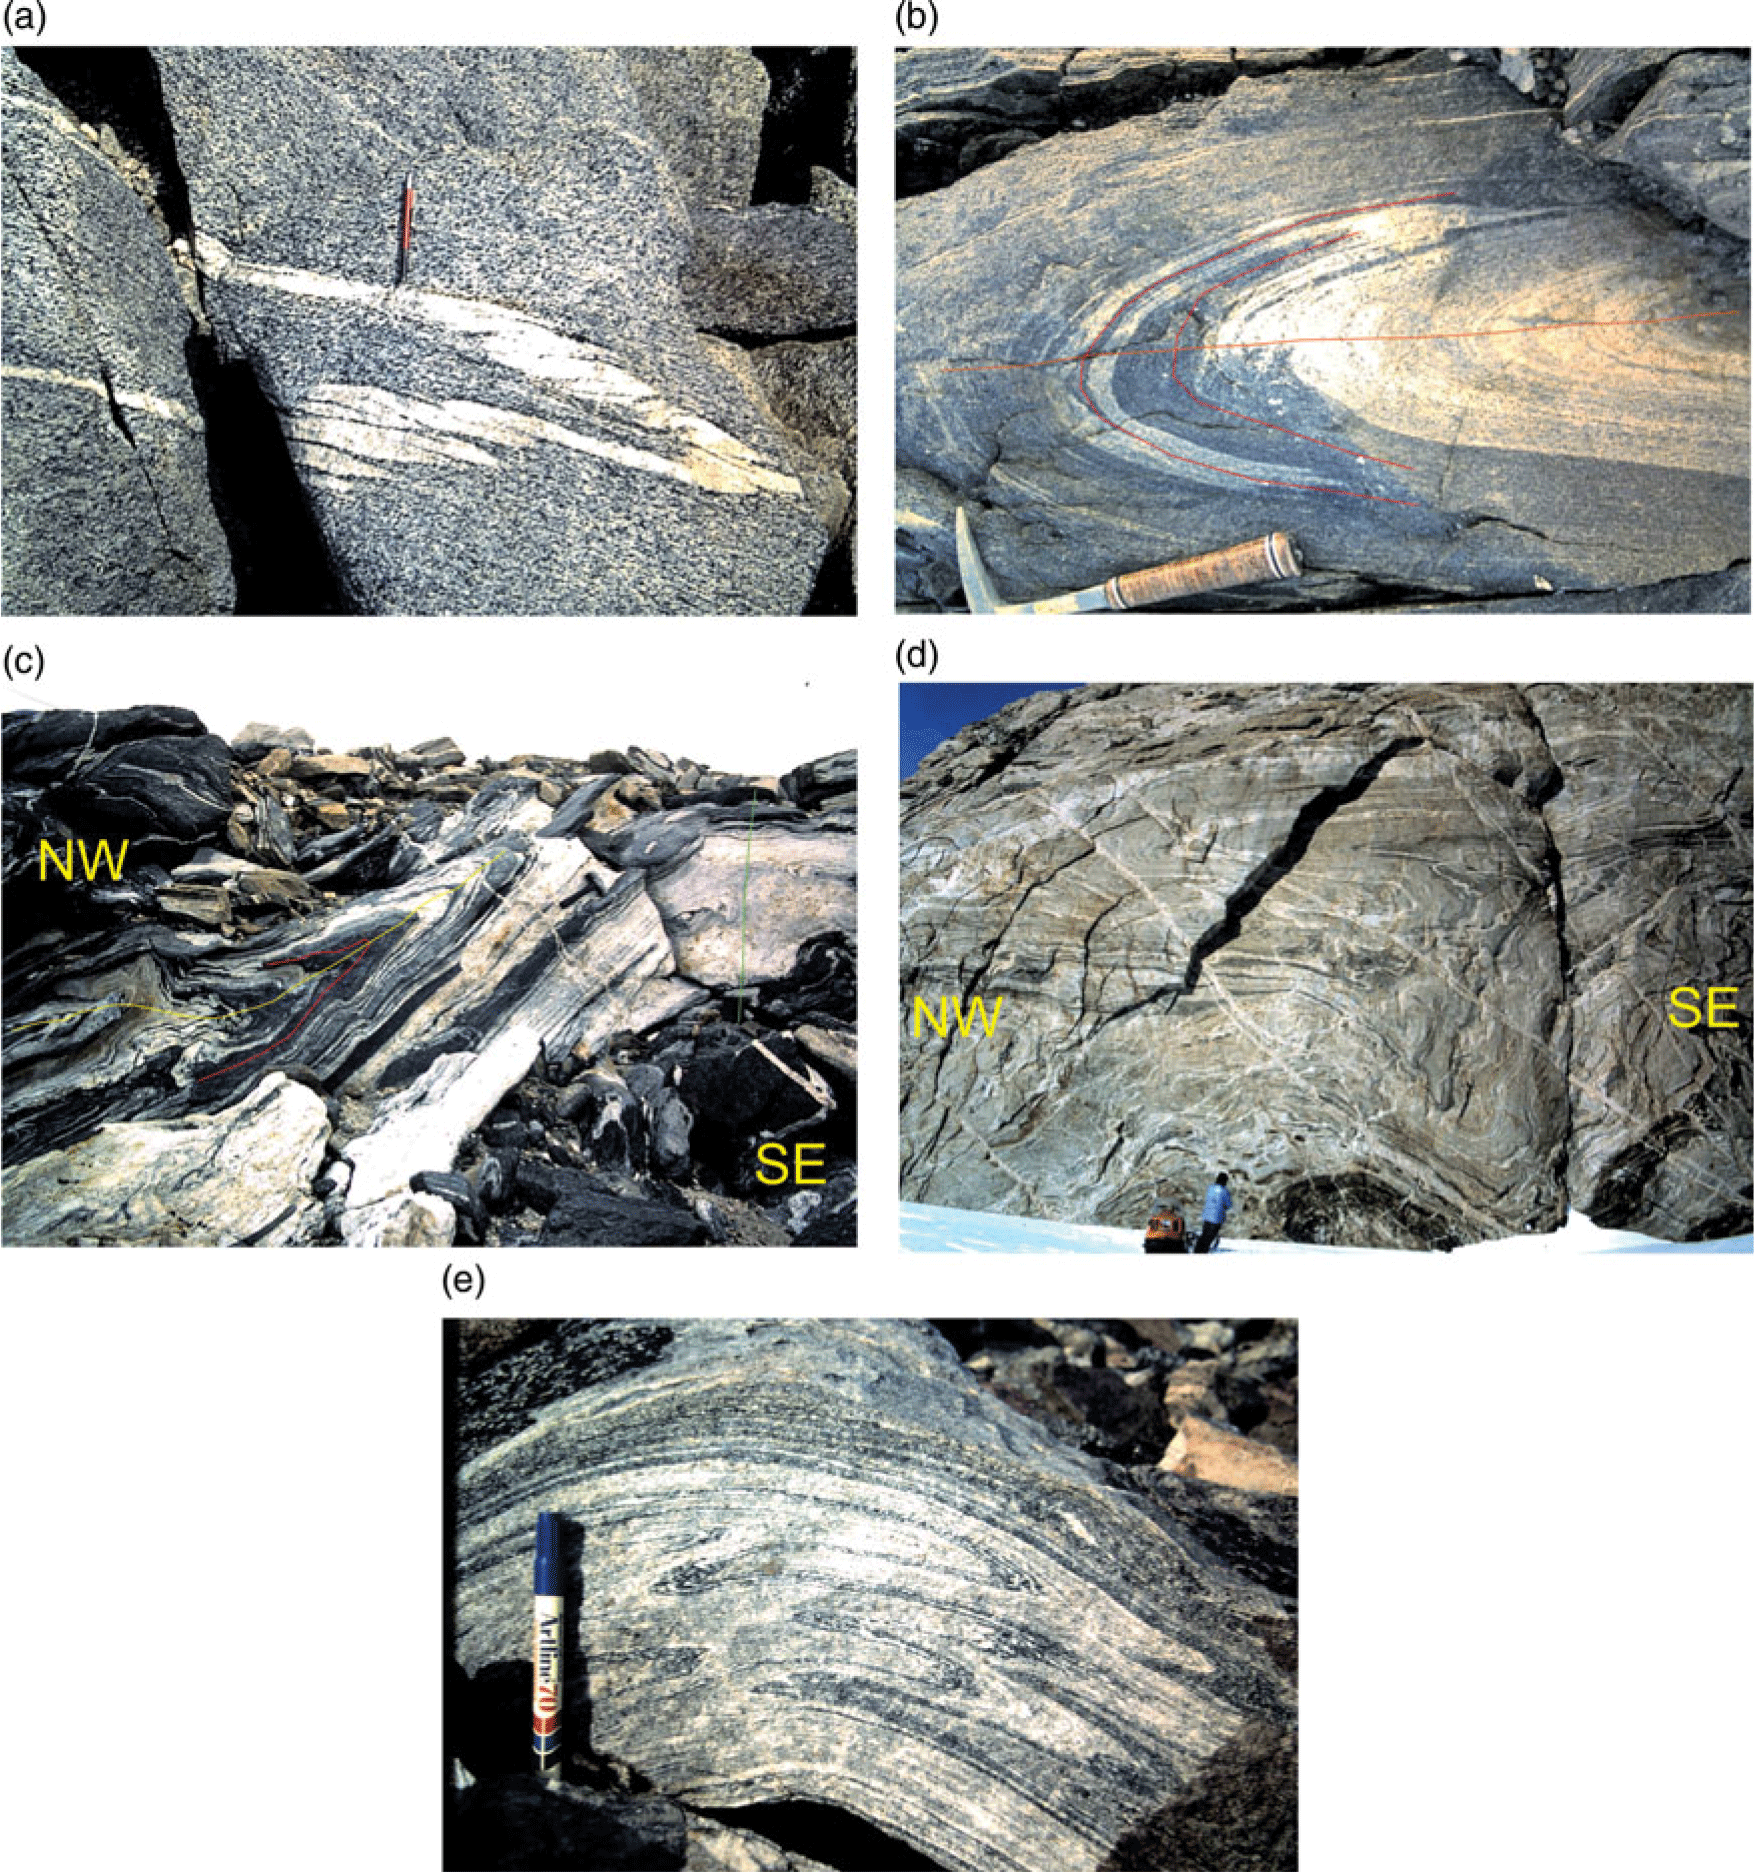
Grantham (unpub. PhD thesis, Univ. Natal (Pietermaritzburg), 1992) and Grantham et al. (Reference Grantham, Jackson, Moyes, Groenewald, Harris, Ferrar and Krynauw1995) have described the structural history of Sverdrupfjella and Kirwanveggan and western Sverdrupfjella respectively, providing regional overview summaries. The data described below, from western Sverdrupfjella, are from Grantham (unpub. PhD thesis, Univ. Natal (Pietermaritzburg, 1992) and represent detailed structural measurements from individual localities which were summarized in Grantham et al. (Reference Grantham, Jackson, Moyes, Groenewald, Harris, Ferrar and Krynauw1995, Reference Grantham, Macey, Ingram, Roberts, Armstrong, Hokada, Shiraishi, Jackson, Bisnath, Manhica, Satish-Kumar, Motoyoshi, Osanai, Hiroi and Shiraishi2008). Four phases of deformation were reported from western Sverdrupfjella. Deformation phases D1 and D2 were described as comprising tight isoclinal recumbent fold phases with top-to-the-N and -NW vergences (Figs 13a, b, c, 14a). D1 folds were recognized as having axial planar foliations (Fig. 13a) whereas D2 folds were recognized in examples where the planar fabric developed during D1 is folded about D2 fold axes (Fig. 13b, c).
Field exposures of structures at various localities in western Sverdrupfjella. (a) Near-recumbent tight F1 fold defined by a migmatitic vein in hbl–bt–qtz–feldspar gneiss. Note the axial planar foliation. (b) Tight recumbent isoclinal F2 fold, refolding an F1 fold defining a Type 3 interference fold pattern after Ramsay (Reference Ramsay1967, p. 531). Axial traces of the F1 and F2 folds are shown in red, as well as the F2 axial plane in yellow. (c) A tight isoclinal F1 fold at centre left (axial plane in red) refolded by a similarly oriented F2 fold (axial plane in yellow) in which the whole structural train is refolded around a F3 fold with ∼vertical axial plane at right (green). The height of exposure is c. 2 m. (d) Partially exposed F3 upright antiformal fold at bottom centre defined by a mafic vein at Roerkulten (locality 5 in Fig. 12). Note the SE-dipping granitic veins and the strong F2 NW-vergent folding above the mafic vein. Person for scale. (e) Tight recumbent isoclinal F2 folds in finely banded gneiss refolded over a F3 open fold.
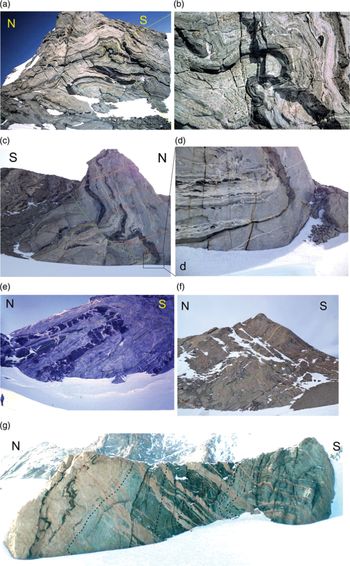
Field exposures of structures at various localities in western Sverdrupfjella. (a) Exposure at Jutulrora (Fig. 12) showing the relative orientations of axial planes for F1 (purple line), F2 (blue line) and F3 folds (green line). (b) An enlargement of the axial plane of the F3 fold in (a). Height of exposure is c. 200 m. (c) Asymmetric synformal fold with S-to-SE vergence at Jutulrora (photo locality 1 in Fig. 12) Structural data from this locality are shown in Figure 15a. Note the N-dipping axial plane and the S-dipping Dalmatian Granite veins as red lines showing dilation ∼perpendicular to the axial plane. (d) Enlarged insert of the fold hinge zone in the box area of (c). Note the axial planar lenticular leucosomes. (e) S-vergent isoclinal inclined fold at Roerkulten (photo locality 4 in Fig. 12). Note the dilation vein orientation of the inter-mafic boudins oriented perpendicular to the axial plane. Fold data from this locality are shown in Figure 15d. (f) Asymmetric synformal fold with southward vergence at Brekkerista (photo locality 2 in Fig. 12). Axial planar trace is shown in green. South-dipping granitic veins are shown in red. Fold data from this locality are shown in Figure 15b. (g) Asymmetric recumbent fold with S-to-SE vergence at Roerkulten and shallow NW-dipping axial plane. Cliff height is c. 100 m. Structural data from this locality are shown in Figure 15c, and the locality is photo locality 2 in Figure 12. Note the SE-dipping pegmatitic veins shown in red, and the axial planar trace shown in green, with the fold closure just above the snow line lower left.
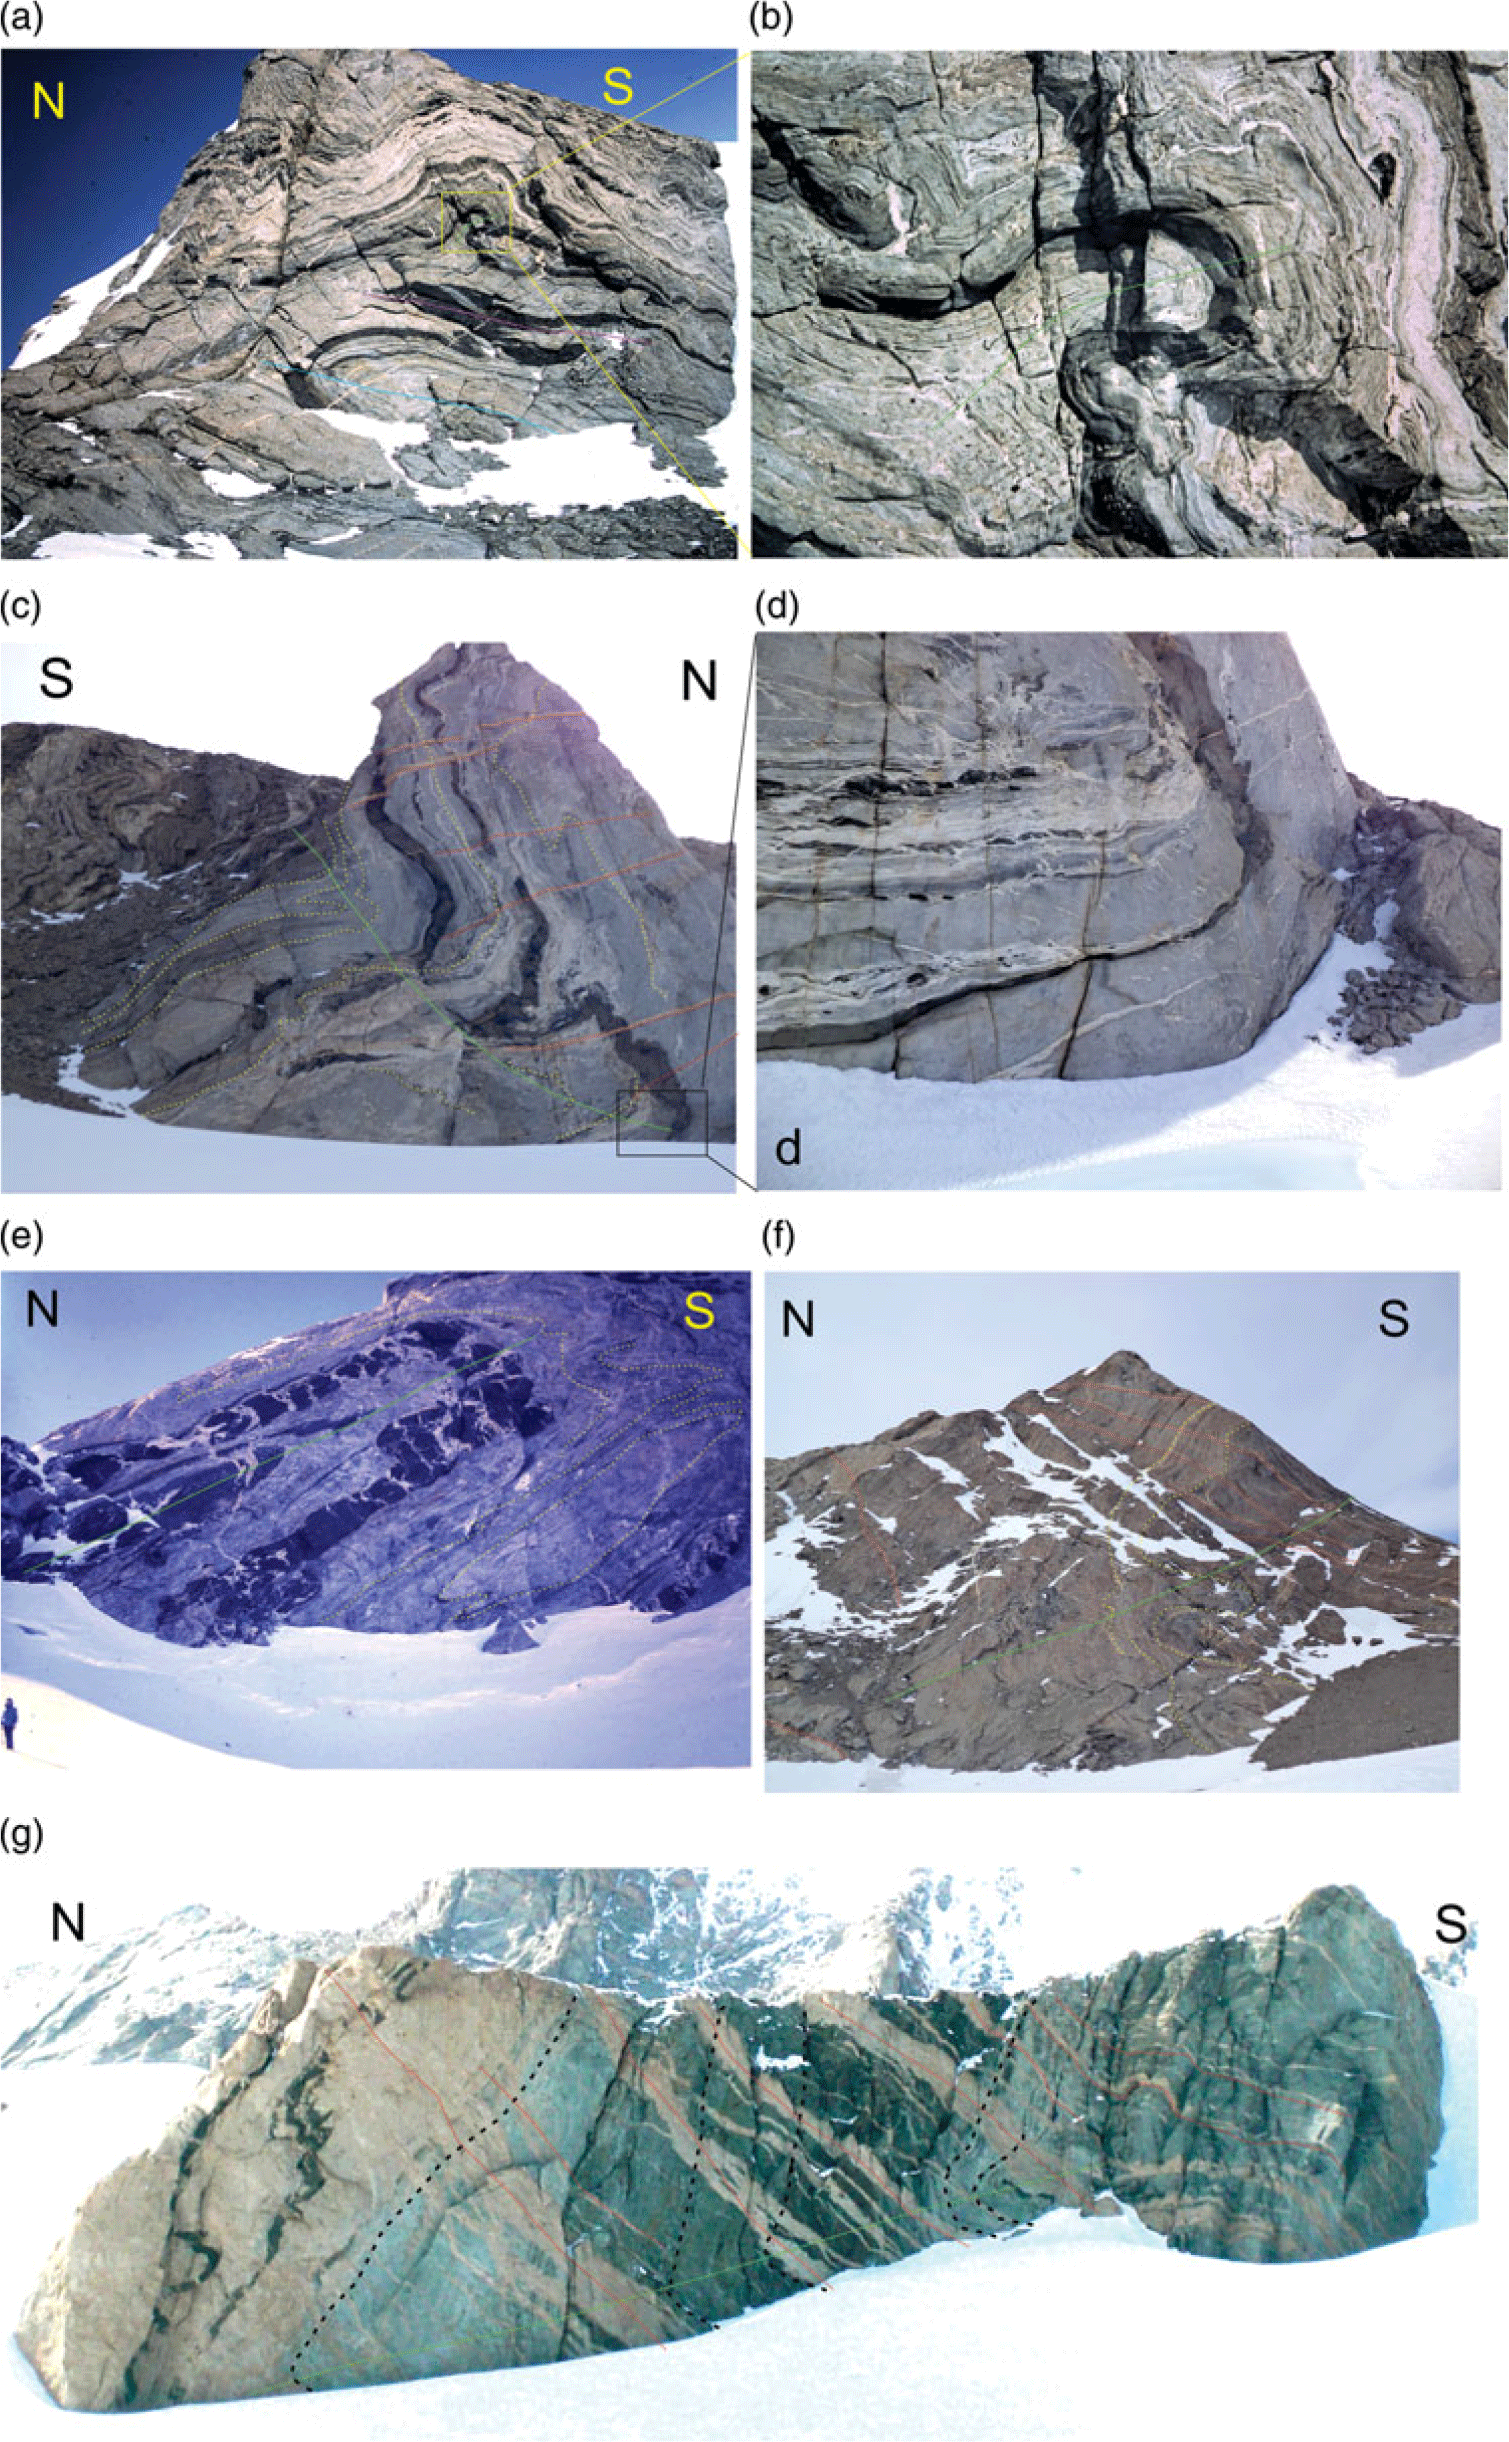
Open folds typical of D3 are also evident in Figure 13b–e. D3 folds were described mostly as open asymmetric, synformal folds with top-to-the-S or -SE vergences (Fig. 14 a–g) with N- to NW-dipping axial planes and near-horizontal E- to NE-plunging fold axes (Figs 14a–g, 15a–f). In Figure 14c, f, g, the exposures are intruded by thin (up to 10 m thick) SE-dipping granitic veins of Dalmatian Granite and pegmatite (Grantham et al. Reference Grantham, Moyes and Hunter1991) which are typically orientated at high angles or perpendicular to the axial planes of these folds. The granite veins are dilational structures whose pole orientation can be inferred to parallel the σ3 axis of strain, prevalent during their intrusion. This orientation/relationship is also observed in Figure 14e where a metabasic layer is boudinaged/segmented, with the individual blocks separated by pegmatitic veins whose dilation direction is perpendicular to the axial plane of the F3 fold. The vergences of the folds in Figure 14a–g permit the inference of a top-to-the-south and -SE tectonic movement.
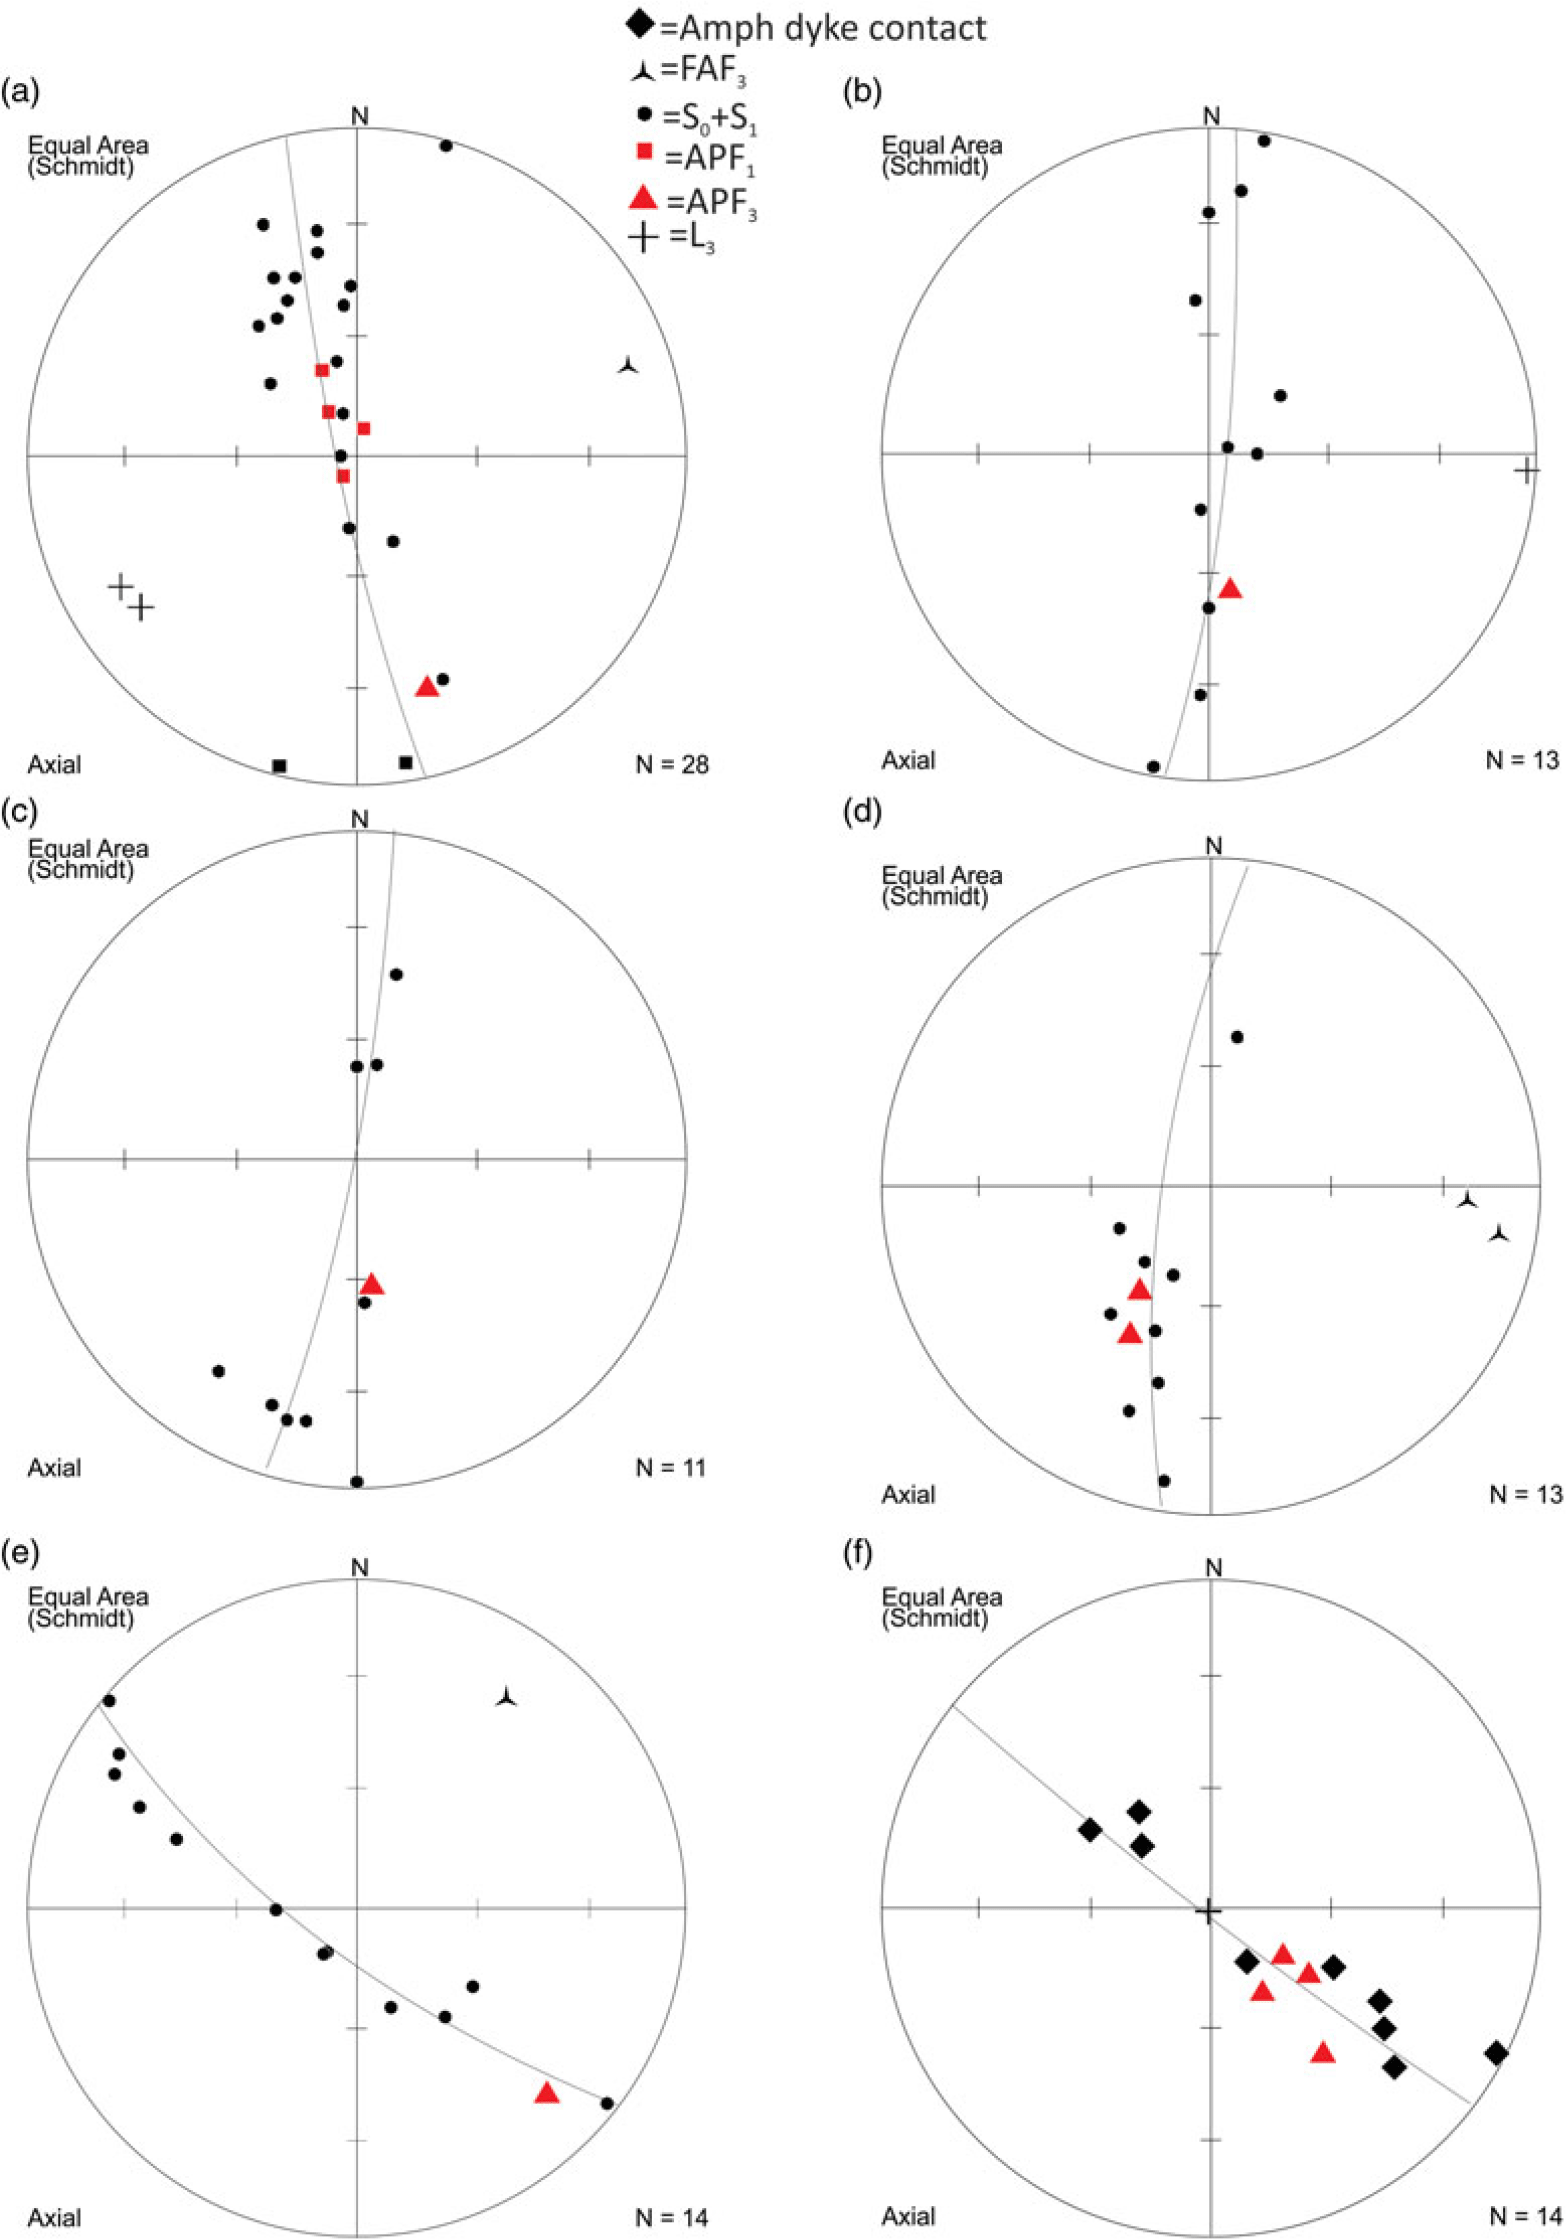
Stereographic projections summarizing structural data from various localities. Abbreviations are FAF2 = Fold axis F2, S0 + S1 = primary and F1 planar fabrics, APF1 = axial plane F1 fold, APF2 = axial plane F2 fold, L3 = lineation D3. (a) Structural data from Jutulrora (photo locality in Fig. 13) and Figure 14c, d. (b) Structural data from Brekkerista (photo locality in Fig. 12) and field photo Figure 14f. (c) Structural data from Roerkulten photo locality in Figure 12 and field photo Figure 14g. (d) Structural data from fold at Roerkulten photo locality 4 in Figure 12 and field photo Figure 14e. (e) Structural data from Roerkulten photo locality 5 in Figure 12. The data represent planar fabrics in gneiss, with the red triangle a measured NW-dipping axial plane. (f) Structural data from Roerkulten photo locality 5 in Figure 12. The black diamond data represent the contact of an intrusive amphibolite dyke, and the red triangles represent NW-dipping measured axial planar foliations in the amphibolite.

Figure 15 summarizes measurements of folds from various localities in western Sverdruprupfjella. Figure 15a represents measurements of the fold shown in Figure 14c, d; it shows a c. N–S π girdle defined by S0 + S1 planar fabrics and defines a shallow plunging fold axis toward ENE. The axial plane dips steeply N. Figure 15b represents measurements from the large fold shown in Figure 14f; it shows a c. N–S π girdle defined by S0 + S1 planar fabrics and defines a near-horizontal fold axis plunging toward E. The axial plane dips at c. 45° toward N. Figure 15c represents the measurements from the large fold shown in Figure 14g at Roerkulten and shows a c. N–S π girdle defined by the granite contact and S1 planar fabrics which define a shallow plunging fold axis toward W. The axial plane dips steeply N. Figure 15d shows measurements from the fold shown in Figure 14e. The layering S0 + S1 dips dominantly N with axial planes dipping at c. 45° toward N and an almost horizontal fold axis plunging E. Figure 15e, f shows measurements from the fold shown in Figure 13d where an amphibolite dyke, described in Grantham et al. (Reference Grantham, Armstrong, Moyes, Hanski, Mertanen, Ramo and Vuollo2006), is folded. The dyke has developed a weak axial planar fabric which dips c. 45° NW. The dyke and planar fabrics in the country rock define a NW-oriented π girdle with near-horizontal NE-oriented fold axes. Common to all the structural measurements of the D3 folds described here in Figures 14 and 15, are folds with N- to NW-dipping axial planes, consistent with top-to-the S and -SE transport, cross-cut by SE-dipping dilational granite sheets.
In east Sverdrupfjella, structures associated with the Dalmatian Granite veins have similarly been interpreted to represent the syntectonic emplacement of the granite with a top-to-the-SE sense of shear (Grantham et al. Reference Grantham, Moyes and Hunter1991, Reference Grantham, Kramers, Eglington and Burger2019). These structures include mesoscale brittle reverse faults displacing granite vein margins but not affecting the vein intrusions, as well as extensional structures displacing earlier vein intrusions along the plane of intrusion of the granite sheets (G Byrnes, unpub. MSc thesis, Univ. Cape Town, 2015; Grantham et al. Reference Grantham, Kramers, Eglington and Burger2019). The displacements of the country rock layering similarly reflect a top-to-the SE deformation. Grantham et al. (Reference Grantham, Moyes and Hunter1991) reported a Rb/Sr whole-rock – mineral isochron of 469 ± 10 Ma for the Dalmatian Granite. This age is supported by a SHRIMP U/Pb zircon age of 489 ± 5 Ma by Krynauw & Jackson (Reference Krynauw and Jackson1996).
4. Discussion and interpretation
From the structures observed in Straumsnutane and their relative ages it can be interpreted that early top-to-NW thrust faults, folds with a horizontal, NE-trending fold axis, and strong SE-dipping axial planar foliations, represent the oldest structures in Straumsnutane, i.e. D1. The inference that some of these structures were syndepositional in Straumsnutane would constrain the age of this deformation to c. <1125 Ma, as indicated by the depositional age of the underlying Ahlmannrygen Group reported by Marschall et al. (Reference Marschall, Hawkesworth and Leat2013) and the age of the Borgmassivet suite of 1107 Ma (Hanson et al. Reference Hanson, Harmer, Blenkinsop, Bullen, Dalziel, Gose, Hall, Kampunzu, Key, Mukwakwami, Munyanyiwa, Pancake, Seidel and Ward2006).
Steeply SE-dipping foliation surfaces (S1), NW-vergent thrusts with well-developed mylonites, and steeply SE-plunging stretching lineations suggest a D1 palaeostress ellipsoid with a gently NW-plunging σ1, horizontal NE-trending σ2 and steeply SE-plunging σ3. Such a stress ellipsoid is similar to that suggested by the D2 structures (Fig. 11; see below). However, the differences in vergence, between the interpreted D1 structures (NW) and D2 structures (WNW, ESE and E), and difference in the style of deformation (ductile D1, exemplified by foliation and mylonitization, cross-cut by brittle/semi-brittle D2, exemplified by slickensided fault surfaces and sigmiodal en-echelon vein arrays respectively), suggests the deformation recorded in the Straumsnutane area occurred in two separate events with D1 top-to-NW and D2 generally top-to-ESE.
Age constraints on the younger top-to-ESE structures (D2) are provided by the K–Ar ages on syntectonic white mica of ∼525 Ma (Peters, Reference Peters1989; Peters et al. Reference Peters, Haverkamp, Emmermann, Kohnen, Weber, Thompson, Crame and Thompson1990) from fault zones in Straumsnutane which were inferred to represent the age of shearing in late-epidote–quartz-filled fault planes (Fig. 11a). Support for this age of the timing of the younger deformation is provided by the broad lower intercept ‘age’ of 600–480 Ma shown by discordant zircons reported by Marschall et al. (Reference Marschall, Hawkesworth and Leat2013) which were interpreted to result from low-grade metamorphism recorded in the rocks.
The c. 1100 Ma-age top-to-NW D1 deformation interpreted for Straumsnutane can be correlated with the D1–2 deformation described by Grantham et al. (Reference Grantham, Jackson, Moyes, Groenewald, Harris, Ferrar and Krynauw1995) for the gneisses exposed in west Sverdrupfjella, where meta-granodoritic rocks with crystallization ages of ∼1140 Ma (Grantham et al. Reference Grantham, Manhica, Armstrong, Kruger and Loubser2011) are reported. Low U metamorphic rims on the zircon grains similarly suggest a timing of metamorphism between 514 and 660 Ma (Grantham et al. Reference Grantham, Manhica, Armstrong, Kruger and Loubser2011). Early Neoproterozoic metamorphism in the Maud Province is inferred from migmatitic layering truncated by a metamorphosed mafic dyke with a poorly defined upper intercept age of ∼950 Ma (Grantham et al. Reference Grantham, Armstrong, Moyes, Hanski, Mertanen, Ramo and Vuollo2006).
The c. 525 Ma top-to-ESE D2 deformation recorded for Straumsnutane can be correlated with D3 deformation described here in western Sverdrupfjella and reported by Grantham (unpub. PhD thesis, Univ. Natal (Pietermaritzburg), 1992) and Grantham et al. (Reference Grantham, Jackson, Moyes, Groenewald, Harris, Ferrar and Krynauw1995). In western Sverdrupfjella, this deformation is expressed as SE-vergent asymmetric folds at Jutulrora, Brekkerista and Roerkulten (Grantham, unpub. PhD thesis, Univ. Natal (Pietermaritzburg), 1992; Grantham et al. Reference Grantham, Armstrong, Moyes, Hanski, Mertanen, Ramo and Vuollo2006) (Fig. 14a, b) with granite vein emplacement in the dilation planes of deformation. These folds have a top-to-SE vergence similar to that described by Watters et al. (Reference Watters, Krynauw, Hunter, Thomson, Crame and Thomson1991) in Straumsnutane, as well as the folding reflected in Figure 7a. The folding (Figs 13d, 15e, f) and metamorphism of a mafic dyke at Roerkulten is consistent with top-to-SE deformation and constrained by the lower intercept date of 523 ± 21 Ma (Grantham et al. Reference Grantham, Armstrong, Moyes, Hanski, Mertanen, Ramo and Vuollo2006). Similarly, in eastern Sverdrpfjella, the syntectonic emplacement of the Dalmatian Granite at ∼470–490 Ma is consistent with a top-to-SE brittle deformation event as indicated by SHRIMP U–Pb zircon data from the Dalmatian Granite indicating a crystallization age of ∼490 Ma (Grantham et al. Reference Grantham, Moyes and Hunter1991, Reference Grantham, Kramers, Eglington and Burger2019; Krynauw & Jackson, Reference Krynauw and Jackson1996). The age of metamorphism in western Sverdrupfjella is supported by a LA-ICPMS (laser ablation inductively coupled plasma mass spectrometer) U/Pb age from titanite from Straumsvola (Fig. 12) of 491 ± 27 Ma reported by Grosch et al. (Reference Grosch, Frimmel, Abu-Alam and Košler2015).
It is significant to note that S- to SE-vergent structures and associated SE-dipping granite sheets are limited to Sverdrupfjella and have not been reported in Kirwanveggan to the S (Grantham et al. Reference Grantham, Kramers, Eglington and Burger2019). Late D3 shearing of Pan-African c. 500 Ma age is inferred as having a top-to-SE sense of shear in Heimefrontfjella; however, no syntectonic granite sheets have been recognized in Heimefrontfjella (Jacobs et al. Reference Jacobs, Bauer, Spaeth, Thomas and Weber1996).
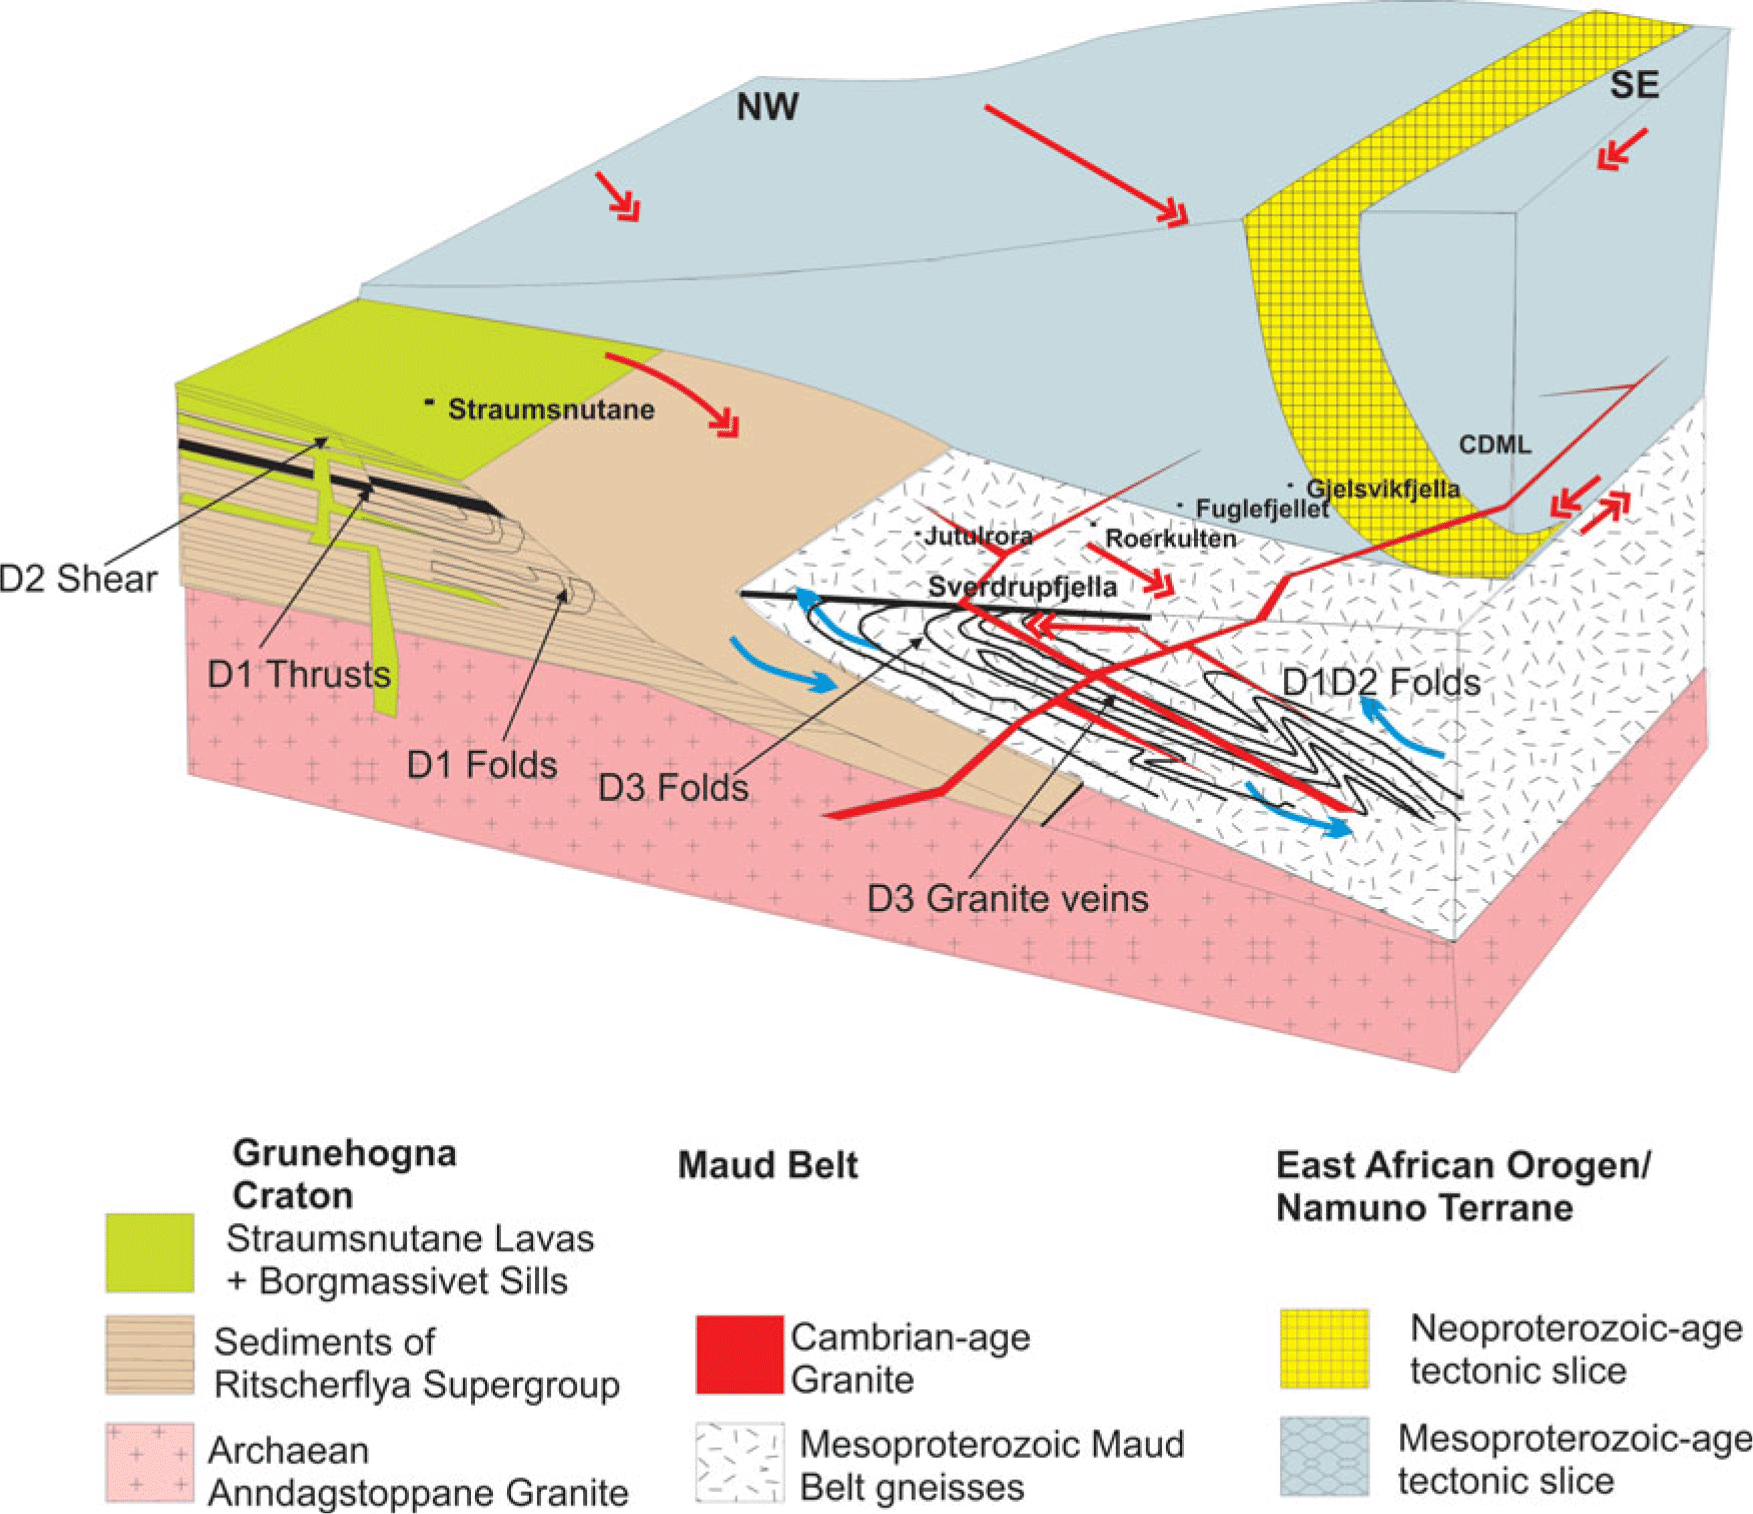
The structural characteristics for Sverdrupfjella described above and from Grantham et al. (Reference Grantham, Jackson, Moyes, Groenewald, Harris, Ferrar and Krynauw1995) have contributed to the interpretation of a mega-nappe structure (Grantham et al. Reference Grantham, Macey, Ingram, Roberts, Armstrong, Hokada, Shiraishi, Jackson, Bisnath, Manhica, Satish-Kumar, Motoyoshi, Osanai, Hiroi and Shiraishi2008, Reference Grantham, Macey, Horie, Kawakami, Ishikawa, Satish-Kumar, Tsuchiya, Graser and Azevedo2013, Reference Grantham, Kramers, Eglington and Burger2019) resulting from the Kuunga Orogeny in which northern Gondwana (the EAO Namuno Terrane of N Mozambique; Figs 2, 16) was emplaced over southern Gondwana between ∼550 and 500 Ma, along a collision zone, between N and S Gondwana (Fig. 2b). The timing of the Kuunga Orogeny, initially inferred as being 570–530 Ma by Meert (Reference Meert2003), is extended to younger ages of c. 480 Ma, inferred from Ar–Ar data from Sverdrupfjella and Kirwanveggan (Grantham et al. Reference Grantham, Kramers, Eglington and Burger2019) as well as the emplacement of granite veins between c. 520 and 490 Ma (Grantham et al. Reference Grantham, Kramers, Eglington and Burger2019). An integral part of the inferred nappe structure is the top-to-SE D3 folds in western Sverdrupfjella (described here) in which these folds are seen as resulting from drag compressional structures in the footwall of the mega-nappe (Fig. 16). Syntectonic emplacement of Dalmatian Granite at c. 490 Ma in both east and west Sverdrupfjella with top-to-SE brittle structures in east Sverdrupfjella constrains the age of the deformation. The correlation of the similarly oriented top-to-ESE D2 structures in Straumsnutane with D3 structures in Sverdrupfjella consequently suggests that the nappe structure probably traversed over the eastern edge of the Grunehogna Craton in NE Straumsnutane, as well as the Maud Belt, causing the top-to-ESE structures recorded in eastern Straumsnutane and the west Sverdrupfjella Maud Belt. This interpretation is consistent with the low-grade metamorphic assemblages recorded in Straumsnutane and discordant zircons reported by Marschall et al. (Reference Marschall, Hawkesworth and Leat2013). Pressure–temperature estimates of ∼350 °C and 0.3 GPa on a metabasite assemblage on the eastern edge of Ahlmannryggen, south of Straumsnutane, have been reported by Grosch et al. (Reference Grosch, Frimmel, Abu-Alam and Košler2015), implying a burial depth of c. 9 km, consistent with the low-grade minerals seen in the D2 structures in Straumsnutane, and are consistent with burial and deformation beneath the nappe. No reliable thickness estimates for the Ritscherflya Supergroup in Antarctica are available, given the absence of continuous exposure in Antarctica and the difficulty of correlating sedimentary and volcanic units between nunataks. However, the Ritscherflya Supergroup is correlated with the Umkondo Group in SE Zimbabwe and central Mozambique (Hanson et al. Reference Hanson, Harmer, Blenkinsop, Bullen, Dalziel, Gose, Hall, Kampunzu, Key, Mukwakwami, Munyanyiwa, Pancake, Seidel and Ward2006), which has an inferred thickness of c. 3.7 km (BM Bene, unpub. PhD thesis, Univ. Kwa-Zulu Natal, 2004). This would suggest that the metamorphic P–T estimates reported by Grosch et al. (Reference Grosch, Frimmel, Abu-Alam and Košler2015) at c. 500 Ma along the margin of the Grunehogna Craton were probably the consequence of tectonic loading in the footwall, and cannot be ascribed solely to depositional burial.
Tectonic schematic interpretation of the relationships between the Grunehogna Craton, the Maud Belt and the EAO Namuno-nappe structure. Single-headed blue arrows reflect senses of shear between different blocks related to D1. Double-headed red arrows reflect inferred senses of shear between different blocks related to D2/3. The types of structures observed with inferred deformational age are shown, as well as relative schematic location in the section of geographic localities reported in the text.

In contrast, in NE Sverdrupfjella, the well-constrained P–T path, reflecting isothermal decompression of c. 1.4 GPa to c. 0.6 GPa from ∼570 Ma to ∼540 Ma from NE Sverdrupfjella (Pauly et al. Reference Pauly, Marschall, Meyer, Chatterjee and Monteleone2016) is consistent with a continent–continent collision setting in which eastern Sverdrupfjella and Gjelsvikfjella formed a hanging-wall block with c. <598 Ma top-to-S and -SSW thrusting (Jacobs et al. Reference Jacobs, Bauer and Fanning2003a, b; Baba et al. Reference Baba, Horie, Hokada, Owada, Adachi and Shiraishi2015). A doubly thickened crust in eastern Sverdrupfjella eastwards is supported by gravity studies (Riedel et al. Reference Riedel, Jokat and Steinhage2012) which indicate crustal thicknesses >42 km over NE Sverdrupfjella, with P–T studies requiring significant erosion to expose high P–T assemblages at current levels.
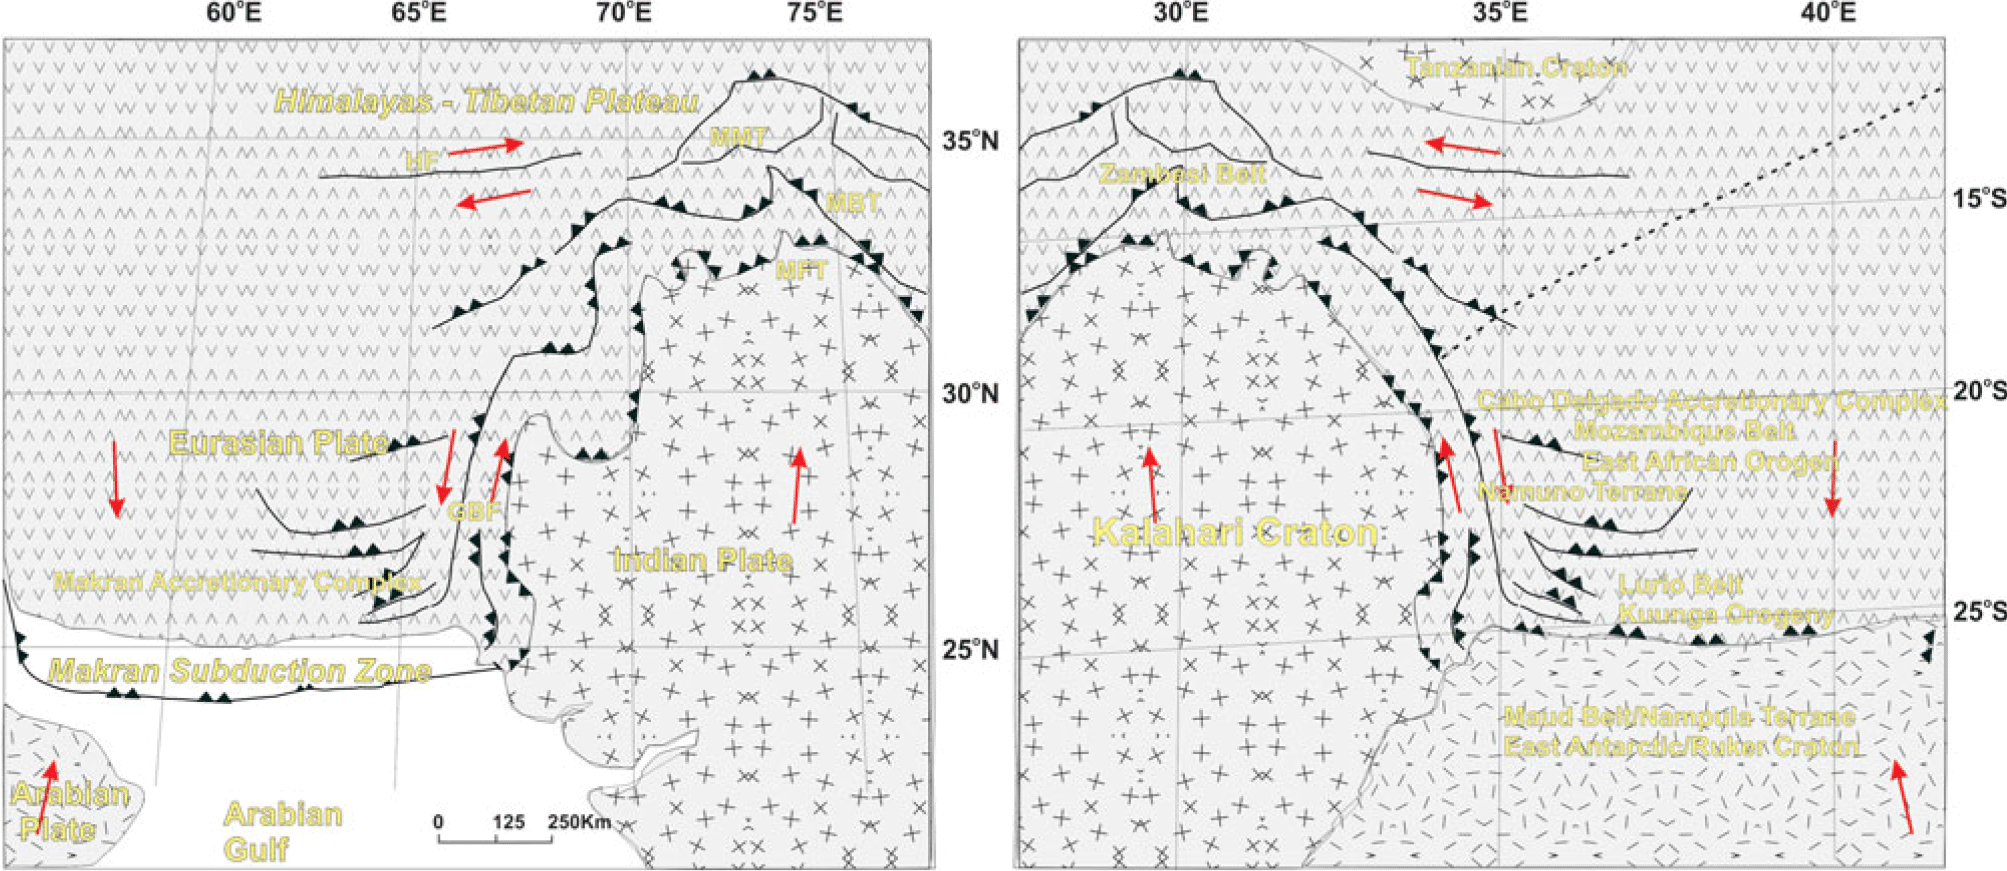
The tectonic setting envisaged is comparable to that seen currently along the western edge of the setting involving India colliding with Eurasia, contributing to the Himalayan Orogeny (Fig. 17a), with the Arabian Plate and India being subducted under Eurasia. Figure 17b shows a modified mirror image of Figure 17a, with appropriately named continental blocks inserted comprising the Kalahari Craton, Maud–Nampula Terranes (footwall) and East African Orogen – Cabo Delgardo Complex – Namuno Terrane (hanging wall). The broad deformation patterns involving tectonic blocks on a similar scale in Mozambique, extending into Antarctica, are similar to those seen in the Himalayan collision zone reflected in Figure 17a. Subsequent erosion of Mozambique and, to a lesser extent, Antarctica has exposed the geology as reflected in Figure 2, in which much of the nappe inferred here and in Grantham et al. (Reference Grantham, Macey, Ingram, Roberts, Armstrong, Hokada, Shiraishi, Jackson, Bisnath, Manhica, Satish-Kumar, Motoyoshi, Osanai, Hiroi and Shiraishi2008) and Grantham et al. (Reference Grantham, Macey, Horie, Kawakami, Ishikawa, Satish-Kumar, Tsuchiya, Graser and Azevedo2013, Reference Grantham, Kramers, Eglington and Burger2019) has been removed by erosion related to uplift, particularly over western Sverdrupfjella.
(a) Plates and major structures associated with the collision between Eurasia in the north and India and Arabia in the south, with the latter plates being subducted under Eurasia. Structure names and configuration are from Crupa et al. (Reference Crupa, Khana, Huang, Khan and Kasib2017). MBT = Main Boundary Thrust. HF = Heart Fault. MFT = Main Frontal Thrust. MMT = Main Mantle Thrust. GBF = Ghazban Fault. (b) Modified mirror image of Figure 15a showing an inferred schematic similar configuration reflecting the Kuunga Orogeny collision between the Kalahari Craton (S Gondwana) and the Tanzanian Craton (N Gondwana) along the Damara–Zambesi–Lurio belts. The dashed line reflects the approximate present-day position of the Lurio suture under the hanging-wall block.

5. Conclusions
The deformation history of Straumsnutane involved D1 top-to-the-NW thrust faulting and folding at c. 1100 Ma, with similarly oriented deformation of similar age being seen in W Sverdrupfjella to the east. D1 deformation in Straumsnutane was followed by D2 deformation comprising conjugate top-to-the-ESE and -WNW deformation involving brittle semi-ductile quartz veining, SE-vergent folding and mesoscale faulting, with the timing of this deformation constrained by low-grade metamorphism at ∼525 Ma. The deformation geometry of top-to-ESE and timing at ∼525 Ma is similar to that recorded for D3 in Sverdrupfjella.
No evidence of sinistral displacement, consistent with a continent-scale sinistral strike-slip system, as inferred for the EAO, along the boundary between the Grunehogna Craton and the Maud Belt, interpreted by M Croaker (unpub. MSc thesis, Univ. Natal) and Perrit & Watkeys (Reference Perrit, Watkeys, Storti, Holdsworth and Salvini2003), has been seen in Straumsnutane or west Sverdrupfjella. In contrast, the D2 deformation in Straumsnutane and D3 in Sverdrupfjella are consistent with collisional structures with southward vergence. The D3 deformation, metamorphism and intrusion of granites in Sverdrupfjella has been interpreted as resulting from the location of the area in the footwall of a south- to SE-emplaced mega-nappe structure (Grantham et al. Reference Grantham, Macey, Ingram, Roberts, Armstrong, Hokada, Shiraishi, Jackson, Bisnath, Manhica, Satish-Kumar, Motoyoshi, Osanai, Hiroi and Shiraishi2008). The similarities in timing and style of deformation for D2 in Straumsnutane with that of D3 in Sverdrupfjella would suggest that the nappe structure was not restricted to the Maud and CDML terranes but also partially overlapped onto and was restricted to the eastern edge of the Grunehogna Craton in Straumsnutane, with the western Straumsnutane, Ahlmanryggen and Borga areas showing no similar deformation. This conclusion is supported by the relatively high pressures of metamorphism along this margin, implying burial of c. 9 km. Late (Pan-African) D3 shearing in Heimefrontfjella similarly has a top-to-SE sense of shear (Jacobs et al., Reference Jacobs, Bauer, Spaeth, Thomas and Weber1996). Grantham et al. (Reference Grantham, Kramers, Eglington and Burger2019) concluded that deformation along the eastern margin of the Grunehogna Craton did not affect southern Kirwanveggan and hence did not extend to Heimefrontfjella, the oblique strike-slip shearing in Heimefrontfjella probably continuing northeastwards along the Forster Magnetic lineament to the Orvinfjella Shear zone in CDML. The deformation trajectories and related P–T conditions described here for c. 525–480 Ma deformation in Straumsnutane and Sverdrupfjella, and associated melting in Sverdrupfjella, as well as the published gravity data are consistent with the thickened crust mega-nappe model proposed for the Kuunga Orogeny in the WDML sector of Antarctica. On a wider scale, a top-to-S low-angle brittle shear zone with an age of <530 Ma has been described from Sør Rondane (Tsukada et al. Reference Tsukada, Yuhara, Owada, Shimura, Kamei, Kouchi and Yamamoto2017) (Fig. 2). Similarly, the Kataragama Klippen in Sri Lanka is interpreted as an erosional remnant of a top-to-S (in Gondwana framework) thrust nappe (Silva et al. Reference Silva, Wimalasena, Sarathchandra, Munasinghe and Dasannayake1981) (Fig. 2) in which the Highlands Complex has been emplaced over the Vijayan Complex. This suggests the mega-nappe extended from the overlapping Kalahari Craton in the west to Sri Lanka in the east, with the Maud (W Sverdrpfjella), Barue and Nampula complexes (N Mozambique) and Vijayan Complex (Sri Lanka) representing footwall rocks to the nappe (Fig. 2).
This tectonic setting is comparable to that along the western margin of the Tibetan Plateau where India colliding northward with Asia is flanked on the west by a zone of sinistral transpressional orogeny extending through Pakistan and Afghanistan (Fig. 17a).
Within the collisional setting envisioned in Figure 16, it could be expected that dextral, top-to-the-SE displacement would occur between a footwall, comprising the Grunehogna craton plus western Sverdrupfjella, and the hanging wall of eastern Sverdrupfjella plus Gjelsvikfjella and beyond. A degree of differential shear (dextral?) could be expected between the Grunehogna craton and Maud Belt, given the thicker, more buoyant cratonic keel to the west and thinner metamorphic terrain to the east, as reflected in the gravity study of Riedel et al. (Reference Riedel, Jokat and Steinhage2012). Their study indicates crust >42 km thick underlying the Grunehogna Craton and <38–40 km underlying western Sverdrupfjella, increasing to >42 km over NE Sverdrupfjella and Gjelsvikfjella eastwards.
Acknowledgements
Research funding provided from the NRF via a SANAP grant (80267) and a personal grant to G.H.G. (80915) is gratefully acknowledged. Logistical support from Department of Environmental Affairs is similarly acknowledged. Funding from CGS and the University of Pretoria is also most gratefully received. Constructive reviews by Horst Marschall and an anonymous reviewer are acknowledged.
Declaration of interest
No conflict of interest is declared by the authors.