INTRODUCTION
Accurate description of a lactation curve is relevant to activities such as conducting feeding trials with lactating cattle, estimating total lactational yield from incomplete records and forecasting herd performance on a monthly or individual cow basis (Sauvant Reference Sauvant, Korver and Van Arendonk1988). The lactation curve is influenced by two interdependent processes, representing the activities of cell growth and death (Dijkstra et al. Reference Dijkstra, France, Dhanoa, Maas, Hanigan, Rook and Beever1997; Thornley & France Reference Thornley and France2005). Hence, when parametric functions are used as mathematical models to describe the lactation curve, a multiplicative form is usually adopted (Dhanoa & Le Du Reference Dhanoa and Le Du1982; Morant & Gnanasakthy Reference Morant and Gnanasakthy1989; Rook et al. Reference Rook, France and Dhanoa1993). The term lactation curve refers to a graphic representation of the association between milk production and lactation time starting at calving (Papajcsik & Bodero Reference Papajcsik and Bodero1988). Equations that describe milk production in time can be very useful in genetic breeding programmes, herd nutritional management, and decision making on the culling of cows and milk production simulation systems. The lactation curve is also important because its wide characterization of production throughout lactation allows estimation of peak yield (PY), days in milk (DIM) and lactation persistency (Ferreira & Bearzoti Reference Ferreira and Bearzoti2003). Furthermore, advances in genetic selection and husbandry practice have made today's dairy cattle quite different from those of only 10 years ago, and are likely to have affected the shape of the lactation curve of dairy cattle as well as milk yield (MY). The performance of lactation curve models should be investigated because accurate knowledge of lactation curves is important for the management and research of dairy production systems (Cankaya et al. Reference Cankaya, Unalan and Soydan2011).
There are various mathematical equations describing lactation curves in dairy cows, from the more empirical equations that relate input to output statistically with little consideration of the biology of lactation (e.g. Wood Reference Wood1967; Rook et al. Reference Rook, France and Dhanoa1993) to the more mechanistic ones that describe the lactation curve based on the biology of lactation (e.g. Dijkstra et al. Reference Dijkstra, France, Dhanoa, Maas, Hanigan, Rook and Beever1997; Pollott Reference Pollott2000). Although the latter may produce parameters that have a more biological interpretation, they can be too complex for routine use outside research, and some of the mechanisms represented are as yet not fully understood.
Several studies on the lactation curve focus only on MY (Tekerli et al. Reference Tekerli, Akinci, Dogan and Akcan2000; Macciotta et al. Reference Macciotta, Vicario and Cappio-Borlino2005) and there is consensus in the bibliography about the expected shape of the lactation curve for MY. The so-called standard lactation curves of dairy cows show a peak or maximum daily yield occurring between 4 and 8 weeks after calving, followed by a daily decrease in MY until the cow is dried off (García & Holmes Reference García and Holmes2001; Macciotta et al. Reference Macciotta, Vicario and Cappio-Borlino2005). Other authors also include milk contents, in terms of percentage and/or yields (Wood Reference Wood1976; Stanton et al. Reference Stanton, Jones, Everett and Kachman1992; Olori et al. Reference Olori, Brotherstone, Hill and McGuirk1997; García & Holmes Reference García and Holmes2001; Pollott Reference Pollott2004; Silvestre et al. Reference Silvestre, Petim-Batista and Colaço2005). Some disagreement has been reported in previous studies, since fat and protein curves have been presented with a continuously decreasing shape (Schutz et al. Reference Schutz, Hansen and Steuernagel1990; Stanton et al. Reference Stanton, Jones, Everett and Kachman1992) and also with the standard shape (Pollott Reference Pollott2004). Curves for milk and milk constituents have usually been regarded as independent curves. However, these curves are linked, since milk is a mixture of fat, protein, lactose, somatic cells, vitamins and minerals, either dissolved or suspended in water (Silvestre et al. Reference Silvestre, Martins, Santos, Ginja and Colaco2009). The aim of the current study was to evaluate the main features of lactation curves for MY and its components (milk fat content (FC), milk protein content (PC) and somatic cell score (SCS)) for the first three lactations of Iranian Holsteins. For this purpose, six empirical mathematical models currently used to fit 305 day standard lactations were examined to evaluate their efficiency in describing the lactations of Iranian Holsteins.
MATERIALS AND METHODS
Data
The initial data set comprised 5 535 995 test-day records for MY, FC, PC and SCS [SCS=3+log2(SCC/100); where SCC is somatic cell count in cells/μl], from the first three lactations of Iranian Holstein cows. Data were recorded on 2547 dairy herds in the period from 2000 to 2011 by the Animal Breeding Center of Iran. Outliers and out of range productive records were deleted from the analyses. Individual daily milk production should be between 3 and 90 kg. Also, fat and PCs should be in a range of 10–90 g/kg. Records from <5 and >305 DIM were eliminated. Records were also eliminated if no registration number was present for a given cow. Analyses were applied to the first three parities only and, therefore, data from later parities were also discarded. Ages at calving were required to be 20–40, 28–49 and 40–68 months in lactations one, two and three, respectively. After editing, 2 225 585 test-day records of productive traits from 1046 dairy herds were used in the statistical analysis. First-parity dairy cows represented 0·43, whereas second- and third parities accounted for 0·34 and 0·23 of the total test-day records, respectively.
Lactation curve models
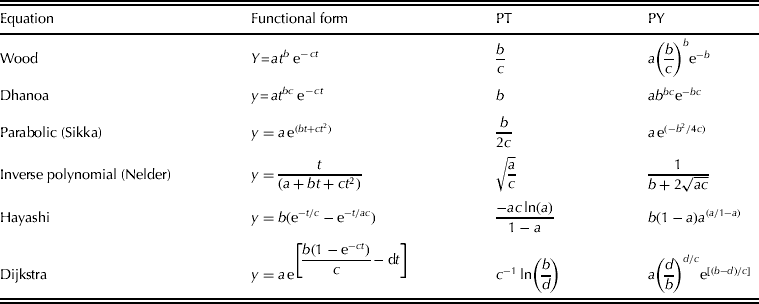
The non-linear equations and their features (PY and time to the peak) used to describe the lactation curves for MY and composition are presented in Table 1. The incomplete gamma function proposed by Wood (Reference Wood1967) has been used widely to study lactation curves, in which scaling factor a represents yield at the beginning of lactation, b is the inclining slope parameter up to PY, and c is the declining slope parameter (Silvestre et al. Reference Silvestre, Petim-Batista and Colaso2006). Dhanoa (Reference Dhanoa1981) proposed a model that is similar to the Wood (Reference Wood1967) model, but resulted in a lower correlation between parameters b and c than was the case between these parameters in the original Wood model. The parabolic exponential function introduced by Sikka (Reference Sikka1950) to model MY resulted in a bell-shaped truncated curve that, as a result of the curve symmetry around PY, only fitted MY reasonably during the first lactation (Gahlot et al. Reference Gahlot, Gahlot and Jairath1988). Nelder model is a derivation of the Sikka model, proposed by Nelder (Reference Nelder1966) and using an inverse exponential parabolic function. Inverse polynomials are generally non-negative, bounded and have a second-order form that has no built-in symmetry. The inverse polynomial overcomes the objections of ordinary polynomials (Nelder Reference Nelder1966). A model for describing lactation curves of dairy cows has been proposed by Hayashi et al. (Reference Hayashi, Nagamine and Nishida1986), in analogy to the model describing vibration of material point in physics. The Dijkstra model was derived from mechanistic models of the mammary gland by Dijkstra et al. (Reference Dijkstra, France, Dhanoa, Maas, Hanigan, Rook and Beever1997) and is based on a set of differential equations representing cell proliferation and cell death in the mammary gland (Dijkstra et al. Reference Dijkstra, France, Dhanoa, Maas, Hanigan, Rook and Beever1997; Thornley & France Reference Thornley and France2005) yielding a four-parameter equation. For all models, PY was assumed as the maximum test day MY or minimum milk constituents and peak time (PT) was accepted as the test time at which daily MY was maximum or milk constituents were minimum.
Equations and their features used to describe the lactation curve of Holstein cows
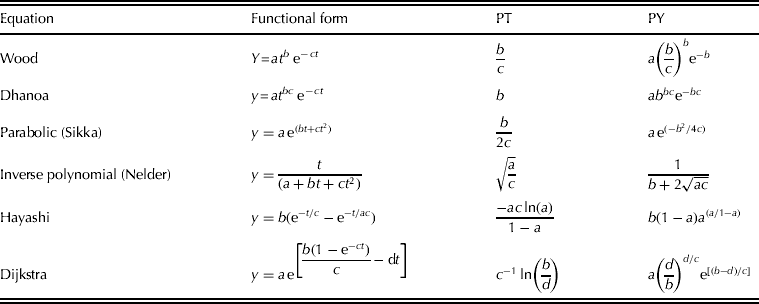
Y, MY and composition; PY, maximum value for MY and minimum value for FC, PC and SCS; PT, peak time; a, b, c and d are parameters that define the scale and shape of the lactation curve; t, time from parturition.
Statistical analyses
Each model was fitted to monthly production records of dairy cows using the NLIN and MODEL procedures in SAS (SAS Institute 2002) and the parameters were estimated. The NLIN procedure produces least squares or weighted least squares estimates of the parameters of a non-linear model. For each non-linear model to be analysed, the model (using a single-dependent variable) and the names and starting values of the parameters to be estimated must be specified. When non-linear functions were fitted, the Gauss–Newton method was used as the iteration method. To begin this process, the NLIN procedure first examines the starting value specifications of the parameters. If a grid of values is specified, the NLIN procedure evaluates the residual sum of squares at each combination of parameter values to determine the set of parameter values producing the lowest residual sum of squares. These parameter values are used for the initial step of the iteration. The MODEL procedure analyses models in which the relationships among the variables comprise a system of one or more non-linear equations. Primary uses of the MODEL procedure are estimation, simulation, and forecasting of non-linear simultaneous equation models. The models were tested for goodness of fit (quality of prediction) using residual standard deviation or root-mean-square error (RMSE), Durbin–Watson statistic (DW) and Akaike's information criterion (AIC).
RMSE is a kind of generalized standard deviation and was calculated as follows:
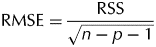 $${\rm RMSE} = \displaystyle{{{\rm RSS}} \over {\sqrt {n - p - 1}}} $$
where RSS is the residual sum of squares, n is the number of observations (data points) and p is the number of parameters in the equation. The RMSE value is one of the most important criteria for comparing the suitability of used lactation curve models in terms of expression of lactation MY properties (Fernandez et al. Reference Fernandez, Sanchez and Garces2002). Therefore, the best model is the one with the lowest RMSE.
The DW was used to detect the presence of autocorrelation in the residuals from the regression analysis. In fact, the presence of autocorrelated residuals suggests that the function may be inappropriate for the data. The DW ranges in value from 0 to 4. A value near 2 indicates no autocorrelation, whereas a value towards 0 indicates positive autocorrelation and a value towards 4 indicates negative autocorrelation. The DW was calculated using the following formula:
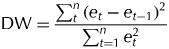 $${\rm DW} = \displaystyle{{\sum\nolimits_t^n {(e_t - e_{t - 1} )^2}} \over {\sum\nolimits_{t = 1}^n {e_t^2}}} $$
where e t is the residual at time e, and e t−1 is the residual at time t−1.
The AIC was calculated using the equation of Burnham & Anderson (Reference Burnham and Anderson2002):
 $${\rm AIC} = n \times \ln ({\rm RSS}) + 2p$$
The AIC is a good statistic for comparison of models of different complexity because it adjusts the RSS for number of parameters in the model. A smaller numerical value of AIC indicates a better fit when comparing models.
Predicted 305-day milk yields (305MY) were obtained for every model using the following equation (Vargas et al. Reference Vargas, Koops, Herrero and Van Arendonk2000) with substitution of y(t) by the corresponding model equation (Table 1):
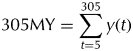 $$305{\rm MY} = \sum\limits_{t = 5}^{305} {y(t)} $$
where 305MY is the predicted 305-day milk yield and y(t) is the milk yield at day t (5, …, 305) estimated by corresponding lactation models. In addition, two types of persistency measures were used in the current study. The first type uses mathematical functions for determining the MY persistency (S) as follows:
 $$S = - (b + 1)\ln (c)\; \quad {\rm for}\;{\rm Wood}\;{\rm model}$$
 $$S = - (bc + 1)\ln (c)\; \;{\rm for}\;{\rm Dhanoa}\;{\rm model}$$
where b and c are already fitted parameter estimates obtained from Wood or Dhanoa models. The second type of persistency measures uses ratios between different parts of the lactation (P 2:1, P 3:1 and P Weller); P 2:1 and P 3:1 were proposed by Johansson & Hansson (Reference Johansson and Hansson1940) and represent the ratios between the MY of the second and third 100 days of lactation, respectively, and that of the first 100 days. In addition, Weller et al. (Reference Weller, Ezra and Leitner2006) defined milk persistency as estimated milk production at 180 days after peak divided by estimated peak production in percent as follows:
 $${P_{{\rm Weller}} = \! 100 \times {\rm PROD}(270)/{\rm PROD(}100{\rm )}\;{\rm for}\;{\rm parity} = 1}$$
 $${P_{{\rm Weller}} = 100 \times {\rm PROD(}225{\rm )}/{\rm PROD(}45{\rm )}\;{\rm for}\;{\rm parity} \gt 1}$$
where PROD(270), PROD(225), PROD(90) and PROD(45) are milk production at 270, 225, 90 and 45 DIM, respectively.
RESULTS
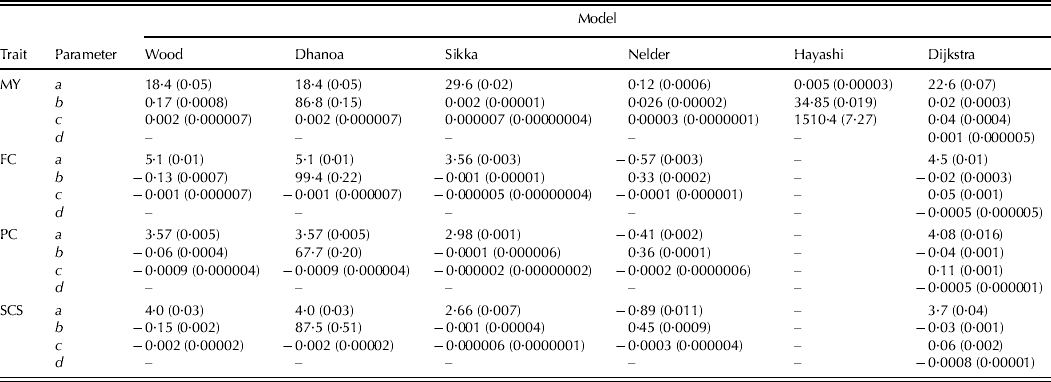
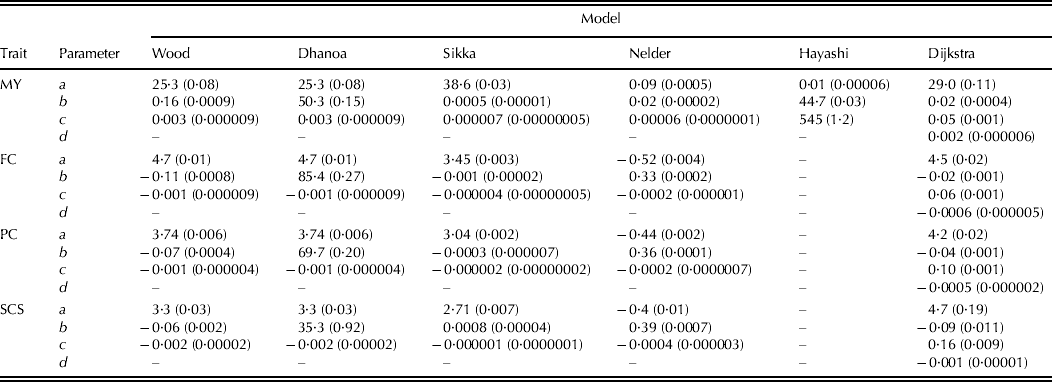
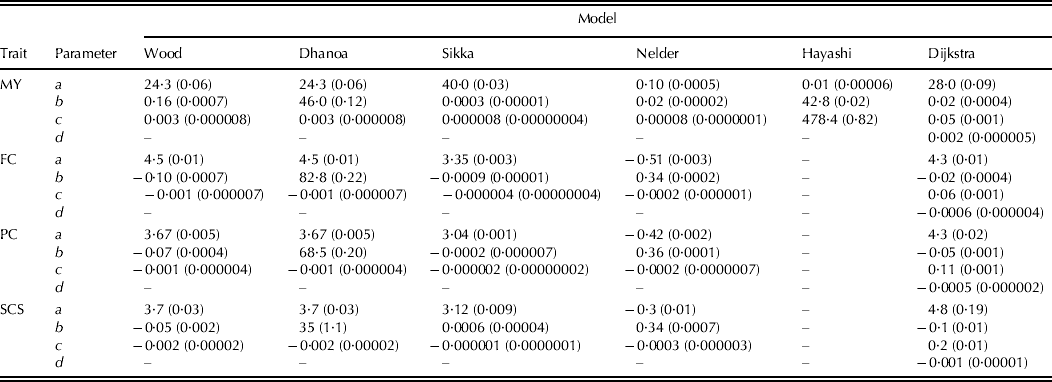
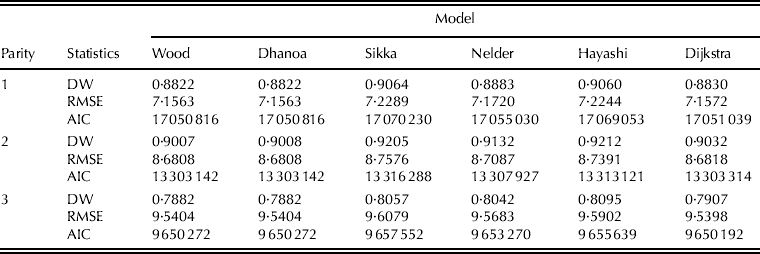
Estimated parameters of non-linear equations for the first-, second- and third-parity dairy cows are presented in Tables 2–4. Also, goodness-of-fit statistics for the six functions fitted to average standard curves of MY according to parity class are shown in Table 5. The Wood, Dhanoa and Dijkstra models provided the lowest values of RMSE and DW, whereas the Hayashi and Sikka models had the greatest values for both parameters. For first- and second-parity dairy cows, the Wood and Dhanoa models provided the lowest AIC values, but the Dijkstra model had the lowest value of AIC for the third-parity dairy cows (Table 5).
Parameter estimates for the different lactation equations of the first-parity dairy cows (standard errors are in parentheses)

a, b, c and d are parameters that define the scale and shape of the lactation curve; MY, milk yield; FC, fat content; PC, protein content; SCS, somatic cell score.
Parameter estimates for the different lactation equations of second-parity dairy cows (standard errors are in parentheses)
a, b, c and d are parameters that define the scale and shape of the lactation curve; MY, milk yield; FC, fat content; PC, protein content; SCS, somatic cell score.
Parameter estimates for the different lactation equations of third-parity dairy cows (standard errors are in parentheses)
a, b, c and d are parameters that define the scale and shape of the lactation curve; MY, milk yield; FC, Fat content; PC, protein content; SCS, somatic cell score.
Comparing goodness of fit for average standard curves of MY according to parity class, for Wood, Dhanoa, Sikka, Nelder, Hayashi and Dijkstra models
RMSE, root-mean-square error; DW, Durbin–Watson; AIC, Akaike's information criteria.
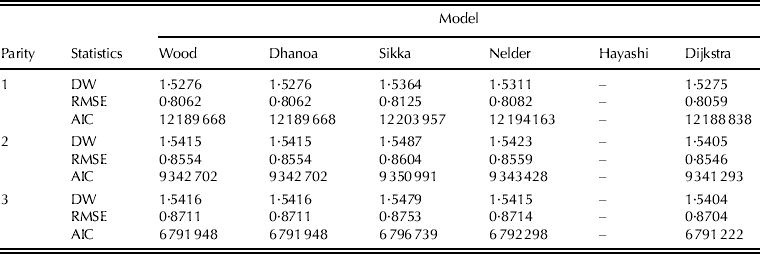
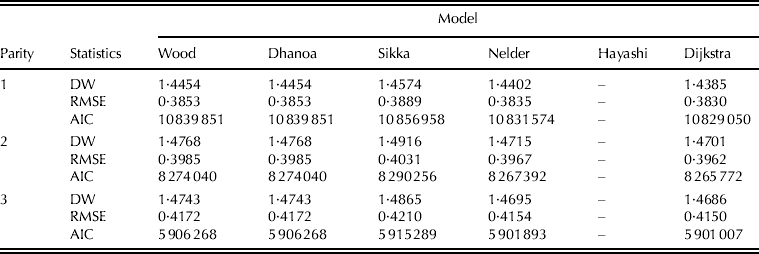
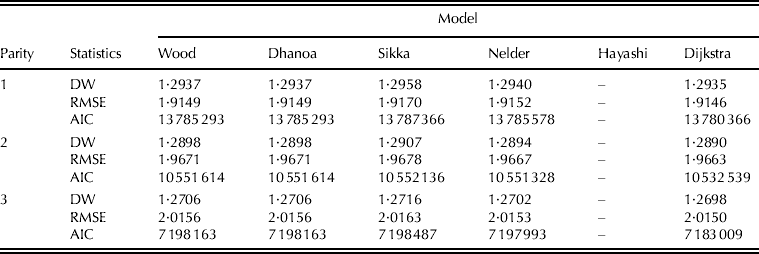
Goodness-of-fit statistics for the six functions fitted to average standard curves for FC, PC and SCS according to parity class are shown in Tables 6–8, respectively. For FC and SCS, the DW and RMSE estimates did not differ among the models, while for PC only the RMSE did not differ. For the first three parities, the Sikka model provided the greatest values of DW for PC, whereas for AIC the Dijkstra model provided the lowest values and the Sikka model the highest (Tables 6–8).
Comparing goodness of fit for average standard curves of FC of milk according to parity class, for Wood, Dhanoa, Sikka, Nelder, Hayashi and Dijkstra models
RMSE, root-mean-square error; DW, Durbin–Watson; AIC, Akaike's information criteria.
Comparing goodness of fit for average standard curves of PC of milk according to parity class, for Wood, Dhanoa, Sikka, Nelder, Hayashi and Dijkstra models
RMSE, root-mean-square error; DW, Durbin–Watson; AIC, Akaike's information criteria.
Comparing goodness of fit for average standard curves of SCS according to parity class, for Wood, Dhanoa, Sikka, Nelder, Hayashi and Dijkstra models
RMSE, root-mean-square error; DW, Durbin–Watson; AIC, Akaike's information criteria.
In general, the Wood equation gave a similar goodness of fit to the Dhanoa model for all traits. However, the non-linear model of Hayashi did not fit to monthly records of FC, PC and SCS. Therefore, the NLIN procedure did not converge in these situations.
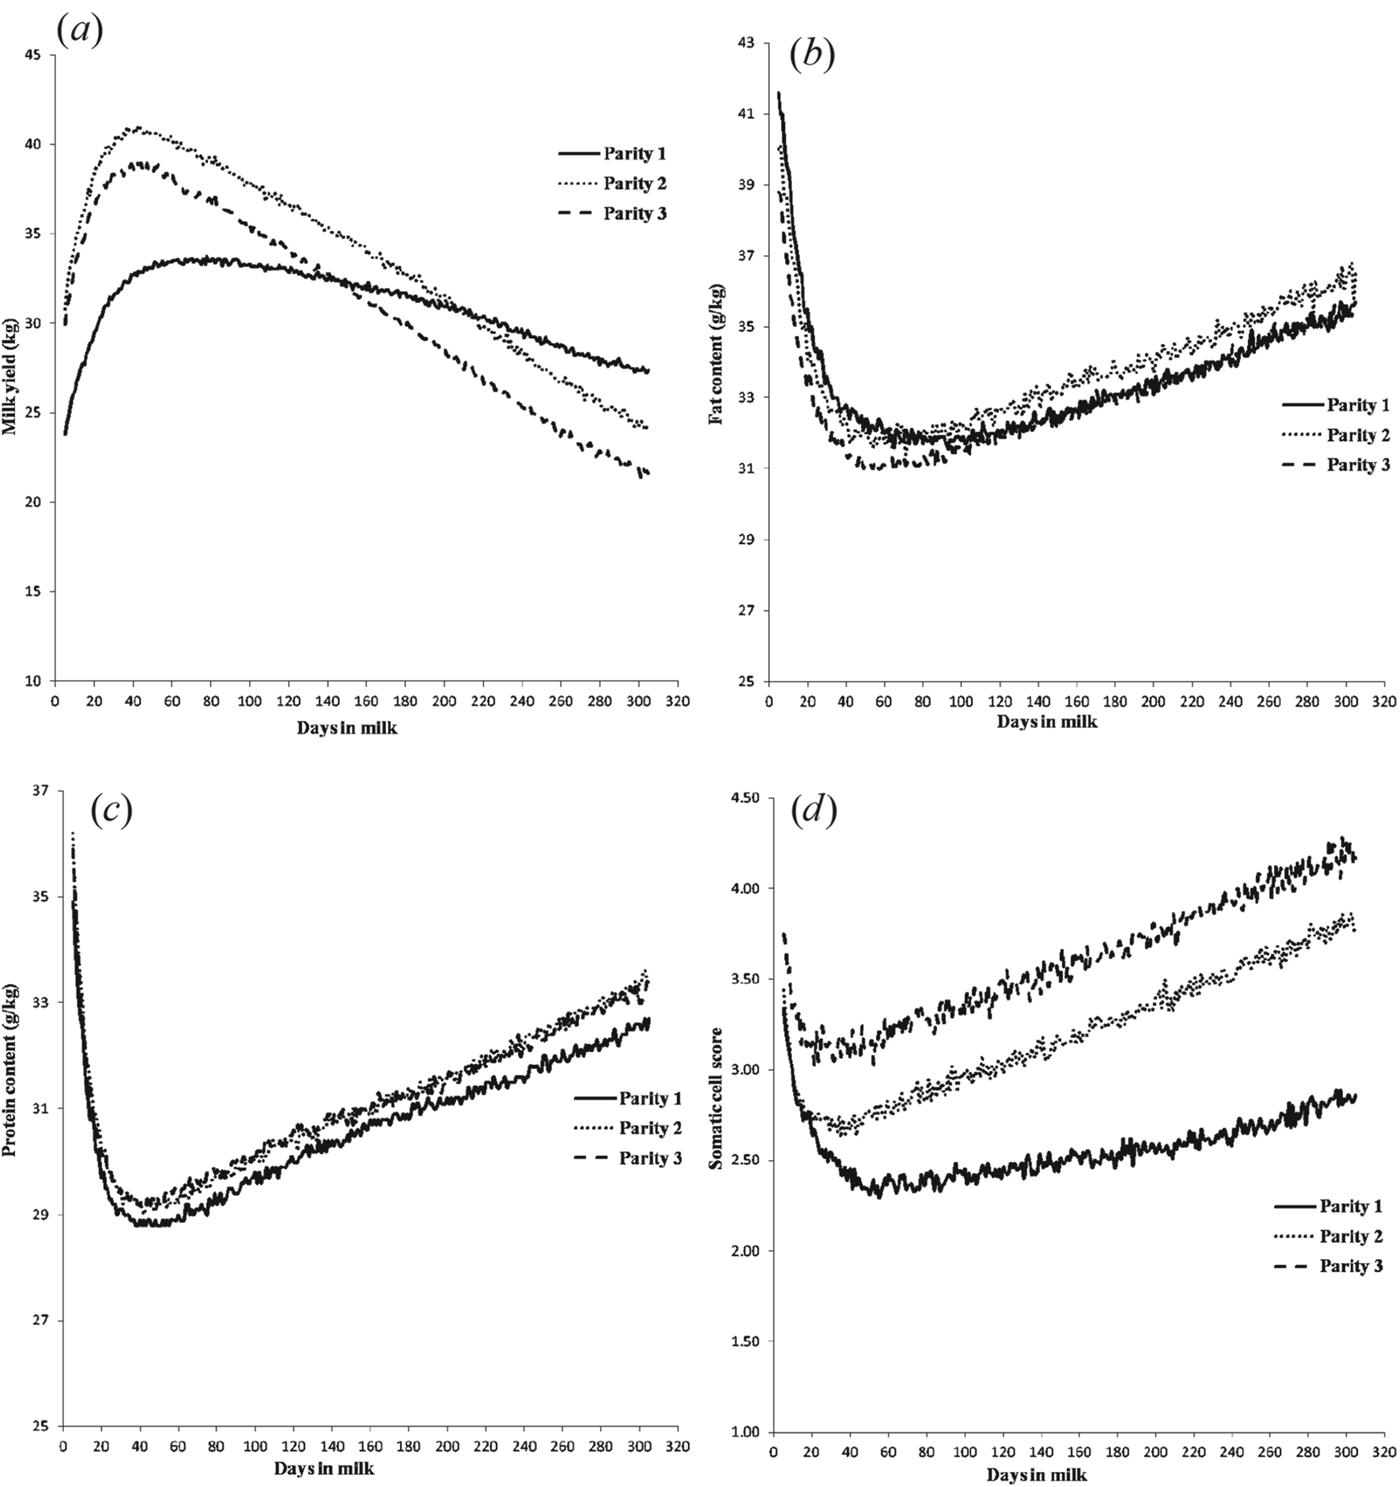
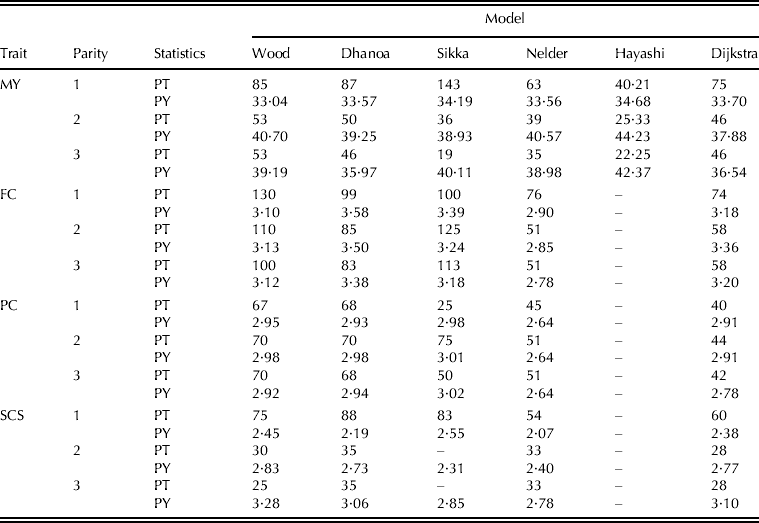
Observed MY for all parities increased from Day 5 of lactation to a peak a few weeks later, declining thereafter until Day 305. In contrast, observed FC, PC and SCS across all parities decreased from Day 5, reaching minimum values some time after that and then increasing again until Day 305 (Fig. 1). Time to the PY and production at peak for average standard lactations of MY and minimum production and corresponding time for PC, FC and SCS according to parity class predicted by the six non-linear functions are shown in Table 9. Evaluation of first lactation features showed that the Dijkstra equation was able to estimate PY and time to the peak more accurately than the other equations. Time to the peak was overpredicted by the Wood, Dhanoa and Sikka models and underpredicted by the Nelder and Hayashi models. However, the Wood equation provided more accurate predictions of PY at second and third parities than the other equations. Also, the Dijkstra model underpredicted PY at second and third parities. For first lactation FC, the Dijkstra equation was able to estimate the minimum FC and corresponding time more accurately than the other equations. Time to the peak was overpredicted by the Wood, Dhanoa, Nelder and Sikka models. However, the Wood equation provided more accurate predictions of minimum FC at second and third parities than the other equations; but the Dijkstra and Nelder models underpredicted and the Dhanoa and Sikka models overpredicted the time to the minimum value of FC at second and third parities.
Variation of (a) MY, (b) FC, (c) PC and (d) SCS across the parities in Iranian Holsteins.
PT and PY for average standard lactations of MY, PC, FC and SCS according to parity class, predicted by Wood, Dhanoa, Sikka, Nelder, Hayashi and Dijkstra models
MY, milk yield; FC, fat content; PC, protein content; SCS, somatic cell score; PY, maximum value for MY and minimum value for FC, PC and SCS; PT, peak time.
For first- and second-lactation PC, the Dijkstra equation was able to estimate the minimum PC and corresponding time more accurately than the other equations; but for third-lactation PC, the minimum value was predicted more accurately by the Wood model and the time to the minimum value of PC was predicted more accurately by the Dijkstra model.
For first lactation SCS, the Dijkstra and Dhanoa equations were able to estimate the minimum SCS more accurately than the other equations and the time to the minimum SCS was overpredicted by models other than the Nelder equation. For second-lactation SCS, the Dhanoa equation was able to estimate the minimum SCS and time to the minimum SCS accurately. Also, for third-lactation SCS, the Dhanoa equation was able to estimate the minimum SCS more accurately than the other equations.
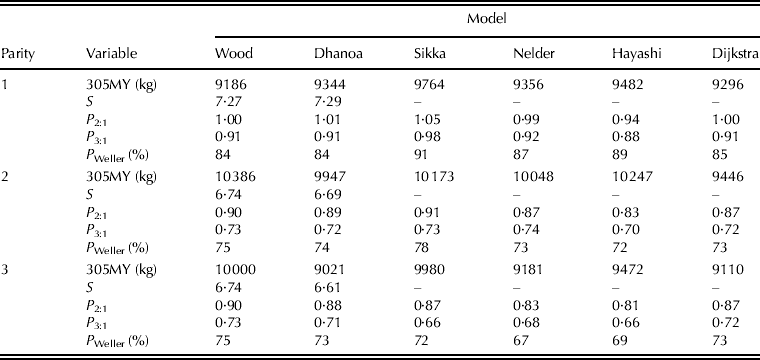
Different measures of persistency and 305MY for average standard lactations of dairy cows according to parity class, predicted by various models, are presented in Table 10. For first-parity dairy cows, the Sikka model and the Wood equation provided the greatest and lowest 305MY, respectively. The Wood model predicted the greatest 305MY at the second- and third parities, but the Dijkstra and Dhanoa models provided the lowest 305MY for the second- and third parities, respectively. According to the persistency measures obtained from different models, the highest MY persistency was obtained during first lactation. For first-parity dairy cows, the Wood and Dijkstra equations provided the most persistent lactation curves based on P 2:1, but the Sikka model provided lactations with better persistency than other equations according to P 3:1 and P Weller. For second-parity dairy cows, the Sikka equation provided the most persistent lactation curves based on P 2:1 and P Weller, but the Nelder model provided lactations with better persistency than other equations according to P 3:1 measure. The Wood equation provided the most persistent lactation curves based on the measures of P 2:1, P 3:1 and P Weller for third-parity dairy cows.
Different measures of persistency and 305MY for average standard lactations of dairy cows according to parity class, predicted by Wood, Dhanoa, Sikka, Nelder, Hayashi and Dijkstra models
305MY, predicted 305-day milk yield; S, milk yield persistency obtained from Wood or Dhanoa models; P 2:1, ratio between the MYs of the second 100 days of lactation and those of the first 100 days; P 3:1, ratio between the MYs of the third 100 days of lactation and those of the first 100 days; P Weller, MY persistency measure proposed by Weller et al. (Reference Weller, Ezra and Leitner2006).
DISCUSSION
Empirical and more mechanistic models of the lactation curve, of varying complexity, have been reported in the literature. Six equations representing different complexity were evaluated using data collected from Iranian dairy herds. Comparison of their predictive ability allows identification of a mathematical model capable of describing and providing a better perspective on the shape of the lactation curve of Holstein cows in Iran. Once a desired model of the lactation curve is selected, selection emphasis can then be directed exclusively to the level of the lactation curve. It is important to develop an optimal strategy to achieve a desired lactation shape through changing the lactation model parameters. The shape of the lactation curve has been shown to be affected by parity, mainly due to a less well-defined peak (related to high variability at the beginning of lactation) and greater persistency in first-lactation cows (Sherchand et al. Reference Sherchand, McNew, Kellog and Johnson1995; Scott et al. Reference Scott, Yandell, Zepeda, Shaver and Smith1996). Several studies have shown differences in the general shape of the lactation curve (e.g. Pérochon et al. Reference Pérochon, Coulon and Lescourret1996; Landete-Castillejos & Gallego Reference Landete-Castillejos and Gallego2000), the most common shape being a rapid increase after calving to a peak a few weeks later, followed by a gradual decline until the cow is dried off. The other shape is a gradual decline from parturition.
The novel items in the current study included the use of very large data sets from the first three parities of Holstein cows in Iran and the interest of considering several non-linear models to evaluate the characteristics of lactation curves for MY and composition in dairy cows. In addition, different measures of persistency for average standard lactations of dairy cows were predicted by various models in the current study. The Wood and Dhanoa models provided the best fit of the lactation curve for MY in the first and second parities due to the lower values of RMSE and AIC than other models. This subject may provide advantages to researchers in practice because the Wood model can be linearized with a simple logarithmic transformation and easily solved by ordinary least-squares analysis (Tekerli et al. Reference Tekerli, Akinci, Dogan and Akcan2000). However, the Dijkstra model showed the best fit of milk lactation curve for third-parity dairy cows. When applying the Wood equation for modelling the lactation curve of primiparous cows, lactation milk yields of Holstein cows that are dried off due to unpredictable reasons (illness, injury, etc.) can be estimated, and also missing test day milk yields would be predicted. Therefore, it can be decided whether a cow can be kept in the herd in terms of milk yields in the first lactation and also in the early stages of the lactation period. If the possible shape of the lactation curve is known, dairy cows can be grouped according to their expected lactation milk yields. More appropriate feeding programmes can then be created for requirements of each group by taking into consideration the differences among the groups. Korkmaz et al. (Reference Korkmaz, Üçkardeş and Kaygisiz2011) also observed that the results of the Wood and Dhanoa models were similar and, similarly to the current paper, other authors have reported the Wood function as the best predictor of milk lactation curve in dairy cows (Cankaya et al. Reference Cankaya, Unalan and Soydan2011; Elahi Torshizi et al. Reference Elahi Torshizi, Aslamenejad, Nassiri and Farhangfar2011). The similarity of the Wood and Dhanoa models for modelling lactation curve is expected because the Dhanoa equation is the reparameterized form of the Wood model. The Wood function provided the best fit on first-parity milk lactation curve in the current study and it was shown that with smooth or persistent patterns of lactation data such as primiparous records, the Wood equation will yield a better fit than the Dijkstra equation and the probable reason was that in this case the number of cells and the enzymatic activity per cell, as required parameters of their equation, cannot both be defined uniquely from lactation data owing to insufficient timing and frequency of prepeak observations (Fathi Nasri et al. Reference Fathi Nasri, France, Odongo, Lopez, Bannink and Kebreab2008). Milk yield is usually low in first-parity dairy cows because the animal is not fully developed and they partition more resources to maintenance and growth at the expense of milk production. The high MY in later lactations could also be attributed to selection since animals with low milk yields are normally culled as part of the herd management practices leaving only high producers in the herd. Differences between the characteristics of the lactation curve of primiparous and multiparous cows are likely to be responsible for the significant difference between goodness of fit of the equations for the different parities. The variation of fit of models may have arisen from the differences in mathematical functions of the models, differences of test day yield, the amount of data, the number of test day records and the intervals between tests. Differences in lactation curves would be a combination of environmental and genetic factors (Pérochon et al. Reference Pérochon, Coulon and Lescourret1996).
The Dijkstra model showed the best fit of lactation curve for FC, PC and SCS because of the lowest values of RMSE and AIC. Dijkstra et al. (Reference Dijkstra, France, Dhanoa, Maas, Hanigan, Rook and Beever1997), Val-Arreola et al. (Reference Val-Arreola, Kebreab, Dijkstra and France2004) and Adediran et al. (Reference Adediran, Malau-Aduli, Roche, Donaghy and Fulkerson2007) found that the Dijkstra equation better fitted the shape of the lactation curve than more empirical equations such as the Wood equation, which is consistent with the results of third-parity dairy cows in the current work. The Dijkstra model has two advantages over the Wood equation, namely the precise biological meaning of the parameters and the value of the intercept that is not zero. Fathi Nasri et al. (Reference Fathi Nasri, France, Odongo, Lopez, Bannink and Kebreab2008) evaluated the lactation features of dairy cows and showed that the Dijkstra equation was able to estimate the initial MY and the PY more accurately than the Wood function. However, the current results are in contrast to those of Pollott (Reference Pollott2000), who concluded (based on many dairy recording schemes which use a maximum of 10 monthly test-day records per lactation) that the equations with more parameters, such as Dijkstra et al. (Reference Dijkstra, France, Dhanoa, Maas, Hanigan, Rook and Beever1997), are overparameterized and will not yield better fits than Wood. This is because in these situations it is common to find no recordings, or at best one recording, taken before PY and this makes estimating the cell proliferation phase of the lactation and the PY less accurate. Latest peak production occurred in first lactation for all models in the current study, while third lactation cows had the earliest day of peak production and this might be explained by the milk secretory tissue in primiparous cows taking longer to reach its peak activity than in multiparous cows. In contrast to the results of the current study, Fathi Nasri et al. (Reference Fathi Nasri, France, Odongo, Lopez, Bannink and Kebreab2008), Scott et al. (Reference Scott, Yandell, Zepeda, Shaver and Smith1996) and Sherchand et al. (Reference Sherchand, McNew, Kellog and Johnson1995) observed that the Wood equation underpredicted peak milk production. This contradiction could be due to the different size of data set, number of animals and the method for editing records in various studies. According to the moderate values of DW obtained from fitting the non-linear models of lactation curve in the current study it was concluded that there was positive autocorrelation between the residuals for all models, but this autocorrelation was more obvious for MY than the other productive traits. Therefore, it seems that residual autocorrelation presented no problem, or only a very slight one, for FC, PC and SCS in the current study. Positive autocorrelation is a serial correlation in which a positive error for one observation increases the chances of a positive error for another observation. In general agreement with the current results, Quinn et al. (Reference Quinn, Killen and Buckley2006) reported that the Wood model did not have the ability to predict the fat and protein concentrations efficiently in Irish dairy cows.
Milk compositions showed an opposite trend compared to MY. In particular, FC and PC did not show a significant variation among parities, whereas differences have been detected for SCS, with a higher level for the older cows. These results suggest limiting the number of older cows in herds with standard lactation especially if the milk is paid according to quality. The overall trend of SCS during lactation in the current study is consistent with reports by Wiggans & Shook (Reference Wiggans and Shook1987) and Rodriguez-Zas et al. (Reference Rodriguez-Zas, Gianola and Shook2000), who reported that after the beginning of lactation, SCS decreases to a minimum at c. 60 days post-calving and increases thereafter. The non-linear (in time) SCS pattern observed could be explained by the effects of stress at the onset of lactation and of dilution thereafter (Wiggans & Shook Reference Wiggans and Shook1987). Using the Hayashi function did not provide parameter estimates for FC, PC or SCS. This result indicated that Hayashi model had no benefit for modelling the lactation curve of milk compositions because this model was not able to predict the variation of milk compositions over the lactation. Korkmaz et al. (Reference Korkmaz, Üçkardeş and Kaygisiz2011) reported that the Hayashi and Sikka equations could not predict PY of Simmental cows because of the structures of the curves.
Improved persistency of lactation can contribute to reducing the cost of the production system, because lactation persistency is associated with feeding and health costs, reproductive performance, resistance to disease and the return from milk considering a 305-day production cycle (Dekkers et al. Reference Dekkers, Jamrozik, Ten Hag, Schaeffer and Weersink1996, Reference Dekkers, Ten Hag and Weersink1998). Dairy cows with a flat lactation curve are considered to have more persistent lactations than those with the same lactation yield but a steep lactation curve. For cows with flatter lactation curves, the incidence of metabolic and reproductive disorders that originate from the physiological stress of high MY would be lower, and the proportion of roughage in the ration could be increased, thus reducing production costs (Tekerli et al. Reference Tekerli, Akinci, Dogan and Akcan2000). Therefore, a genetic change towards a persistent lactation curve could be used as a means to lower the disease susceptibility in dairy cows. It was suggested that persistent cows might lose less body weight, indicating a favourable relationship between persistency and reduced negative energy balance. Tekerli et al. (Reference Tekerli, Akinci, Dogan and Akcan2000), Weller et al. (Reference Weller, Ezra and Leitner2006) and Gengler (Reference Gengler1996) reported that persistency was higher for primiparous cows, as also found in the current study, and this is mainly due to later and lower PY in the first lactation compared with later lactations. A positive relationship was observed between persistency measures and 305MY calculated by different models within each lactation in this study. Persistency is dependent on yields, especially total yields, but the direction of the relationship depends on the measures used. The ratio measures (such as the measures in the current study) show a positive one, whereas the variation measures show a negative relationship. The reason for this could be that the first are highly affected by the level of production and the second are influenced by variation in production, with this variation more important for high producing cows (Gengler Reference Gengler1996). In addition, the positive relationship between PY and 305MY suggested that cows with high daily milk production at peak can produce more total MY over the lactation than lower producing cow at peak day. Therefore, dairy cows could be selected on the basis of peak yield.
In the interpretation of output data of mathematical models, it is important to consider its properties as well as biological and physiological fundamentals. In some cases, ten records are not enough to represent some lactations fully (Olori et al. Reference Olori, Brotherstone, Hill and McGuirk1999). Diseases (mastitis, metabolic diseases), injuries and record errors may also be factors causing problems in representations of the real genetic abilities of some cows. The distance between first record and peak of lactation may also affect the mathematical analysis. Bias in estimation of particular lactation curves also depends upon environmental effects or even random variation of individual cows (Olori et al. Reference Olori, Brotherstone, Hill and McGuirk1999). It is also worth mentioning that a single mathematical model, even if effective for particular traits, shows various accuracies for others even within one breed, as confirmed in the present study. It could be suggested that there was a need to incorporate various factors in the process of modifying existing models or designing new ones in terms of better precision and applicability (Gołębiewski et al. Reference Gołębiewski, Brzozowski and Gołębiewski2011).
CONCLUSIONS
There are a number of factors that need to be considered when choosing the optimal function to describe the lactation of dairy cows. Although the key factor is the accuracy of the fit of the function, the possibility of calculating characteristics of the curve and the interpretation of the curve's parameters is as important. Of the six functions investigated in the present study, the Wood and Dhanoa models provided the best fit of the lactation curve for MY in the first and second parities due to the lower values of RMSE and AIC than other models; but the Dijkstra model showed the best fit of milk lactation curve for third-parity dairy cows, FC, PC and SCS in the first three parities because of the lowest values of RMSE and AIC. In general, the Sikka model fitted the production data less well than the other equations. In addition, the Hayashi function did not fit for FC, PC and SCS; therefore, this equation did not provide any parameter estimates for these traits.
The author wishes to acknowledge the Animal Breeding Center of Iran for providing the data used in the current study. In addition, the author wishes to thank three anonymous reviewers for their constructive comments about the earlier versions of the manuscript.