Introduction
Outbreaks of highly virulent parasites are frequently the cause of health and environmental crises. The recent Ebola crisis has had devastating effects in West Africa (Richards et al., 2018) and the current crisis of amphibian chytridiomycosis is threatening mass extinction of amphibian species (Van Rooij et al., 2015). Understanding the trajectories of virulence evolution can allow us to predict the circumstances under which extreme virulence is likely to arise and be maintained. Most models used to predict trajectories of virulence evolution are derived from the trade-off hypothesis (Anderson and May, Reference Anderson and May1982). There is evidence that this hypothesis holds true (Messenger et al., 1999; Jensen et al., 2006; Bérénos et al., 2009), but its widespread relevance has been extensively debated (Alizon et al., 2009). Testing of more specific hypotheses derived from this broader hypothesis can provide a comparative approach to establish its broad relevance (Alizon et al., 2009; Cressler et al., 2016). One such hypothesis is the ‘sit and wait’ hypothesis (Ewald, Reference Ewald1983; Bonhoeffer et al., Reference Bonhoeffer, Lenski and Ebert1996) which posits that extreme virulence evolves in parasites with long-lived environmental stages. This is because they do not rely on host mobility for transmission. They can demobilize and eventually kill their host, then ‘sit and wait’ for migration from new susceptible hosts (Bonhoeffer et al., Reference Bonhoeffer, Lenski and Ebert1996; Gandon, Reference Gandon1998; Kamo and Boots, Reference Kamo and Boots2004; Walther and Ewald, Reference Walther and Ewald2004; Roche et al., Reference Roche, Drake and Rohani2011). Under such circumstances, the costs of virulence (Anderson and May, Reference Anderson and May1982) are greatly reduced, allowing for optimum transmission through maximal exploitation of the host, even if this results in rapid mortality and de-mobilization of hosts (Bonhoeffer et al., Reference Bonhoeffer, Lenski and Ebert1996; Gandon, Reference Gandon1998; Walther and Ewald, Reference Walther and Ewald2004). The sit and wait hypothesis, however, may not hold true for all pathogens. In some cases, environmental persistence may in fact be traded off against virulence. The resource allocation hypothesis suggests that the traits that enable persistence may come at a direct cost to virulence resulting in longer lived pathogens exhibiting lower virulence (Goldhill and Turner, Reference Goldhill and Turner2014).
Parasites with long-lived environmental stages can have catastrophic effects on their host populations. Anthrax spores, from the bacterium Bacillus anthracis, persist for years in soil, causing severe and virulent disease when soil is disturbed, sometimes after decades of silence (Dragon and Rennie, Reference Dragon and Rennie1995; Mock and Fouet, Reference Mock and Fouet2001). Similarly, the most devastating disease of vertebrates in recent years, amphibian chytridiomycosis, is caused by the fungal parasite Batrachochytrium dendrobatidis. The ability of this parasite to obliterate host populations is hypothesized to be a consequence of its ability to persist in the environment (Mitchell et al., Reference Mitchell, Churcher, Garner and Fisher2008; Mosher et al., Reference Mosher, Huyvaert and Bailey2018). On the other hand, there is evidence from in vitro cell culture evolution experiments that virulence and environmental persistence are traded off (Brandon Ogbunugafor et al., Reference Brandon Ogbunugafor, Alto, Overton, Bhushan, Morales and Turner2013; Wasik et al., Reference Wasik, Bhushan, Ogbunugafor and Turner2015).
In spite of receiving extensive theoretical attention (Bonhoeffer et al., Reference Bonhoeffer, Lenski and Ebert1996; Gandon, Reference Gandon1998; Kamo and Boots, Reference Kamo and Boots2004; Roche et al., Reference Roche, Drake and Rohani2011; Goldhill and Turner, Reference Goldhill and Turner2014), to date there are only a few experimental tests of these hypotheses and many of these studies address the question within the context of a simple host–parasite system. Furthermore, systems used have been inappropriate for the testing of the sit and wait hypothesis, which by definition requires the presence of motile hosts living in terrestrial environments, where the presence of new naïve hosts is determined by host migration (Walther and Ewald, Reference Walther and Ewald2004). Walther and Ewald (Reference Walther and Ewald2004) compared data for human respiratory parasites across parasite taxa; however, a recent and comprehensive analysis of evidence relating to the two competing hypotheses is lacking. I conducted a meta-analysis to examine the experimental tests of the relationship between environmental persistence and virulence carried out to date. I first looked at the general trend for all data to determine whether there was an overall positive or negative relationship between virulence and survival outside of the host. I then looked specifically at studies that used motile hosts in terrestrial environments to evaluate whether the data at present lend support to the sit and wait or the resource allocation hypothesis. For this second analysis, I focused on the original verbal framework of the sit and wait hypothesis (Ewald, Reference Ewald1983; Walther and Ewald, Reference Walther and Ewald2004) as the data required to test the more specific predictions and assumptions of the mathematical formalizations of the hypothesis do not exist at present.
Methods
Literature search
Papers were initially collected that tested proxies of parasite virulence and also reported data for environmental persistence. I used any measure of parasite-induced host harm reported in a given paper as a proxy for virulence and I defined persistence as longevity outside of a host. The Web of Science, PubMed and Google Scholar databases were searched using the search terms including ‘virulence spore longevity’, ‘curse of the pharaoh’, ‘virulence environmental persistence’, ‘virulence longevity trade-off’, ‘virulence persistence trade-off’, ‘aggressivity spore longevity’ and ‘aggressivity spore persistence’ looking at the reference lists within these papers and papers that had cited included papers. Papers were included if they met the following criteria:
(i) Published in a peer-reviewed academic journal
(ii) Collected virulence data from two or more parasites or parasite strains with differing levels of environmental longevity
(iii) Measured one or more proxies of virulence
(iv) Included data on environmental longevity of parasites
(v) Presented either r, r 2, R 2, t values or group means along with either standard deviation, standard error or confidence interval measures for the presented virulence proxies
To specifically test if the literature as it stands supports the sit and wait hypothesis, a second analysis was carried out, using just studies that were carried out on motile, terrestrial species.
Testing for publication bias
Funnel plots were created to visualize potential publication bias.
Statistical analysis
Pearson's coefficient values of r were extracted from collected studies, using the formulae described in Field and Gillett (Reference Field and Gillett2010) where r values were not directly presented. This measure was chosen as it allowed for the inclusion of both correlation data and data from direct comparisons between individual parasites in the meta-analysis. This increased the total number of studies that could be included in the analysis but did mean that studies containing correlative data from multiple parasites carry an n value of just one as only one measure could be extracted. Both meta-analyses were carried out using a random-effects model with the metacor function in the package meta in R version 3.4.0 (R core development team), first on the entire dataset to explore overall effects and then using three moderator variables, parasite type, virulence measure and experiment type. For the second analysis, only the moderator variable ‘parasite type’ was used as there were not enough studies in the smaller subset to perform meaningful analyses with the other variables. Full details of the statistical model can be found in Schwarzer et al. (Reference Schwarzer, Carpenter, Rücker, Schwarzer, Carpenter and Rücker2015).
Results
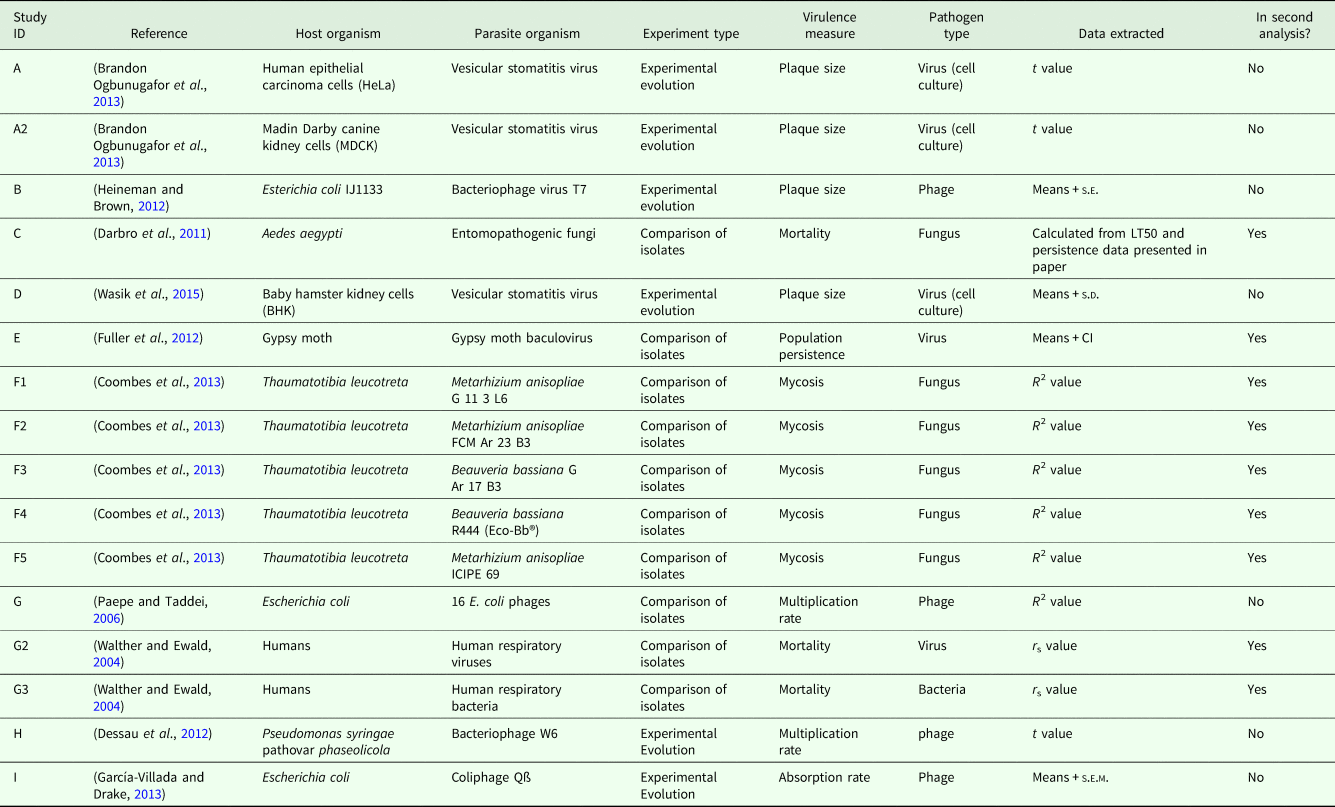
I found nine papers containing 16 datasets that met the criteria outlined above (Table 1). These 16 datasets were used for the first meta-analysis. Eight datasets from five published studies were included in this second, smaller analysis using just studies that used terrestrial, motile host species (Table 1). These numbers are well within the range of the number of studies typically used for meta-analysis with random-effects models (Guolo and Varin, Reference Guolo and Varin2017).
Studies included in the meta-analysis.

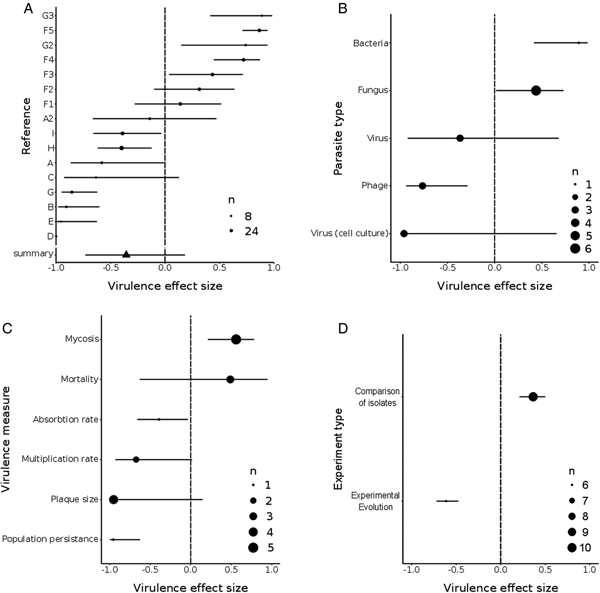
Both positive and negative effect size measurements were extracted from the included studies (Fig. 1A). There was no significant overall effect of parasite environmental persistence on virulence (r = −0.3555, z = −1.31, P = 0.1906).
Forrest plots of effect sizes for virulence. Positive values of effect size indicate a positive relationship between virulence and environmental persistence (longer persistence = higher virulence) and negative values indicate a negative relationship (longer persistence = lower virulence). The dashed line represents an effect size of zero (no relationship between persistence and virulence). ‘n’ indicates the sample size of each dataset included in the analysis. Bars represent 95% confidence intervals. (A) Effect size by study. ‘n’ indicates the sample size of each dataset included in the analysis. (B) Effect size by the moderator variable parasite type. ‘n’ indicates the number of datasets for each parasite type included in the analysis. (C) Effect size by the moderator variable virulence measure. ‘n’ indicates the number of datasets for each measure included in the analysis. (D) Effect size by the moderator variable experiment type. ‘n’ indicates the number of datasets for each experiment type included in the analysis.

Moderator variable analysis showed that parasite type had a significant influence of the direction of the effect size (Q = 123.77, d.f. = 4, P < 0.0001, Fig. 1B). Fungi had an overall positive effect size (r = 0.5154) along with the one study examining bacterial pathogens (r = 0.8900), whereas all three categories of virus showed overall negative effect sizes: phage (r = −0.6619), viruses manipulated in cell culture (r = −0.8885) and viruses studied in vivo (−0.3330).
Virulence measure did also have a strongly significant influence on the direction of effect size (Q = 43.57, d.f. = 6, <0.0001, Fig. 1C), although this is likely to be largely a consequence of covariance between parasite type and virulence measure. It is interesting to note that the more direct measures of virulence showed overall positive effect sizes: mortality (r = 0.4886) and mycosis (r = 0.5600); however, all but one of these studies were on fungi which showed overall positive effect sizes (Table 1). More indirect measures showed negative effect sizes: absorption rate (r = −0.3895), multiplication rate (r = −0.8544), plaque size (r = −0.9493), population persistence (r = −0.6725), although again, the majority of these studies used viruses (Table 1).
The type of experiment also influenced the effect size and direction (Q = 68.91, d.f. = 1, P < 0.0001, Fig. 1D), although again this may be a consequence of covariance with parasite type. Experimental evolution studies, where parasite persistence was under selection in the laboratory had an overall negative effect size (r = −0.6135), whereas studies looking at parasite isolates with differing life histories showed an overall positive effect size (r = 0.2063). It is important to note however that all included experimental evolution studies used viral parasites, potentially explaining this difference.
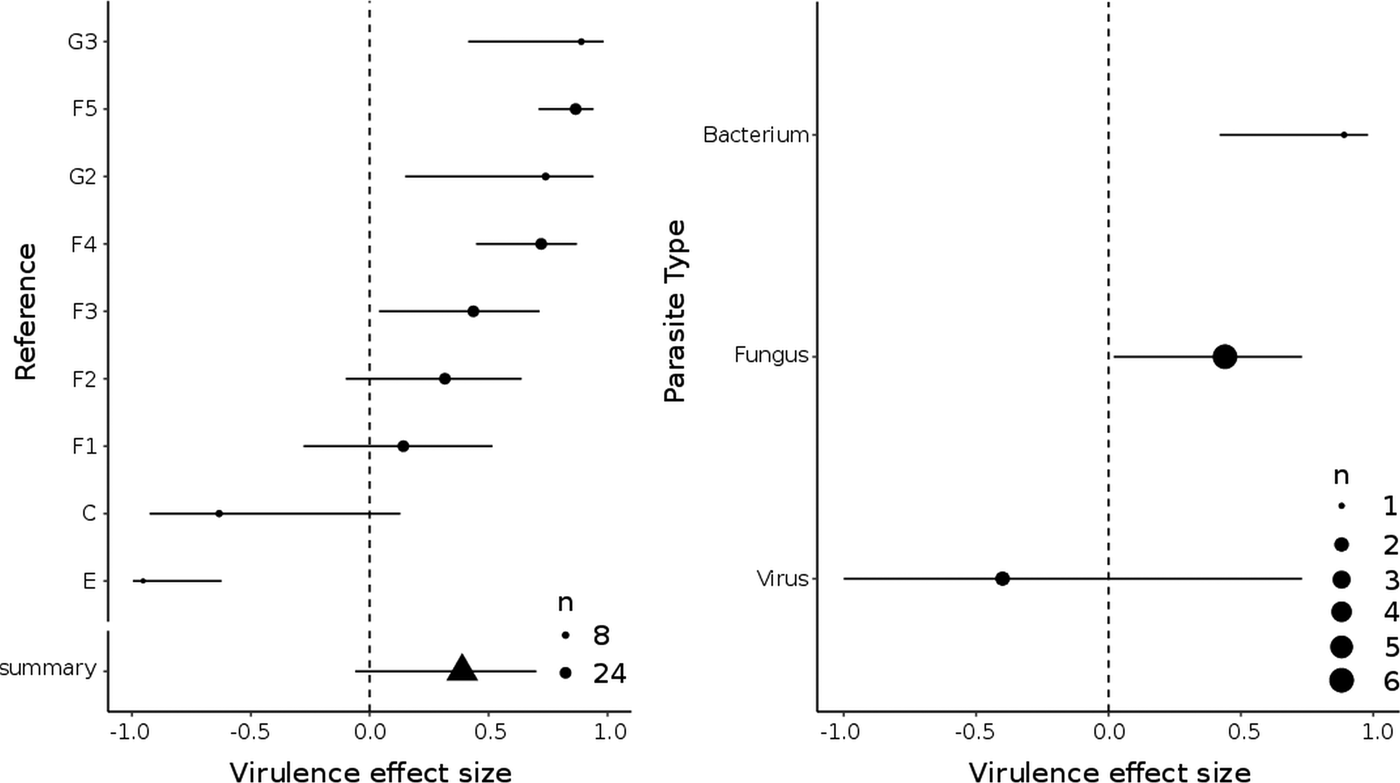
The second analysis, containing only data from studies using terrestrial, motile host species, showed a non-significant trend towards a positive effect size (r = 0.3871, z = 1.71, P = 0.0872) (Fig. 2A). Parasite type was also tested as a moderator variable in this smaller analysis and showed a trend in line with that of the larger analysis. There was a near significant trend of parasite type influencing the direction of the effect (Q = 5.68, d.f. = 2, P = 0.0584). This was caused by viruses showing an effect in the opposite direction (r = −0.4) to both bacteria (r = 0.89) and fungi (r = −0.43) (Fig. 2B).
Forrest plots of effect sizes for virulence for the second smaller analysis. Positive values of effect size indicate a positive relationship between virulence and environmental persistence (longer persistence = higher virulence) and negative values indicate a negative relationship (longer persistence = lower virulence). The dashed line represents an effect size of zero (no relationship between persistence and virulence). ‘n’ indicates the sample size of each dataset included in the analysis. Bars represent 95% confidence intervals. (A) Effect size by study. ‘n’ indicates the sample size of each dataset included in the analysis. (B) Effect size by the moderator variable parasite type. ‘n’ indicates the number of datasets for each parasite type included in the analysis.

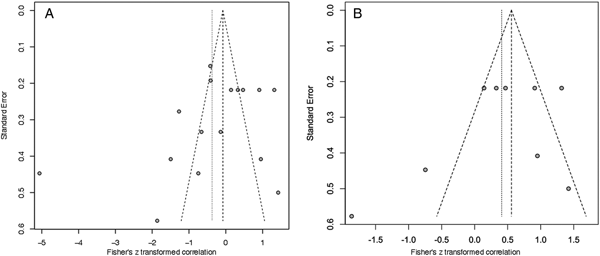
Funnel plots from neither the larger or smaller analysis indicated publication bias (Fig. 3), with points on both plots falling roughly symmetrically within the plot. Although the plots do not form a strictly funnel shape, there is no strong bias on the side of the central line on which the plots fall. The lack of a tight point at the top of the plot is most likely due to a lack of studies with large sample sizes and thus small errors.
Funnel plots of the relationships between virulence and environmental persistence. Each point represents a dataset included in the meta-analysis. The grey, dashed lines show the effect size and confidence limits predicted by the meta-analysis model. (A) Funnel plot of the first meta-analysis. (B) Funnel plot of the second smaller analysis.

Discussion
My analysis shows that there are cases both where virulence and persistence in the environment are correlated and cases where they are not. Further, my smaller analysis shows a trend towards supporting the sit and wait hypotheses but demonstrates that even when studies only strictly testing the hypothesis are included, there are still cases in which the data tend to support the resource allocation hypothesis. Interestingly, when studies that do not meet the criteria for testing the sit and wait hypothesis (Walther and Ewald, Reference Walther and Ewald2004) are removed, the trend for support switches from a negative correlation between virulence and persistence to a positive one in line with the sit and wait hypothesis. At present this is only a trend and not significant, but this is likely an effect of the low number of studies that have tested the hypothesis to date. My moderator variable analysis shows that a number of factors may determine whether the data as a whole show a positive or negative relationship between virulence and environmental persistence, with the caveat that some cannot be disentangled from others as the literature stands at present. Measure of virulence and type of experiment, though both significantly associated with the direction of the effect, strongly co-varied with parasite type and as such a fuller dataset and rigorous, controlled, experimental tests may yield altogether different results and a solid conclusion cannot be drawn on the importance of these variables at present.
The differences in relationship between virulence and persistence between viruses and bacteria and fungi may largely be due to fundamental differences in infection biology which govern whether or not the two traits are linked or traded-off. Both the larger and smaller analyses indicate that viruses show a different relationship between virulence and persistence than other parasite types. Many viruses must break down their protective capsid and release genetic material to infect, meaning that although a strong capsid may be favourable for persistence, it would likely impede infectivity (Goldhill and Turner, Reference Goldhill and Turner2014) potentially explaining why we observe data consistent with the resource allocation trade-off hypothesis in viruses and those in favour of the sit and wait hypothesis in other kinds of parasite. In the bacterium B. anthracis, for example, the capsule encasing spores both likely provides environmental protection (Thorne, Reference Thorne1993; Mock and Fouet, Reference Mock and Fouet2001), promoting longevity and also acts as a virulence factor by masking the spore from the host's immune system (Makino et al., Reference Makino, Uchida, Terakado, Sasakawa and Yoshikawa1989), thus intrinsically linking virulence and persistence. The results indicate that resource allocation trade-offs in viruses may be more important in determining their virulence than trade-offs surrounding the maintenance of motile hosts for transmission. The ability to maximally exploit hosts when this is allowed for by the ecology of the system may be precluded by the costs of investing in traits necessary for environmental persistence.
An additional factor that may influence the differences observed across taxa is the relative likelihood of coinfection in the included systems. Particularly in the entomopathogenic fungi systems, infection is likely to occur regularly by multiple spores to single hosts (Thomas et al., Reference Thomas, Watson and Valverde-Garcia2003). On the other hand, many viral systems, particularly phage systems, have mechanisms that prevent invasion of a single cell by multiple viral particles (Hirsch-Kauffmann et al., Reference Hirsch-Kauffmann, Pfennig-Yeh, Ponta and Herrlich1976; Turner et al., Reference Turner, Burch, Hanley and Chao1999). Some of the systems used in studies included in this meta-analysis do indeed possess such mechanisms. The phi6 bacteriophage (Dessau et al., Reference Dessau, Goldhill, McBride, Turner and Modis2012) is able to limit multiple infection, although coinfection does occur (Turner et al., Reference Turner, Burch, Hanley and Chao1999). The bacteriophage T7 (Heineman and Brown, Reference Heineman and Brown2012) is able to go one step further and completely eliminate other, even homologous, phages from the cell it is infecting (Hirsch-Kauffmann et al., Reference Hirsch-Kauffmann, Pfennig-Yeh, Ponta and Herrlich1976). It must, however, be noted that in the other viral systems, including the cell culture system included in our meta-analysis, multiple infection was possible (Cooper, Reference Cooper1958). Further the phage systems included in the analysis used aqueous environments with host mixing, so did not strictly test the sit and wait hypothesis which fundamentally relies on the motility of terrestrial hosts (Walther and Ewald, Reference Walther and Ewald2004). Gandon (Reference Gandon1998) predicts that virulence and persistence may only be correlated in the presence of multiple infection. The fact that in the fungal and bacterial systems, multiple infection may be common and in viral systems is rarer may explain the between taxon differences in the direction of the effect described here.
Although the studies reported show data supporting both positive and negative correlation between virulence and persistence and lending support to both the sit and wait hypothesis and resource allocation hypothesis and the hypotheses have been thoroughly mathematically investigated (Bonhoeffer et al., Reference Bonhoeffer, Lenski and Ebert1996; Gandon, Reference Gandon1998; Kamo and Boots, Reference Kamo and Boots2004; Roche et al., Reference Roche, Drake and Rohani2011), my meta-analysis shows that we are still not able to confidently predict the conditions under which we expect each to occur, although it indicates that parasite taxon may be important. Experimental evolution provides a powerful tool to specifically test and disentangle factors influencing the relationship between parasite virulence and persistence. To date, however, all experimental evolution has either been carried out on viruses in cell culture or on bacterium-phage interactions (Dessau et al., Reference Dessau, Goldhill, McBride, Turner and Modis2012; Brandon Ogbunugafor et al., Reference Brandon Ogbunugafor, Alto, Overton, Bhushan, Morales and Turner2013; García-Villada and Drake, Reference García-Villada and Drake2013; Wasik et al., Reference Wasik, Bhushan, Ogbunugafor and Turner2015), which may not represent ecologically realistic conditions (Goldhill and Turner, Reference Goldhill and Turner2014) and do not explicitly test the sit and wait hypothesis (Walther and Ewald, Reference Walther and Ewald2004). Particularly required are experimental evolution studies on whole organisms in terrestrial environment, where host motility and migration are possible. Such studies should include a wider variety of parasites, under conditions where the costs and benefits of both environmental persistence and virulence can be realized.
Author ORCIDs
Charlotte Rafaluk-Mohr, 0000-0002-6245-7941
Acknowledgements
Thanks to Kayla King for advice, support and useful feedback and for comments on an earlier version of this manuscript. I would also like to thank Paul Ewald and a second anonymous reviewer, whose comments greatly improved the quality of the manuscript.
Financial support
This research received no specific grant from any funding agency, commercial or not-for-profit sectors.
Conflict of interest
None.
Ethical standards
Not applicable.