I. INTRODUCTION
Neutron powder diffraction is a useful tool because elemental scattering contrast is quite different when compared with X-rays. Elements in the periodic table often have quite different scattering cross sections for neutrons vs. X-rays. Unlike standard laboratory X-ray sources, synchrotron sources, nuclear research reactors, and pulsed neutron sources are sited at national facilities (available worldwide). One of the initiatives of the ICDD® is to expand the content of the PDF-4+ to include powder diffraction from facilities outside the X-ray laboratory. Of particular interest is the use of high resolution powder techniques available at X-ray synchrotron sources and pulsed neutron sources. Even though constant wavelength neutron sources are exceedingly productive, pulsed neutron sources continue to be at the technology edge.
A key initiative is to calculate TOF neutron diffraction powder patterns for inclusion data display in the ICDD Powder Diffraction File™ (PDF), PDF-4 (Faber and Fawcett, Reference Faber and Fawcett2002; Faber, Reference Faber2004). The case for inclusion of constant wavelength (CW) neutron diffraction data in the PDF has already been published by (Faber et al., Reference Faber, Crowder, Blanton, Kabekkodu, Gourdon, Blanton and Fawcett2014).
For search/match tools, the idea of an internal standard was recognized by Visser and Wolff (Reference Visser and Wolff1964), who saw the potential for data files with relative intensities. Corundum was selected as a reference material and its use in the PDF is ubiquitous. The reference intensity ratio (RIR), I/I c, is obtained from corundum data and the X-ray diffraction quantification of I/I c is available from the work of Hubbard et al. (Reference Hubbard, Evans and Smith1976). In this paper, we specifically define the TOF derived I/I c as TOF-I/I c and extend this technology to TOF powder diffraction data.
II. TOF RELATIONSHIPS
For neutron TOF, the relationship between the d-spacing for a particular Bragg peak and its TOF are described by:
 $$t({\rm microseconds}) = {\rm DIFC} \bullet {\rm d + DIFA} \bullet {\rm d}^2 {\rm + ZERO}{\rm.} $$
Given the flight path in the instrument (source to detector), the time for any particular neutron wavelength can be obtained from Eq. (1). The calibration constants, DIFC, DIFA, and ZERO are defined by instrument calibration. The Bragg scattering d-spacings then define the TOF.
We have chosen to use the Thompson–Cox–Hasting profile function. This function was developed by Thompson et al. (Reference Thompson, Cox and Hastings1987) and then extended to treat TOF neutron patterns in GSAS (Larson and Von Dreele, Reference Larson and Von Dreele2000) as described by:
 $$H(\Delta t) = (1 - \eta )N\big[ {e^u erfc(y) + e^v erfc(z)} \big] - \displaystyle{{2N\eta} \over \pi} \left\{ {{\mathop{\rm Im}\nolimits} \left[ {\exp (\,p)E_1 (\,p)} \right] + {\mathop{\rm Im}\nolimits} \left[ {\exp (q)E_1 (q)} \right]} \right\},$$
where the first term involves the convolution of a Gaussian with leading and lagging exponentials. The second term creates a Lorentzian component in the peak shape. The Lorentzian components can be used to characterize crystallite particle size and strain.
In addition,
Δt = t − t(peak), E1 is defined as an exponential integral,
 $$p = - \alpha \Delta t + \displaystyle{{i\alpha \gamma} \over 2}\;{\rm and}\;q = - \beta \Delta t + \displaystyle{{i\beta \gamma} \over 2},$$
 $$u = \displaystyle{\alpha \over 2}\left( {\alpha \sigma ^2 + 2\Delta t} \right){\rm,} \;v = \displaystyle{\beta \over 2}\left( {\beta \sigma ^2 - 2\Delta t} \right){\rm,} \;y = \displaystyle{{\alpha \sigma ^2 + \Delta t} \over {\sqrt {2\sigma ^2}}} {\rm,} \;z{\rm =} \displaystyle{{\beta \sigma ^2 + \Delta t} \over {\sqrt {2\sigma ^2}}}, $$
 $$\alpha = \alpha _1 /d,\;\beta = \beta _0 + \beta _1 /d^4, \;\sigma ^2 = \sigma _0^2 + \sigma _1^2 d^2 + \sigma _2^2 d^4, \;\gamma = \gamma _0 + \gamma _1 d + \gamma _2 d^2. $$
The details of these parameters and equations are spelled out in the GSAS Technical Manual (Larson and Von Dreele, Reference Larson and Von Dreele2000). An important point is that for each Bragg peak, the integral of the profile function, H, is defined by ∫H(Δt) = 1.0, which means that the calculated integrated intensity is distributed over all the points in the profile function.
We can use PDF-4+ 2016 to demonstrate the on-the-fly powder pattern calculation for LaB6. The selection of the profile function is illustrated in Figure 1. The PDF-4+ 2016 allows for the selection of other instruments, for example NOMAD or VULCAN (SNS, ORNL), or HRPD or POLARIS (ISIS). The only requirement is that an appropriate instrument parameter file be imported to the database, or if necessary, manually entered.
Selecting preferences for the instrument parameter file: PGHR_60-2015a.prm is for the POWGEN TOF diffractometer at the Spallation Neutron Source (SNS). We have specified Bank = 2 for high resolution and acceptable TOF range. The profile parameters are for a Thompson-Cox-Hastings pseudo-Voigt convoluted with leading and lagging exponential tails. In this case the binning scheme is defined by the selection of Δt = step width = constant = 6 µs.

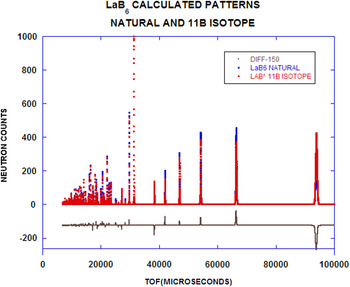
For LaB6 (NIST Standard Reference Material, SRM 660C), a subsequent on-the-fly calculated powder pattern is illustrated in Figure 2. Notice that calculated patterns are shown for both a natural abundance of B and enriched 11B (seen in SRM 660C). The significant differences arise from the choice of scattering cross-section for the B atoms. Another feature of the PDF-4+ is one that can select an isotope on an atom site specific basis. Of the many enhanced features in the POWGEN instrument response function, the resolution function is very high and the peak shape asymmetry is almost negligible. We can make scattering power adjustments by selecting an appropriate isotope (when available). The classic example is D/H substitution. The scattering length for H, b H = −3.739 fm and for D, b D = 6.6715 fm, which creates enormous scattering contrast. We have neglected the background contributions, but this will be addressed in a subsequent paper.
On-the-fly TOF powder pattern calculation for LaB6 (natural isotope) and La11B6 (enriched with 11B). The instrument used to simulate these powder patterns is POWGEN at the Spallation Neutron Source (SNS) at Oak Ridge National Laboratory (ORNL). The point-by-point differences are illustrated in the bottom of the figure.

The TOF patterns in Figure 2 were generated using binning based on Δt = 6 µs. Alternatively, we could have selected dt/t constant. In either case, the best resolution appears at large TOF or large d-spaces. This is where the density of Bragg peaks is lowest (in contrast to X-ray diffraction, where the best resolution occurs at smallest d-spaces or largest 2Θ where the density of Bragg peaks is largest).
III. INTEGRATED INTENSITIES AND I/I C
In the case of a two-phase mixture, I/I c, is defined as the ratio of the intensity of the strongest line from the unknown to that for the strongest line of corundum for a 1:1 w:w mixture. If integrated intensities are used then this ratio is called the Reference Intensity Ratio (RIR).
The PDF-4+ 2016 has 271 449 entries with atomic coordinates that can be used to calculate TOF powder diffraction patterns. Historically, the ICDD has provided important search/match tools for phase identification: e.g., Hanawalt, Fink and Long8 methods. As an important adjunct for these methods, calculated I/I c have also been supplied for quantification phase identification.
Hubbard et al. (Reference Hubbard, Evans and Smith1976) have developed I/I c relations for X-rays. We have extended this treatment to consider both neutron constant wavelength (CW) data and neutron TOF data.
For X-ray powder diffraction thick flat plate geometry, the count rate is defined by:
 $$P = \left( {\displaystyle{{P_o} \over {32\pi R}}} \right)\left( {\displaystyle{{e^4} \over {m^2 c^4}}} \right)\left( {\displaystyle{{\lambda ^3 M\left \vert {F^2} \right \vert} \over {2\mu V^2}}} \right)\left( {\displaystyle{{1 + \cos ^2 2\theta} \over {\sin ^2 \theta \cos \theta}}} \right){\rm.} $$
In Eq. (2), the first bracket contains the source-dependent terms, the second is the Thompson one-electron scattering, the third is the sample-dependent terms and the incident wavelength, and the last is the Lorentz-Polarization factor.
From Bacon (Reference Bacon1975) for cylindrical sample geometry and neutron CW powder diffraction:
 $$\displaystyle{P \over {I_o}} = \left( {\displaystyle{{\lambda ^3 l_s} \over {8\pi r}}} \right)\left( {\displaystyle{{V\rho ^{\prime}} \over \rho}} \right)\left( {\displaystyle{{\,jN_c^2 F^2} \over {\sin \theta \sin 2\theta}}} \right)e^{ - 2{\rm W}} A_{hkl}. $$
In Eq. (3), the first term contains incident geometry and incident wavelength, the second contains the actual sample volume corrected for packing density, the third contains the multiplicity, j, and the Lorentz factor. A hkl is the absorption factor (energy dependent). The apparent density compared with the theoretical density, ρ′/ρ becomes the packing fraction for the powder in a cylindrical container. This equation requires normalization since we do not know the incident beam flux-on-sample or the detector efficiency. We choose λ = 1.5406 Å as the reference state so that I/I c = 1.0 for corundum at that wavelength.
For cylindrical neutron TOF powder diffraction (Bacon, Reference Bacon1975):
 $$P = i(\lambda )\left( {\displaystyle{{\lambda ^4 l_s} \over {8\pi r}}} \right)\left( {\displaystyle{{V\rho ^{\prime}} \over \rho}} \right)\left( {\displaystyle{{\,jN_c^2 F^2} \over {2\sin ^3 \theta}}} \right)e^{ - 2{\rm W}} {\rm A}_{hkl} {\rm.} $$
Substituting Bragg's Law and defining the scattering per unit cell:
 $$\eqalign{& P = i(\lambda )\left( {\displaystyle{{l_s} \over {\pi r}}} \right)\left( {\displaystyle{{\rho ^{\prime}} \over \rho}} \right)\sin \theta \left( {\displaystyle{{\,jF^2 d^4} \over {V_{{\rm cell}}}}} \right)e^{ - 2{\rm W}} {\rm A}_{hkl} {\rm} \cr & {\rm and} \cr & L = {\rm sin}\theta, \;{\rm so}\;{\rm that}\;{\rm we}\;{\rm can}\;{\rm define:}\;\gamma = \displaystyle{{Ljd^4 F^2 e^{ - 2{\rm W}} A_{hkl}} \over {V_{{\rm cell}}}} {\rm.}} $$
Notice in Eq. (5) there exists a d 4 term, which means that large d-space reflections are stronger than one might anticipate (recall that because the flux-on-sample has a Maxwellian component in the thermal region, the flux at large d-spaces would be expected to fall off in intensity).
Then for TOF neutron data, we have I/I c defined by:
 $${\rm TOF} - \displaystyle{I \over {I_c}} = \displaystyle{{\gamma \rho _c} \over {\gamma _c \rho}} = \displaystyle{{\gamma M_c V} \over {\gamma _c MV_c}} {\rm,} $$
where M is the molecular weight per unit cell and V is the cell volume. In Eq. (6), the subscript c refers to corundum data, the absent subscript refers to the “unknown”.
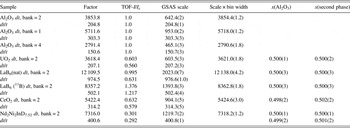
Given these relationships, we can proceed to populate the data seen in Table I, using a program called TOFtchEDbatv46. This program is used to generate the calculated powder patterns for all entries in the editorial database that have atomic coordinates and structure. A similar version of this program has been integrated into PDF-4+ 2016 so that on-the-fly calculated pattern calculation can be carried out. After generating the digitized powder pattern, we have analyzed the data using GSAS (Larson and Von Dreele, Reference Larson and Von Dreele2000; Toby, Reference Toby2001). We can carry out this step because we have full structural data in the PDF-4+. In principal, we expect a perfect match between the pattern calculated with PDF-4+ and the least squares structural refinement carried out in GSAS. From theory, I/I c for neutron TOF data are not the same as that for neutron CW data.
Selected results of powder pattern calculation in PDF-4+. The channel or constant bin width, dt = 6 µs. The entries with dt/t were generated using a binning scheme with dt/t = 0.0004. The factor entries are recovered from the on-the-fly software and represent scaling the calculated pattern to 1000.0 for the strongest reflection. This is illustrated in Figure 2. The TOF-I/I c values were calculated in a computer program, TOFtchbatv46, written for editorial purposes. The x values are weight fractions of the constituent phases.

In general, TOF-I/I c is detector bank dependent, although for calibration purposes we have forced this to not be so for corundum data (this is the reference dataset). The column marked “factor” is the scaled (Imax = 1000) intensity in PDF-4+ 2016. This program calculates the total pattern for this structure. To check these results we employ GSAS to fit the calculated patterns results from PDF-4+.
In passing, we should point out that GSAS takes the dt = constant data and scales by the bin width (in this case, dt = 6 µs). In all cases the constant dt = 6 data scales almost precisely with the scale used by GSAS (compare factor with S × 6 micros columns). This confirms our powder pattern calculation when compared with GSAS.
To confirm I/I c, we take the calculated pattern, scaled by I/I c, then compare two patterns: (1) corundum and (2) scaled second phase compound. As can be seen in Table I, we expect x(Al2O3) and x(second phase) should be 1:1. GSAS shows that this is indeed the case for three test cases, LaB6 11B Bank2 dt = 6, CeO2 Bank 2 dt = 6, Nd2Ni2InD7.52 Bank2 dt = 6, and finally Nd2Ni2InD7.52 Bank 2 dt/t = 0.0004 (Table I).
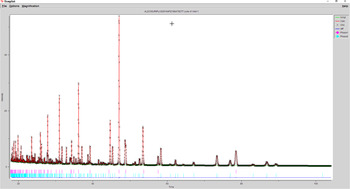
For a mixture of Al2O3 and Nd2Ni2InD7.52 (PDF entry 01-082-8427), the GSAS plot is shown in Figure 3. The pattern is a synthetic sum of two calculated patterns from on-the-fly calculations. The composite dataset was used as input to GSAS.
GSAS refinement results for Al2O3 and Nd2Ni2InD7.52. The red tic marks are for Al2O3, and the blue ones are for Nd2Ni2InD7.52. The weight fractions from GSAS are 0.500(1) and 0.500(1). The model and theory agree very well. The residuals, obs-calc for this refinement are negligible. The difference pattern is (dark blue) shown in the bottom of the figure.

IV. SUMMARY
We have demonstrated the ability to calculate TOF powder diffraction patterns in two ways: as on-the-fly patterns and as static entries in PDF-4+ 2016. On-the-fly TOF diffraction patterns are available for 271 449 entries in PDF-4+ 2016. The population of static PDF “Cards” for these entries will be completed and available in the PDF-4+ 2017 release of the product. We have used GSAS to refine the calculated patterns and have shown that we are able to recover the structural detail from the calculated patterns.
For quantitative analysis, we have shown how to calculate TOF values of RIR (TOF-RIR). One unique aspect of the theory is that both X-ray and neutron CW values for RIR show significant wavelength dependence, whereas TOF values have the wavelength dependence built-in (the wavelength dependence is integrated into the TOF coordinate). The CW-RIR and TOF-RIR values will be incorporated as static entries into the PDF-4+ 2017.
ACKNOWLEDGEMENT
We gratefully acknowledge a release from Von Dreele (2015, Personal Communication) to use three specific Fortran routines, expint.for (which did not contain a copyright notice), epsvoigt.for and hfunc.for in connection with our code writing for on-the-fly TOF calculations.