







1. Introduction
Granular materials are omnipresent in nature and industry. Their discrete nature and frictional contact interactions lead to a highly nonlinear rheology with solid-like, liquid-like and gas-like features described in terms of contact networks, collective particle rearrangements and inelastic collisions (Jaeger, Nagel & Behringer Reference Jaeger, Nagel and Behringer1996; Radjai, Roux & Daouadji Reference Radjai, Rous and Daouadji2017). This picture is even more intricate in the presence of cohesive and viscous forces induced by a binding liquid between particles (Brewster et al. Reference Brewster, Grest, Landry and Levine2005; Mitarai & Nori Reference Mitarai and Nori2006; Rognon et al. Reference Rognon, Roux, Naaim and Chevoir2008; Lefebvre & Jop Reference Lefebvre and Jop2013). Capillary adhesion implies broader ranges of stability in the stress space, development of tensile forces, higher levels of porosity, aggregation, enhanced inhomogeneity of the microstructure and radically different flow behaviour under gravity. Liquid viscosity induces lubrication forces depending on particle surface roughness and the amount of liquid (Radjai & Richefeu Reference Radjai and Richefeu2009; Mani, Kadau & Herrmann Reference Mani, Kadau and Herrmann2013; Jarray et al. Reference Jarray, Shi, Scheper, Habibi and Luding2019). Even small amounts of liquid condensed from the vapour phase within contact zones between particles (capillary bridges) in an assembly of sub-mm particles gives rise to significant cohesive stress of the order of  $\gamma _s/d$, where
 $\gamma _s$ is liquid–vapour surface energy and
 $d$ is mean particle diameter (Iveson et al. Reference Iveson, Litster, Hapgood and Ennis2001; Richefeu et al. Reference Richefeu, El Youssoufi, Peyroux and Radjai2008).
During the past 20 years, the mechanical strength and failure of cohesive granular materials have been at the focus of several experimental and numerical studies (Pierrat & Caram Reference Pierrat and Caram1997; Delenne et al. Reference Delenne, El Youssoufi, Cherblanc and Bénet2004; Fournier et al. Reference Fournier2005; Vo et al. Reference Vo, Mutabaruka, Nezamabadi, Delenne, Izard, Pellenq and Radjai2018). Wet granular flows have been investigated in various geometries (Huang et al. Reference Huang, Ovarlez, Bertrand, Rodts, Coussot and Bonn2005; Richefeu, El Youssoufi & Radjai Reference Richefeu, El Youssoufi and Radjai2006a; Richefeu, Radjai & El Youssoufi Reference Richefeu, Radjai and El Youssoufi2006b; Rognon et al. Reference Rognon, Roux, Wolf, Naaïm and Chevoir2006, Reference Rognon, Roux, Naaim and Chevoir2008; Radjai & Richefeu Reference Radjai and Richefeu2009; Gu, Chialvo & Sundaresan Reference Gu, Chialvo and Sundaresan2014; Guo & Curtis Reference Guo and Curtis2015; Saingier, Sauret & Jop Reference Saingier, Sauret and Jop2017; Mandal, Nicolas & Pouliquen Reference Mandal, Nicolas and Pouliquen2020; Shi et al. Reference Shi, Roy, Weinhart, Magnanimo and Luding2020). The impact of viscous forces on the rheology of granular materials have also been considered independently of cohesion (Boyer, Guazzelli & Pouliquen Reference Boyer, Guazzelli and Pouliquen2011; Trulsson, Andreotti & Claudin Reference Trulsson, Andreotti and Claudin2012; Amarsid et al. Reference Amarsid, Delenne, Mutabaruka, Monerie, Perales and Radjai2017; Gnoli et al. Reference Gnoli, De Arcangelis, Giacco, Lippiello, Ciamarra, Puglisi and Sarracino2018; Macaulay & Rognon Reference Macaulay and Rognon2021). The effect of capillary cohesion on mixing rates and size segregation has also been a subject of extensive research (Geromichalos et al. Reference Geromichalos, Kohonen, Mugele and Herminghaus2003; Chou, Liao & Hsiau Reference Chou, Liao and Hsiau2010; Liu, Yang & Yu Reference Liu, Yang and Yu2013a; Lim & Wee Reference Lim and Wee2014; Liao Reference Liao2018). Furthermore, the particle-scale mechanisms underlying the macroscopic cohesion of aggregates have been investigated by means of particle dynamics simulations (Feng & Yu Reference Feng and Yu2000; Radjai & Richefeu Reference Radjai and Richefeu2009; Berger et al. Reference Berger, Azéma, Douce and Radjai2016).
Wet aggregates are of special interest in this context as they are often naturally present in wet granular materials. For example, the behaviour of water-stable aggregates in soils is an important factor for the erodibility of lands by water and wind, the potential of soils to crust, soil permeability, infiltration rates and capacity of soils to sustain long-term crop production. Understanding the impact of various environmental changes such as drying–wetting cycles and mechanical forces on the breakdown of soil aggregates is therefore essential for modelling soil degradation (Xu, Hong & Song Reference Xu, Hong and Song2017). The physics of the nucleation, growth and breakage of wet aggregates underlies also wet granulation (agglomeration), which is a widespread process in industry. Capillary forces have been extensively studied in this context (Ennis, Tardos & Pfeffer Reference Ennis, Tardos and Pfeffer1991; Bocquet et al. Reference Bocquet, Charlaix, Ciliberto and Crassous1998; D'Anna Reference D'Anna2000; Geromichalos et al. Reference Geromichalos, Kohonen, Mugele and Herminghaus2003; Liu, Yang & Yu Reference Liu, Yang and Yu2013b; Raux & Biance Reference Raux and Biance2018; Vo et al. Reference Vo, Nguyen, Nguyen, Nguyen and Vu2022; Walls, Thompson & Brown Reference Walls, Thompson and Brown2022). The nucleation stage is governed by wetting thermodynamics during the first contact between powder and binder. The growth of aggregates inside a granulator occurs as a result of coalescence or snowballing of aggregates and powder particles. The collisions lead either to rebound or aggregation depending on the amount of available liquid binder and the ratio of inertial to viscous or capillary stresses. The breakage of wet aggregates is a limiting factor for the final aggregate size and content in number of aggregates. It involves the granule mechanical strength and the viscosity of the binder.
Despite extensive research work, the criteria for the growth and breakage of wet aggregates remain highly elusive. Even today, because of the short duration of interactions and often small sizes of the particles and aggregates, experimental techniques are unable to provide detailed quantitative information on these processes. In contrast, particle dynamics simulations based on the discrete element method (DEM) provide far more detailed information on the positions and velocities of all particles of the aggregate and the forces acting between them during a simulation (Thornton, Ciomocos & Adams Reference Thornton, Ciomocos and Adams1999). Furthermore, DEM-based simulations make it possible to control the underlying physical interactions, eluding thereby material complications of real materials, in order to focus on the generic behaviour. More parametric studies can be performed in a second stage to single out the effects of specific input parameters in higher physics-fidelity models of real granular materials.
In this paper we use extensive particle dynamics simulations to analyse the breakage dynamics of wet aggregates composed of spherical particles interacting via elastic, capillary and viscous forces. The simulations consist in preparing stable aggregates with different values of liquid surface tension and viscosity, and performing impact tests with a rigid wall for different incident velocities. Although impact tests are commonly used to quantify dynamic mechanical properties of materials, such as elasticity, energy dissipation and failure, there have been few studies dealing with impact tests of wet granular materials (Fu et al. Reference Fu, Reynolds, Adams, Hounslow and Salman2005; Marston, Mansoor & Thoroddsen Reference Marston, Mansoor and Thoroddsen2013; Peters, Xu & Jaeger Reference Peters, Xu and Jaeger2013; Schaarsberg et al. Reference Schaarsberg, Peters, Stern, Dodge, Zhang and Jaeger2016; Khalilitehrani et al. Reference Khalilitehrani, Olsson, Rasmuson and Daryosh2018; Chen et al. Reference Chen, Liu, Zheng and Li2021). Less attention has also been paid to the impact dynamics of wet aggregates containing a small amount of liquid (Nguyen et al. Reference Nguyen, Rasmuson, Thalberg and Niklasson Björn2015; Khalilitehrani et al. Reference Khalilitehrani, Olsson, Rasmuson and Daryosh2018; Chen et al. Reference Chen, Liu, Zheng and Li2021), where the latter is in the form of binary bridges between the particles, the so-called pendular state (Lian, Thornton & Adams Reference Lian, Thornton and Adams1993; Pitois, Moucheront & Chateau Reference Pitois, Moucheront and Chateau2000; Mitarai & Nori Reference Mitarai and Nori2006; Richefeu et al. Reference Richefeu, El Youssoufi and Radjai2006a).
We are interested in the combined effects of impact velocity, capillary adhesion and lubrication force on the behaviour of aggregates. During impact, the incident kinetic energy is converted into deformation energy, which can lead to small elastic deformation of the aggregate and its rebound, plastic deformation with aggregate shape change, damage with the creation of cracks or breakage as a result of the rupture of a large number of capillary bridges. Such phenomena may occur simultaneous or consecutively. For example, breakage may occur after significant plastic deformation of the aggregate. As we shall see, the evolution of kinetic energy, and in particular the kinetic energy after impact, as compared with the initial capillary energy of the aggregate carries a clear signature of crossover between these regimes. Moreover, the effect of liquid viscosity is well captured by the capillary number with regard to both the critical incident energy above which the aggregate breaks and the amount of kinetic energy restituted to the fragments upon breakage.
In the following, we first describe in § 2 the numerical procedures for impact simulations. The model used to mimic inter-particle forces is carefully described, as well as the method implemented to build stable aggregates. In § 3 the impact dynamics of aggregates is studied by neglecting viscous dissipation inside capillary bridges and varying incident velocity and liquid surface tension in a broad range of values. The effects of liquid viscosity are investigated in § 4. We conclude in § 5 with a summary of our main findings and potential extensions of this work.
2. Numerical procedures
An in-house three-dimensional DEM-based particle dynamics platform, named cFGd3D, was used in this work. This code is based on a velocity-Verlet scheme for stepwise integration of the equations of motion of a collection of spherical particles. In the following, we present and discuss the interaction model and our method to build stable aggregates for impact tests.
2.1. Interaction model
The normal force  $f_n$ acting at the contact point between two particles is modelled as the sum of a visco-elastic force
 $f_{ed}$ and a force
 $f_{bridge}$ due to the presence of a capillary bridge:
 \begin{equation} f_n = f_{ed} + f_{bridge}. \end{equation}
The distance  $\delta _n$ between particles is used to represent elastic deflection when it is negative (overlap) and capillary bond length when it is positive (gap). The force
 $f_{ed}$ is expressed as the sum of a linear elastic repulsion force
 $f_n^e = - k_n\delta _n$ and a viscous damping force
 $f_n^d = - \gamma _n \dot \delta _n$, where
 $\gamma _n$ is the damping coefficient and
 $\dot {\delta }_n$ is the relative normal velocity; see figure 1 (Johnson Reference Johnson1985). Hence,
 \begin{equation} f_{ed} = \left \{ \begin{array} {@{}ll@{}} - k_n \delta_n - \gamma_n \dot\delta_n & \text{if} \ f_{ed} > 0\ \text{and} \ \delta_n \leq 0,\\ 0 & \text{otherwise} , \end{array} \right. \end{equation}
By convention, we have  $\dot \delta _n>0$ when two particles move away from each other and
 $f_n^e>0$. Just before separation (at
 $\delta _n = 0$),
 $f_n^d$ is negative while
 $f_n^e$ tend to zero and, as a result,
 $f_{ed}$ can be negative. Equation (2.2) ensures the physical condition of normal force positivity by imposing
 $f_{ed}$ to vanish when
 $f_n^e+f_n^d <0$. This condition holds for dry contacts, i.e. in the absence of a capillary bridge. When the bridge forces are added, the total force can become negative (attractive) as a result of the action of the capillary force.
Geometry of a capillary bridge between two particles with gap (a) and overlap (b).

The liquid is assumed to be in the pendular state, i.e. in the form of small bridges joining pairs of particles. Higher amounts of liquid can lead to the funicular state characterized by higher-order clusters such that liquid bridges span several particles. Experiments and numerical simulations show that capillary stress increases with the amount of liquid in the pendular state as the number of binary bridges increases. But the adhesion stress remains nearly constant as the amount of liquid is further increased in the funicular state (Scheel, Geromichalos & Herminghaus Reference Scheel, Geromichalos and Herminghaus2004; Delenne, Richefeu & Radjai Reference Delenne, Richefeu and Radjai2015). For this reason, the approximation of capillary interaction by a binary force law holds in the pendular state, but it may be also relevant for higher amounts of liquid.
The total force  $f_{bridge}$ due to a liquid bridge between two particles is the sum of capillary and viscous contributions:
 \begin{equation} f_{bridge}=f_{cap}+f_{vis}. \end{equation}
We assume that the liquid coats all particles and part of the liquid migrates from the surface to the contact zone when a contact is formed between two particles. The typical transfer time of liquid is  $t_r \sim \eta d/\gamma _s$, where
 $\eta$ is liquid viscosity (Mohan et al. Reference Mohan, Kloss, Khinast and Radl2014). When this time is small compared with the typical lifetime of a contact or duration of collision between two particles, we may consider that a capillary force
 $f_{cap}$ appears spontaneously between two particles as soon as they touch each other. When this is not the case, the amount of liquid
 $V_b$ in the capillary bond reflects the history of the deformations of the assembly. In our impact tests,
 $t_r$ is small in the whole range of values of system parameters. We therefore assume instantaneous formation of capillary bridges when the particles touch.
A capillary bridge between two particles persists when they move away from each other up to a debonding distance  $d_{rupt}$ where the liquid bridge is not stable anymore. The energy released by debonding is dissipated during the redistribution of the liquid. The debonding distance is directly related to the bond volume (Lian et al. Reference Lian, Thornton and Adams1993; Lian, Thornton & Adams Reference Lian, Thornton and Adams1998)
 \begin{equation} d_{rupt} = \left( 1+ \frac{\theta}{2} \right) V_b^{1/3}, \end{equation}
where  $\theta$ is the particle–liquid–gas contact angle. We assume that all capillary bridges share the same parameters, in particular, that they are formed with the same quantity of water
 $V_b$. In other words, it is assumed that there is a sufficient amount of liquid available whenever a contact is formed between two particles. This mean-field assumption makes it possible to implement efficient DEM simulations without having to deal with the thermodynamics or hydrodynamics of bridge formation that would make the simulations impractical or limited to very small number of particles and bridges.
The capillary force  $f_{cap}$ is obtained from the numerical solution of the Young–Laplace equation (Mikami, Kamiya & Horio Reference Mikami, Kamiya and Horio1998). This solution can be approached by an explicit expression (Richefeu et al. Reference Richefeu, El Youssoufi, Peyroux and Radjai2008),
 \begin{equation} f_{cap} = \left \{ \begin{array} {@{}ll@{}} - {\rm \pi}d \gamma_s \cos \theta & \text{for}\ \delta_{n} < 0, \\ - {\rm \pi}d \gamma_s \cos \theta {\rm e}^{{-\delta_{n}}/{\lambda}} & \text{for}\ 0 \leq \delta_{n} \leq d_{rupt}, \end{array}\right. \end{equation}
where  $\lambda$ is a characteristic length. In the quasi-static limit,
 $\lambda$ is given by (Richefeu et al. Reference Richefeu, Radjai and El Youssoufi2006b)
 \begin{equation} \lambda \simeq 0.9 \left( \frac{2V_b}{d} \right)^{1/2}. \end{equation}
The Young–Laplace equation is based on thermodynamic equilibrium and, thus, its use for high-speed impacts of aggregates is justified only if the liquid bridges follow the motions of particles. In the absence of experimental data on the full dynamics and rupture of a capillary bridge at high distortion rates of liquid bridges, we may rely on the orders of magnitude of the time scales involved in the impact problem. Obviously, the initial aggregate is in static equilibrium and the Young–Laplace equation is fully legitimate in this limit. During impact, this equation can provide a suitable approximation of the capillary force under two conditions: (1) The distortion of the liquid bond must occur at low Reynolds number, and (2) The return time of the liquid bridge to equilibrium must be short as compared with the rearrangement time of the particles.
The particulate Reynolds number is given by  ${Re} =\rho _\ell u d/\eta$, where
 $u$ is the average relative speed between particles and
 $\rho _\ell$ is the liquid density. The order of magnitude of
 $u$ is the same as the impact velocity
 $v$ although actually
 $u$ is generally lower than
 $v$ due to energy dissipation. The value of
 $d$ and the range of values of
 $\eta$ are given in table 1. For
 $\rho _\ell = 1000\,{\rm kg}\,{\rm m}^{-3}$, the highest value of
 ${Re}$ is 2. Hence, even for our highest impact velocities, the liquid bridge remains in the laminar regime.
Numerical and physical parameters.

The return time of the liquid bridge is similar to the transfer time  $t_r \sim \eta d/\gamma _s$ (Mohan et al. Reference Mohan, Kloss, Khinast and Radl2014).
In the simulations, given the range of parameter values used, the largest return time is  ${\sim }9\,{\rm ms}$. This time can be compared with the impact time whose value is
 $t_i \sim 1\,{\rm ms}$ (its value being controlled by contact stiffness and impact velocity). Hence, it can be argued that during the impact the capillary bridges have not enough time to be distorted. For this reason, we kept (2.5) for the capillary force and we released the values of
 $\lambda$. More precisely, we tested
 $\lambda$ in the range
 $[0.037d,0.42d]$, as shown in figure 2(a), while keeping the same debonding distance
 $d_{rupt}=0.1d$. According to (2.6), the value
 $\lambda =0.037d$ corresponds to the quasi-static limit for
 $d_{rupt}=0.1d$. As
 $\lambda$ increases, the capillary force comes closer to a constant value that is the maximum value of
 $f_{cap}$, resembling the case where the speed of separation between two particles is too fast to change the value of the force before the liquid bridge deforms or breaks. In other words, in this limit the post-impact relaxation of the particles begins with a higher value of the capillary force. However, as we shall see, the value of
 $\lambda$ has little influence on the impact. This is mainly due to the fact that over 90 % of capillary bonds in the initial state are at the contact points between particles or the gaps are very small.
(a) Capillary force  $f_{cap}$ normalized by
 $\gamma _s d$ as a function of the gap distance
 $\delta _{n}$ normalized by particle diameter
 $d$ for different values of the parameter
 $\lambda$, with a debonding distance
 $d_{rupt}=0.1d$. (b) Normal lubrication force
 $f_{vis}$ normalized by the characteristic force
 $\eta \dot {\delta _n}d$ as a function of the normalized gap
 $\delta _{n}/d$ for
 $d_{rupt}=0.1d$. In both cases, the dashed line indicates the hysteresis of bond formation/breakage: when the gap decreases between two particles, a liquid bond is formed spontaneously only when the two particles touch each other. This formation of the liquid bond is shown by the vertical dashed line at the origin. Then, the variation of the force as a function of gap follows the solid line and is reversible. The bond breaks up at the debonding distance and the force drops to zero. This is shown by the vertical dashed line at
 $\delta _n/d=0.1$.

Another relevant time is the post-impact rearrangements of the particles. This process being fully dynamic, its characteristic time  $t^*$ can be defined as the time required for a particle subjected to a force
 $\gamma _s d$ to move a distance equal to particle diameter
 $d$. Hence,
 \begin{equation} t^* = \sqrt{\frac{m}{\gamma_s}} \sim \sqrt{\frac{\rho d^3}{\gamma_s}}, \end{equation}
where  $\rho$ is the solid density of the particles. For the liquid bridges to follow the particle motions, we require that the relaxation time of the liquid
 $t_r$ is smaller than the rearrangement time
 $t^*$ of the particles under the action of capillary forces. This leads to the condition
 $\eta < \eta ^* = \sqrt {\rho d \gamma _s}$. This condition always holds for
 $\eta =0$. Otherwise, for the range of values of
 $\gamma _s$ used in the simulations, the lowest value of
 $\eta ^*$ is
 ${\sim } 0.08\,{\rm Pa}\,{\rm s}$ and its largest value is
 ${\sim }0.5$. On the other hand, the largest value of
 $\eta$ in the simulations is 0.3 Pa s but most values are indeed below 0.08 Pa s. As we shall see, the results for the two largest values of
 $\eta$ are indeed different due to incomplete relaxation. It must also be borne in mind that these are only the orders of magnitude of the typical times. In practice,
 $t_r$ depends on the degree of distortion while for its evaluation we have assumed that the liquid is distorted over a distance of the order of the particle size. The values of
 $t_r$ are therefore overestimated. We may conclude that, with the range of our parameter values, the use of the Young–Laplace equation is to a large extent justified and the error increases with the ratio
 $\eta /\sqrt {\rho d \gamma _s}$.
The presence of a liquid bridge between two particles induces also a lubrication force  $f_{vis}$. The tangential lubrication force being significantly lower than the normal lubrication force (Lefebvre & Jop Reference Lefebvre and Jop2013), we consider here only the normal lubrication force, which for two infinitely smooth spheres,
 $f_{vis}$ is given by (Brenner Reference Brenner1961)
 \begin{equation} f_{vis} = \frac{3{\rm \pi}}{8}\eta d^2 \frac{\dot{\delta}_n}{\delta_n}. \end{equation}
This expression diverges when  $\delta _n\to 0$, corresponding to the theoretical limit where no contact can form between two particles. However, in the case of rough spheres a natural cutoff occurs at a distance
 $\delta _{n0}$, representing the average height of the asperities. The lubrication force can therefore be approximated as
 \begin{equation} f_{vis} = \left \{ \begin{array} {@{}ll@{}} \dfrac{3{\rm \pi}}{8} \eta d^2\dfrac{\dot{\delta}_n}{\delta_n + \delta_{n0}} & \text{for}\ d_{rupt} >\delta_n > 0, \\ \dfrac{3{\rm \pi}}{8} \eta d^2\dfrac{\dot{\delta}}{ \delta_{n0}} & \text{for}\ \delta_n \leq 0. \end{array}\right. \end{equation}
As in the case of capillary force, a hysteresis is introduced since  $f_{vis}$ is not effective in the absence of a liquid bridge. The hysteresis path is shown in figure 2(b).
The bridge force  $f_{bridge}$ acts along the contact normal. We neglect the tangential lubrication force, which is an order of magnitude weaker than normal lubrication force. We also keep the friction coefficient
 $\mu _s$ between the grains and with the wall equal to zero to focus on the effects of liquid-induced forces. As a result, particle rotations are immaterial in our simulations. As discussed previously, the influence of parameters such as friction coefficient, debonding distance, tangential lubrication force, particle size distribution and particle shape can be evaluated in comparison to the breakage behaviour in the simpler case investigated in this paper with only three control parameters: impact velocity, surface tension and liquid viscosity.
2.2. Building stable aggregates
The aggregate is composed of spherical particles of the same size  $d$ interacting through the contact and liquid bond forces. For impact tests, we need aggregates of nearly spherical shape in stable equilibrium. We proceed in three steps. First, the primary spherical particles are deposited under gravity in a rectangular box by setting the friction coefficient and bond force to zero. Because of zero friction, the particles get jammed in a bed of highest packing fraction
 $\varPhi \simeq 0.64$ and a coordination number
 $Z_c \simeq 6$, corresponding to the connectivity of frictionless particles in the isostatic state (Agnolin & Roux Reference Agnolin and Roux2007a). We use
 $Z_c$ for the average number of contact neighbours per particle, to be distinguished from
 $Z_{nc}$, corresponding to the average number of bonds without contact per particle (
 $nc$ for ‘no contact’) when capillary bridges are present.
In a second step, a spherical aggregate composed of  ${\sim }1200$ particles is extracted from the bed. A small homothety is applied to the centres of all particles to reduce the overlaps induced by gravity and the corresponding elastic energy. This transformation lowers
 $Z_c$ to a value slightly below 4. While reducing the overlaps, the applied homothety is small enough to keep most gaps between particles below the debonding distance
 $d_{rupt}$. Under these conditions, the capillary energy is large enough to prevent the aggregate from explosion as a result of the release of elastic energy. In a third step, gravity is removed and capillary force law is activated for all pairs of particles with a separation distance
 $\delta _n$ below the debonding distance. The aggregate is allowed to relax under the action of capillary forces until a stable configuration in static equilibrium is reached. Note that, in exception to the initial state where the capillary bridges are added to all gaps between particles below the debonding distance, the general capillary force law with hysteresis is applied during relaxation and later during impact tests.
The aggregate is in an unstable state after the removal of gravity and addition of capillary forces. Its subsequent evolution results from simultaneous action of elastic repulsion due to initial overlaps and capillary attraction due to added bonds. Its evolution can be tracked by following the average kinetic energy per particle  $E_k = \langle \tfrac {1}{2}m v^2 \rangle$, where
 $m$ is particle mass and
 $v$ is particle velocity. A reference adhesion energy
 $E_{ref} = \gamma _s d^2$ can be defined from the surface tension, with which the kinetic energy can be compared. Figure 3(a) shows the evolution of
 $E_k/E_{ref}$ as a function of time
 $t$ during relaxation for three different values of
 $\gamma _s$. We see that in all cases
 $E_k$ rapidly increases with time due to the action of capillary forces and particle rearrangements before declining as a result of energy dissipation by inelastic collisions and rupture of a fraction of bonds. The time needed to reach the peak value of
 $E_k$ decreases with increasing
 $\gamma _s$. We may use the characteristic time
 $t^*$ to scale the times. The kinetic energy data of figure 3(a) are displayed in figure 3(b) as a function of scaled time
 $t/t^*$. The kinetic energy for the three values of
 $\gamma _s$ follows nearly the same evolution, suggesting that the dynamics of relaxation is controlled by surface tension and the inertia of the particles and
 $t^*$ is indeed the relevant rearrangement time. We also note that the peak value of the normalized kinetic energy is the same, indicating that the kinetic energy induced by capillary force scales with
 $\gamma _s d^2$.
Evolution of the average kinetic energy  $E_k$ per bond normalized by the reference adhesion energy
 $E_{ref}$ during the relaxation of an aggregate for three different values of surface tension as a function of time
 $t$ (a) and as a function of scaled time
 $t/t^*$ (b).

The average capillary energy per bond  $E_c$ normalized by
 $E_{ref}$ is plotted in figure 4 as a function of scaled time. The energy of a bond is the energy required for its breakage. For a bond with given length (gap or overlap)
 $\delta _n$, it can be calculated by integrating the capillary force
 $f_{cap}$ from
 $\delta _n$ to infinity (actually to
 $d_{rupt}$ beyond which the force is zero), i.e.
 \begin{equation} E_c = \left\langle \int_{\delta_n}^{d_{rupt}} f_{cap}(x) \, \mathrm{d}\kern0.07em x \right\rangle, \end{equation}
where the average is taken over all bonds (with their different values of  $\delta _n$). As expected,
 $E_c$ increases with time mainly as a result of the creation of new capillary bonds during relaxation but levels off at
 $t \simeq t^*$ when no new bonds can be created by rearrangements. This implies that the evolution of
 $E_k/E_{ref}$ beyond this point takes place without significant rearrangements and mainly through dissipation by damped vibrations.
Evolution of average capillary energy per bond  $E_c$ normalized by the reference adhesion energy
 $E_{ref}$ during the relaxation of an aggregate for three different values of surface tension as a function of scaled time
 $t/t^*$.

The contact coordination number  $Z_c$, gap (non-contact) coordination number
 $Z_{nc}$ and bond coordination number
 $Z_b = Z_c + Z_{nc}$ are shown in figure 5 as a function of scaled time. After an initial increase,
 $Z_c$ declines to a minimum before increasing again towards 6, corresponding to the topology of an isostatic state. The minimum occurs at the same time as the peak value of
 $E_k$, and the corresponding value of
 $Z_c$ increases with
 $\gamma _s$. This observation is consistent with the higher adhesion energy at larger
 $\gamma _s$. Here
 $Z_{nc}$ follows a mirror evolution with respect to
 $Z_c$, showing that the dynamics of relaxation occurs essentially within the debonding distance. The bond coordination number
 $Z_b$ declines and tends to a constant value while at the same time most non-contact bonds transform to contact bonds (decrease of
 $Z_{nc}$ and increase of
 $Z_c$). Hence, the evolution of the bonding structure continues beyond
 $t = t^*$ until
 $t \simeq 10 t^*$, where both
 $Z_c$ and
 $Z_{nc}$ reach a plateau. Before this point, the dynamics is governed by particle rearrangements and continuous decrease of
 $Z_b$ as a result of the loss of bonds as observed in figure 5(c).
Evolution of (a) contact coordination number  $Z_c$, (b) gap (non-contact) coordination number
 $Z_{nc}$ and (c) bond coordination number
 $Z_b$ (including both contacts and gap bonds) as a function of scaled time
 $t / t^*$.

The relaxed aggregates are characterized by a high packing fraction  $\varPhi \simeq 0.64$, a high contact coordination number (
 $Z_c \simeq 6$), a low gap coordination number (
 $Z_{nc} < 2$), a stable configuration with negligibly small kinetic energy
 $E_k$ and the highest capillary energy
 $E_c$ for each value of surface tension
 $\gamma _s$. Figure 7 displays a snapshot of a relaxed aggregate. We see that the forces induced by capillary attraction between particles are composed of both compressive and tensile forces that ensure the stability of the aggregate. Here
 $E_c$ in static equilibrium represents the strength of the aggregate as it is the average energy required to break a bond. For a single contact between two particles at static equilibrium,
 $E_c$ is the sum of two energies:
 $\int _{\delta _c}^{0} f_{cap}(x) \, \mathrm {d}\kern0.07em x + \int _{0}^{d_{rupt}} f_{cap}(x) \,\mathrm {d}\kern0.07em x$, where
 $\delta _c = -f_c/k_n$ is the overlap at equilibrium with
 $f_c = {\rm \pi}d \gamma _s \cos \theta$ according to (2.5). Simple algebra yields
 \begin{equation} E_c^{max} = \frac{({\rm \pi} d \gamma_s \cos \theta)^2}{2k_n} + {\rm \pi}d \gamma_s \cos \theta \lambda_f, \end{equation}
with
 \begin{equation} \lambda_f = \lambda(1- {\rm e}^{{-}d_{rupt}/\lambda}). \end{equation}
Note that the length  $\lambda _f$ varies between
 $\lambda$ for
 $\lambda \ll d_{rupt}$ and
 $d_{rupt}$ for
 $\lambda \gg d_{rupt}$. Hence, if
 $d_{rupt}$ is much smaller than particle size,
 $f_{cap}$ does not decrease significantly before the capillary bridge fails, and therefore,
 $\lambda$ is not relevant at first order. On the contrary, if
 $d_{rupt}$ is large compared with
 $\lambda$ and particle size, then the bridge is significantly stretched before breaking.
The first term in (2.11) is the elastic energy  $E_e$ stored in the contact
 \begin{equation} E_e = \frac{({\rm \pi} d \gamma_s \cos \theta)^2}{2k_n}, \end{equation}
whereas the second term is the energy  $E_g$ stored in the gap bond
 \begin{equation} E_g = {\rm \pi}d \lambda_f \gamma_s \cos \theta. \end{equation}
The ratio  $E_e/E_g \sim \gamma _s d/(k_n\lambda _f)$ is small in our simulations (and more generally for highly rigid particles) so that the elastic energy can be neglected and we have
 \begin{equation} E_c^{max} \simeq {\rm \pi}d \lambda_f \gamma_s \cos \theta. \end{equation}
In the next section we use  $E_c$ (as directly measured from simulations) to analyse the breakage of aggregates although, up to a prefactor,
 $E_c^{max}$ or simply
 $\gamma _s d \lambda _f$ also represent the capillary energy with a good approximation. During impact with a wall, the aggregate may undergo plastic deformations and breakage, and
 $E_c$ evolves with time. We denote by
 $E_c^i$ the capillary energy per bond in the relaxed state before impact and we will refer to it as the initial (or impact) capillary energy or cohesive energy of the aggregate. Figure 6 shows the ratio
 $E_c^i/E_c^{max}$ as a function of
 $\gamma _s$ for different values of
 $\lambda$. For all values of
 $\gamma _s$ and
 $\lambda$, this ratio varies between 0.92 and 0.94. As we shall see, this small difference between the two quantities is due to about
 $10\,\%$ of bonds that have no contact (gap bonds).
Ratio of the average capillary energy per bond  $E_c^i$ in relaxed aggregates to the maximum bond energy
 $E_c^{max}$ as a function of surface tension
 $\gamma _s$ for several values of the parameter
 $\lambda$.

Snapshot of a relaxed aggregate. The lines joining particle centres represent forces. Line thickness and colour code are proportional to the normal force  $f_n$ normalized by
 $\gamma _s d$. Compressive and tensile forces are of positive and negative signs, respectively.

We prepared as many relaxed stable aggregates as the number of different values of surface tension used to investigate breakage dynamics. All aggregates have the same values of  $d$,
 $k_n$,
 $\rho$,
 $\theta$ and
 $d_{rupt}$. The impact velocity
 $v$, surface tension
 $\gamma _s$ and liquid viscosity
 $\eta$ were varied in a broad range. The values and ranges of all simulation parameters are given in table 1. The normal damping parameter
 $\gamma _n$ is set to a value such that, together with the values of
 $\rho$,
 $k_n$ and
 $d$, implies a normal restitution coefficient
 $e'_n \simeq 0.4$ between primary particles. This value of
 $e'_n$ should, however, be considered as a measure of the inelasticity of contact without adhesive forces. In the presence of adhesion force between particles the rebound and effective restitution coefficient depend not only on
 $\gamma _n$ but also on adhesion and contact stiffness. As we shall see below, an effective restitution coefficient
 $e_n$ can be defined for the aggregate as a whole from the total kinetic energy of primary particles.
3. Impact dynamics in the capillary regime
3.1. Impact simulations
The impact simulations were performed by using the relaxed aggregates and assigning the same velocity  $v$ to all its primary particles in a direction perpendicular to a flat wall. As the gravity is set to zero, the orientation of the wall is immaterial. To focus on the dynamics and breakage of the aggregates, we assume that there is no friction and no capillary bonds can form between the wall and the primary particles of the aggregate. This means that the wall is hydrophobic. The aggregate is placed close to the wall and its evolution is monitored during and after impact with the wall. In all results presented in this section, the viscosity of the liquid bonds is set equal to zero in order to focus on the capillary cohesion. The influence of normal lubrication forces induced by liquid viscosity will be analysed in the next section.
The behaviour of the aggregate upon impact naturally depends on the relative importance of the impact kinetic energy per particle  $E^i_k = mv^2/2 = \rho {\rm \pi}d^3 v^2/12$ and the initial internal capillary energy per bond
 $E^i_c \sim E_c^{max}$. Their ratio defines a dimensionless number
 \begin{equation} s = \frac{E^i_k}{E^i_c} \simeq \frac{d}{12\cos \theta \lambda_f} \frac{d \rho v^2}{\gamma_s}. \end{equation}
Up to a prefactor of the order of 1 for small values of liquid volume,  $s$ is the deformation number introduced in the theory of agglomeration together with pore saturation to define the aggregate growth map (Adepu et al. Reference Adepu2016). This ratio can also be portrayed as the ratio of kinetic stress (kinetic energy per unit volume
 $\rho v^2$) and the cohesive stress
 $\gamma _s/d$.
Using  $s$ is convenient as it is defined from the system parameters
 $\gamma _s$,
 $d$ and
 $v$. However, in simulations we have access to the real value of
 $E^i_c$ and it is interesting to work directly with the ratio of the initial total kinetic energy and the total capillary energy of the aggregate:
 \begin{equation} \xi = \frac{N_p E^i_k}{N_b^i E_c^i} = \frac{2}{Z^i}\frac{E^i_k}{E_c^i} = \frac{2}{Z^i} s. \end{equation}
Here  $N_p$ is the total number of particles,
 $N_b^i$ is the total number of bonds before impact and
 $Z^i$ represents the coordination number of the aggregate before impact. We will refer to
 $\xi$ as the reduced kinetic energy of the aggregate before impact.
The kinetic energy is partially dissipated during the impact with the wall. Figure 8 shows the evolution of the total kinetic energy  $N_p E_k$ normalized by the total initial capillary energy
 $N_b^i E_c^i$ as a function of time for four different values of
 $\xi$. The kinetic energy keeps a constant value until the aggregate collides with the wall. The impact lasts for a few milliseconds during which the kinetic energy of the aggregate declines to a final value, which remains constant due to the rebound of the aggregate as a whole or the rebound of its fragments when breakage occurs.
Evolution of reduced kinetic energy of the aggregate with time for four different values of the initial reduced kinetic energy  $\xi$: (a)
 $\xi =0.007$,
 $\gamma _s=0.3\ {\rm N}\,{\rm m}^{-1}$,
 $v=0.1\,{\rm m}\,{\rm s}^{-1}$; (b)
 $\xi =2.20$,
 $\gamma _s=0.2\ {\rm N}\,{\rm m}^{-1}$,
 $v=1.5\,{\rm m}\,{\rm s}^{-1}$; (c)
 $\xi =3.78$,
 $\gamma _s=0.15\ {\rm N}\,{\rm m}^{-1}$,
 $v=1.7\,{\rm m}\,{\rm s}^{-1}$; (d)
 $\xi =78.5$,
 $\gamma _s=0.01\ {\rm N}\,{\rm m}^{-1}$,
 $v=2\,{\rm m}\,{\rm s}^{-1}$. Snapshots of the aggregates are shown in figure 10.

Figure 9 shows the evolution of the contact coordination number  $Z_c$ and bond coordination number
 $Z_b$ as a function of time for two different values of
 $\xi$. We observe that, as soon as the aggregate hits the rigid plane (at time
 $t=0$), both
 $Z_c$ and
 $Z_b$ drop and then increase again to some extent depending on the value of
 $\xi$. The large post-impact increase of
 $Z_c$ is a consequence of the relaxation of particles inside the generated fragments under the action of capillary forces. In this way, all contacts lost within the debonding distance, i.e. without the rupture of the capillary bond, are regained after a short time. In contrast, the smaller post-impact increase of
 $Z_b$ is due to a limited number of collisions between the generated fragments. Note that these re-aggregation events are, however, fundamentally different from the observed re-assembly of magnetized particles, which are governed by the action of long-range magnetic forces (Vledouts, Vandenberghe & Villermaux Reference Vledouts, Vandenberghe and Villermaux2015).
Evolution of the contact coordination number  $Z_c$ and bond coordination number
 $Z_b$ as a function of time during impact with the wall for two different values of
 $\xi$. The impact occurs at time
 $t=0$.

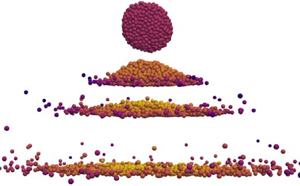
Figure 10 displays side-view snapshots of the aggregate during impact for each value of  $\xi$. The top views of the last states are shown in figure 11 in two cases. For the lowest value of
 $\xi$, the aggregate keeps its initial shape but it may rotate upon impact. The evolution of its kinetic energy in figure 8 shows a minimum value followed by a rebound with restitution of kinetic energy. For larger values of
 $\xi$, the aggregate remains in one piece and slightly bounces back off the surface. After impact, it loses its initial spherical shape and becomes flattened due to the plastic deformation of the aggregate. The evolution of its kinetic energy shows high dissipation and only a small amount of restitution. At even larger values of
 $\xi$, the aggregate remains in one piece but is damaged by losing a few particles and undergoes much larger local deformations modifying its boundary. For example, holes are distinguishable and its boundaries are jagged. In this case, the rebound of the ensemble is almost not observable but part of the energy is carried away by the detached particles. For the largest value of
 $\xi$, the aggregate is fragmented. Some fragments and primary particles are ejected from the aggregate and part of the kinetic energy is transferred to the fragments.
Side-view snapshots of the evolution of aggregates during impact for four different values of the initial reduced kinetic energy  $\xi$. The evolution of kinetic energy in each case is displayed in figure 8. The colours of the particles encode the particle velocities during impact. Results are shown for (a)
 $\xi =0.007$, (b)
 $\xi =2.20$, (c)
 $\xi =3.78$ and (d)
 $\xi =78.5$.

Top views of the last states of the damaged and fragmented aggregates shown in figure 10(c,d). Results are shown for (a)  $\xi =3.78$ and (b)
 $\xi =78.5$.

These four regimes are visually in qualitative agreement with what we observed in our preliminary experiments. Figure 12 displays top-view snapshots of the final configurations of wet aggregates fallen on a flat surface with different initial velocities. A mould of spherical shape (diameter 16 mm) was filled with glass beads (density  $2.4\,{\rm g}\,{\rm m}^{-3}$, diameter
 $150 \pm 25\,\mathrm {\mu }{\rm m}$) and mixed with a certain amount of pure water to obtain the desired liquid content (5 % of the weight). The mold was then shaken in a mixer to improve the homogeneity of the distribution of water. Finally, the aggregate was delicately removed out of the mold and released above a horizontal rigid plate from a height depending on the desired impact velocity. The snapshots show that at low enough impact velocities no significant deformation of the aggregate occurs. At higher velocities, the aggregate is deformed, and as the velocity is further increased, cracks also appear and the aggregate gets damaged or broken. Above
 $v=3.42\,{\rm m}\,{\rm s}^{-1}$, the aggregate breaks into an increasingly large number of pieces. In contrast to simulations, we observe no rebound of the aggregate in these experiments due to gravity and wet contacts with the flat surface.
Results of experimental impact tests with different initial impact velocities. Here, eight different wet aggregates having the same amount of liquid but different impact velocities are viewed from above after impact. The particles appear in white while the target surface is black.

In the following, we analyse the simulation data to identify quantitative signatures of the observed regimes. In particular, we consider two key issues. (1) Does the initial reduced kinetic energy  $\xi$ alone control the crossover to the aggregate fragmentation regime? (2) How does the final average kinetic energy per particle
 $E_k^f$, after impact, as shown in figure 8, depend on
 $\xi$?
3.2. Phase space of breakage
By looking at the snapshots in figure 10, we see that case (c), where the aggregate is deemed ‘cracked’, appears as an intermediate regime between regime (b), where the aggregate is highly deformed but no particle is detached, and regime (d), which is deemed ‘broken’. In real experiments such as those of figure 12, the loss of a few particles is not physically meaningful for the behaviour of the aggregate whereas in simulations with a much lower number of particles we need to set up a clear criterion to distinguish the regimes. We adopt therefore a criterion to qualify the aggregate as ‘broken’ based on the proportion of detached particles. We qualify the aggregate as ‘broken’ when it loses at least  $1\,\%$ of the total number of its constitutive particles. This criterion makes it possible not to consider as broken those aggregates whose particles would be, from the initial configuration, abnormally weakly linked to the others. Based on this criterion, aggregates that lose less than 1 % of their particles are not considered as broken. However, when the same impact test with nearly the same or close values of impact energy are repeated, the aggregate may either break or not. Most of time when the aggregate is not broken according to the above criterion, it loses a few particles. In this sense, the cracked regime can be qualified as the regime where the probability of breakage is high but the aggregate may not break.
As discussed previously, the phase space in this section is simply defined by the initial total kinetic energy  $N_p E_k^i$ and the initial total capillary energy
 $N_b^i E_c^i$. In figure 13 the outcomes of 182 simulations have been represented in this space. Each point corresponds to one simulation with its coordinates in the space
 $(N_p E_k^i, N_b^i E_c^i)$ and three different symbols are used for the three regimes ‘deformed’, ‘cracked’ or ‘broken’. The data presented in this phase space were obtained from simulations for
 $\lambda =0.42d$. Note that, here we do not distinguish the case of ‘elastically deformed’ aggregates, i.e. case (a) in figure 10, from plastically deformed aggregates, i.e. case (b) in figure 10, since the shape change of the aggregate is less obvious to define than detachment of particles used to qualify the breakage of aggregates. However, as we shall see, the signature of regime (a) is more easily defined from energy dissipation.
Phase space of particle breakage. The simulation data points are placed according to their total initial kinetic energy  $N_p E_k^i$ and total initial capillary energy
 $N_b^i E_c^i$ by full circles for broken aggregates, open circles for deformed aggregates and half-open circles for intermediate cases. The dashed lines are approximate boundaries between the three types of outcomes.

Figure 13 clearly shows three domains well separated by straight lines passing through the origin: (1) the domain of deformed aggregates in which the aggregates are never fragmented after the impact (open circles), (2) the domain of broken aggregates (full circles), and (3) the intermediate domain of cracked aggregates (half-full circles) or, put more accurately, domain of high probability of breakage. The frontier lines show that the ratio  $\xi = N_p E_k^i / (N_b^i E_c^i)$, i.e. the initial reduced kinetic energy, is enough to determine to which of the three regimes the system belongs. The boundaries between the domains can be more clearly defined by placing the data points in coordinates
 $(N_b E_c^i, \xi )$ as in figure 14 with an additional 62 simulations (presented in a different colour). These additional simulations were performed with samples having the same parameters as previous ones, but with different initial configurations of the aggregates. In this space, the boundaries for crossover to the intermediate regime and to breakage are
 $\xi _1= 2.1$ and
 $\xi _2 = 4.7$, respectively. According to (3.2), we would obtain a similar phase space up to a prefactor if the parameter
 $s$ or deformation number
 ${d \rho v^2}/{\gamma _s}$ were used instead of
 $\xi$. We also checked that these boundaries are almost independent of the choice of the value of
 $\lambda$. We therefore conclude that
 $\xi$ is the key parameter controlling the breakage behaviour of aggregates irrespective of the values of
 $\gamma _s$,
 $\lambda _f$ and
 $v$ when the viscosity of liquid bridges is neglected.
Phase space of particle breakage with the total initial kinetic energy  $N_p E_k^i$ and the initial reduced kinetic energy
 $\xi$ as coordinates. As in figure 13, full circles represent broken aggregates, open circles deformed aggregates and half-open circles intermediate cases. The dashed lines (
 $\xi =\xi _1= 2.1$ and
 $\xi = \xi _2 = 4.7$) design the boundaries between the three domains. The symbols in magenta represent 62 simulations performed in addition to those represented in figure 13 to confirm the results and better estimate the boundaries.

As discussed previously, the unpredictability associated with the intermediate domain is due to the finite number of particles forming the aggregate. We have not investigated the width of this domain as a function of the number of particles  $N_p$ nor the effect of primary particle size
 $d$. Instead, we focus below on the kinetic energy after impact and the change of the microstructure due to impact with the goal of further characterizing the transitions observed between different regimes.
3.3. Effective restitution coefficient
To characterize the dissipation of kinetic energy during impact, we define an effective normal restitution coefficient  $e_n$ of the aggregate from the total final kinetic energy
 $N_p E_k^f$ and the total initial kinetic energy
 $N_p E_k^i$:
 \begin{equation} e_n = \left(\frac{E_k^f}{E_k^i} \right)^{1/2}. \end{equation}
This definition is similar to that usually used to describe the inelasticity of particles during collisions, with  $1- e_n^2$ corresponding to the fraction of kinetic energy dissipated in the centre of mass of the system. Here,
 $e_n$ represents a collective restitution of energy: although the initial kinetic energy is carried by the aggregate as a whole, the kinetic energy after impact either continues to be carried by the aggregate if it does not break or by its fragments and individual particles if it breaks. We measured the kinetic energy 24 ms after the beginning of impact. As the evolution curves of kinetic energy in figure 8 show, for all simulations, this period of time is sufficiently long for the final value to correctly represent the post-impact energy. As we shall see in the next section, this is not always the case in the viscous regime. In the following, until the end of the paper, we omit the superscript ‘
 $f$’ and all quantities refer to their post-impact values (for example,
 $E_k$ represents
 $E_k^f$) and all initial values are explicitly denoted by superscript ‘
 $i$’.
In contrast to the expected and confirmed role of  $\xi$ as the control parameter for transition from a plastic deformation regime to a breakage regime, it is not obvious that
 $e_n$ should be fully controlled by a single parameter such as
 $\xi$. In particular, the issue is whether the evolution of
 $e_n$ is controlled by
 $\xi$ in all the identified regimes. Figure 15 shows
 $e_n$ as a function of
 $\xi$ on log-linear and log-log scales for all our simulations. We see that the data collapse on a single curve as a function of
 $\xi$, encompassing all regimes. This confirms the stronger role of
 $\xi$ as a control parameter of impact dynamics of the aggregate.
Effective restitution coefficient  $e_n$ of aggregates as a function of the initial reduced kinetic energy
 $\xi$ from all our simulation data in the capillary regime in log-linear (a) and log–log (b) scales. The symbols are the same as in figure 13 with the two vertical dashed lines marking the crossover values of
 $\xi$. The full lines are fitting forms from (3.4) and (3.5) for the ranges below and above
 $\xi =\xi _1 \simeq 2.1$, respectively.

The observed dependence of  $e_n$ on
 $\xi$ is not trivial. Below
 $\xi _1 \simeq 2.1$, which we identified as the upper bound of the plastic deformation regime,
 $e_n$ is a decreasing function of
 $\xi$ whereas beyond
 $\xi _1$,
 $e_n$ increases with
 $\xi$ up to values comparable to those at very low levels of
 $\xi$ (
 $e_n \simeq 0.2$). It is noteworthy that the values of
 $e_n$ around the transition point are very low (below
 $10^{-3}$), indicating that nearly the whole initial kinetic energy is dissipated. In other words, a reduced kinetic energy
 $\xi _1 \simeq 2.1$ is sufficient to fully deform an aggregate from its initially nearly spherical shape to a flattened shape as seen in figure 10(b). This energy is dissipated as a result of the loss of capillary bonds and normal damping during particle rearrangements. At this point, particle deformation by rearrangements is fully exhausted and the extra kinetic energy supplied beyond this limit (i.e. higher values of
 $\xi$) can only be consumed in crack nucleation and breaking the aggregate. For this reason, the cracking regime lies just after the minimum value of
 $e_n$. The increase of
 $e_n$ with
 $\xi$ is an indication that the extra energy does not merely propagate across the aggregate to break a maximum number of bonds, but is partially transferred to particles that get loose from the aggregate. In this range, the behaviour is fluctuating and energy dissipation is likely to depend on the details of the microstructure. However, energy transfer is amplified when the aggregate breaks at higher values of
 $\xi$ where an increasing amount of kinetic energy moves away with the generated fragments and
 $e_n$ increases as a result. In the deformation regime (before the minimum value of
 $e_n$), the restitution is due to the rebound of the whole aggregate.
Two points are important for a better understanding of this non-monotonic variation of  $e_n$. First, the total energy dissipation increases with
 $\xi$ even beyond
 $\xi _1$. Hence, the increase of
 $e_n$ simply means that a lower fraction of the supplied kinetic energy is dissipated beyond
 $\xi _1$ and, thus, a higher fraction is transferred to the fragments. The second point is that this difference is due to the rearrangements and plastic deformation before the aggregate can break. In other words, for
 $\xi > \xi _1$, the aggregate is first almost fully deformed before it begins to split. The amount of kinetic energy needed for the deformation phase is always the same. This is the energy dissipated by the deformation of the aggregate from an initial spherical shape to its nearly flattened shape. For this reason, the remaining reduced kinetic energy for breakage and restitution is
 $\xi - \xi _1$ and it increases linearly with
 $\xi$. This energy is available for breaking the capillary bonds and transfer to the fragments, both increasing therefore as a function of
 $\xi - \xi _1$. Finally, as the number of fragments increases, the number of breakable bonds decreases and, therefore, a lower amount of energy is consumed for bond breakage (see § 3.4). As a result, an increasing amount of energy is transferred to the fragments or detached particles and
 $e_n$ increases.
At highest values of  $\xi$, both the plastic deformation energy (
 $\xi _1$) and the total energy needed to break all bonds become small compared with
 $\xi$ and, thus,
 $e_n$ reflects mainly the dissipation due to collective rebound on the wall. For this reason,
 $e_n$ increases to values comparable to those at very low levels of
 $\xi$ where no rearrangements occur and the energy is only dissipated by rebound on the wall. The highest value of
 $e_n$ is around 0.3, which is slightly below the restitution coefficient
 $e'_n = 0.4$ between primary particles due to both the impact with the wall and the damped oscillations of the primary particles inside the fragments.
In figure 15 we can also clearly distinguish two subregimes below and above  ${\xi = \xi _0 \simeq 0.3}$ inside the deformation regime (below
 $\xi _1$). The dependence of
 $e_n$ on
 $\xi$ in this regime is asymptotically well fit to two power laws with different exponents, as seen in figure 15(b). The data can actually be fitted by a functional form combining the two power laws, i.e.
 \begin{equation} e_n = \frac{1}{A(\xi/\xi_0)^{\alpha} + B(\xi/\xi_0)^\beta}, \end{equation}
with  $A = B \simeq 35$,
 $\alpha \simeq 1/2$ and
 $\beta \simeq 2$. This form is shown in figure 15 and we see that it provides a functional description of the transition between the two subregimes. The transition occurs at
 $\xi _0$ with restitution coefficient
 $e_n \simeq 0.015$. The first subregime corresponds to inelastic rebound of the aggregate without plastic shape change, as observed in figure 10(a). The value of
 $e_n$ declines slowly as
 $\xi$ increases (with an exponent
 $-\alpha =-1/2$ since the term
 $B(\xi /\xi _0)^2$ in (3.4) can be neglected in this range). This decrease can be interpreted as a consequence of the increasing loss of capillary bonds. As we shall see, the number of bonds decreases with
 $\xi$. Plastic deformation occurs in the second subregime with a stronger decrease of
 $e_n$ as
 $\xi$ increases (with an exponent
 $-\beta =-2$ since the term
 $A(\xi /\xi _0)^{1/2}$ in (3.4) can be neglected in this range).
Interestingly, the breakage regime beyond  $\xi _1$ can also be well fitted to a double power-law function, i.e.
 \begin{equation} e_n = \frac{1}{A'\left({\xi}/{\xi_3}\right)^{\alpha'} + B'\left({\xi}/{\xi_3}\right)^{\beta'}}, \end{equation}
with  $A' \simeq 5$,
 $B' \simeq 2$,
 $\alpha ' \simeq -0.23$,
 $\beta ' \simeq -4.5$ and
 $\xi _3 \simeq 10$. The fitting function (3.5) is shown in figure 15. In the breakage regime,
 $e_n$ increases very fast with
 $\xi$ up to a crossover around
 $\xi _3$ to a much slower increase due to a more efficient use of incident energy for breakage of the bonds. In other words, in this transition as more fragments are generated due to higher impact energy, less energy is transported by each fragment. The snapshots of figure 10(d) belong to this regime, where we see that the aggregate is fully flattened and the breakage occurs within a thin layer of particles in contact with the wall.
The power-law dependence of restitution coefficient on  $\xi$ in all regimes may be attributed to the absence of an intermediate characteristic length scale. The kinetic energy is supplied at the scale of the aggregate but dissipated at the scale of particles. Energy is dissipated at all scales from aggregate down to primary particles. Note that the specific values
 $\xi _0$,
 $\xi _1$,
 $\xi _2$ and
 $\xi _3$, identified from the breakage criterion, and dependence of
 $e_n$ on
 $\xi$, do not represent typical values of
 $\xi$ in each regime but rather the crossover points between regimes that depend on the way energy is dispatched between bond breakage, normal damping and transfer to particles. Among these crossover values,
 $\xi _2$ is the only one that has no signature on the
 $e_n(\xi )$ curve. However,
 $\xi _2$ is quite close to
 $\xi _3$, suggesting that if the breakage criterion used to define broken aggregates is slightly increased,
 $\xi _2$ may coincide with
 $\xi _3$. It is also noteworthy that for the range of impact velocities applied in this work, we did not observe the breakage of aggregates into several large pieces. It seems therefore that full plastic deformation always precedes the breakage of the aggregate. This does not, however, elude piecewise breakage at very high impact velocities due to shock waves.
3.4. Fragment size distributions
In this section we focus more specifically on the cracking regime ( $\xi > \xi _1$). We discussed above the increase of the restitution coefficient in this regime with
 $\xi$ and attributed it to the decrease of the number of capillary bonds, leading to the increase of the fraction of energy transferred to the fragments. For a better understanding of this evolution, we consider here the variation of the contact coordination number
 $Z_c$ and bond coordination number
 $Z_b$, which, as we shall see, are correlated with the numbers and sizes of fragments due to the isostatic nature of the fragments in the absence of friction. As the plots of the evolution of energy in figure 8 show, the time elapsed (24 ms) after the beginning of impact is long enough to allow for substantial (if not full) relaxation of the aggregate or the generated fragments to a state close to static equilibrium.
We have seen that  $Z_c^i$ varies slightly in the initial aggregate due to the internal pressure generated by capillary forces. Up to these small variations,
 $Z_c$ is equal to its isostatic value of 6. If the aggregate is not broken, we expect that
 $Z_c$ remains equal to 6 after impact. Figure 16 shows
 $Z_c$ and
 $Z_b$ after impact as a function of
 $\xi$. We see that
 $Z_c$ is indeed close to 6 in the deformation regime (
 $\xi < \xi _1$). This is a confirmation that the aggregate has sufficiently relaxed after impact to reach the expected equilibrium value of
 $Z_c$. The small observed variations are due to those of
 $\gamma _s$ for different groups of data points. While
 $Z_c$ remains nearly constant,
 $Z_b$ declines with increasing
 $\xi$ first slowly in the elastic regime (
 $\xi < \xi _0$) and then faster in the plastic regime (
 $\xi _0< \xi < \xi _1$). The loss of capillary bonds in these regimes can be understood as a consequence of the hysteresis of the capillary force, which allows the formation of new bonds only when particles undergo sufficient collective rearrangements before they can touch one another and form new bonds.
Contact coordination number  $Z_c$ (a) and bond coordination number
 $Z_b$ (b) after impact as a function of
 $\xi$. The black symbols are direct measurements from simulations whereas red crosses in (a) are the values of
 $Z_c$ predicted by (3.9) by using the numerical values of
 $N_2$,
 $N_a$ and
 $P_0$.

In the cracking and breaking regimes  $\xi > \xi _1$,
 $Z_c$ declines almost logarithmically with
 $\xi$ from 6 down to values as low as
 $Z_c=3.8$. A few data points with lower values of
 $Z_c$ in figure 16 and escaping the general trend may be attributed to insufficiently relaxed fragments. We also see that
 $Z_b$ continues to decrease in the cracking and breaking regimes down to
 $Z_b =4$ for
 $\xi > 20$. The fact that the values of
 $Z_c$ and
 $Z_b$ collapse on a master curve as a function of
 $\xi$ is an indication that the dynamics of breakage is fully controlled by
 $\xi$. Figure 16(a) shows also the values of
 $Z_c$ predicted by the model described below.
To interpret the decrease of  $Z_c$ as a function of
 $\xi$ in the cracking and breaking regimes, while the system is assumed to be isostatic, we must account for the sizes of the generated fragments. Here
 $Z_c$ is calculated from the total number
 $N^*_p$ of particles having at least one contact (thus excluding floating particles, i.e. those that have no contact) and the total number
 $N_c$ of contacts, i.e.
 \begin{equation} Z_c= \frac{2N_c}{N_p^*}, \end{equation}
independently of whether the particles and their contacts belong to one or more fragments. Let  $P_0$ be the proportion of floating particles. Then, we have
 $N_p^* = N_p(1-P_0)$. The condition of isostaticity implies that
 \begin{equation} N_c = 3N_p^* - k, \end{equation}
where, because of a zero friction coefficient, only normal relative displacements and forces are assumed, and for spherical particles, the rotations are not introduced. The parameter  $k$ is the number of soft modes or mechanisms, i.e. the velocity fields that do not change the state of the system (Agnolin & Roux Reference Agnolin and Roux2007b). In our system, adding a uniform velocity or rotation to an aggregate composed of three or more particles does not change the configuration of the aggregate. Hence, for each fragment, we have
 $k=6$. For binary fragments (composed of only two particles), we have
 $k=5$ due to the axial symmetry of the fragment around the common contact point.
Let  $N_a$ be the total number of fragments composed of three or more particles and
 $N_2$ the number of fragments composed of two particles. Then, we have
 \begin{equation} k=6N_a + 5N_2. \end{equation}
Equations (3.6), (3.7) and (3.8) lead to the following expression of  $Z_c$:
 \begin{equation} Z_c = 6\left(1 - 2 \frac{N_a}{N_p(1-P_0)} - \frac{5}{3} \frac{N_2}{N_p(1-P_0)}\right). \end{equation}
This relation explains the decrease of  $Z_c$ as a function of
 $\xi$ when the aggregate breaks or
 $P_0$ increases. Below
 $\xi _1$, the aggregate is not broken, and we have
 $N_a=1$,
 $N_2=0$ and
 $P_0\simeq 0$, implying
 $Z_c = 6 - 12/N_p \simeq 6$. Above
 $\xi _1$,
 $N_a$,
 $N_2$ and
 $P_0$ begin to increase as a function of
 $\xi$ and
 $Z_c$ begins to decrease as a result.
Figure 17 shows the evolution of  $P_0$,
 $N_2$ and
 $N_a$ as a function of
 $\xi$. We see that both
 $P_0$,
 $N_2$ and
 $N_a$ begin to increase essentially from
 $\xi _2$, i.e. when the aggregate breaks, although a few particles are detached in the cracking regime. This is consistent with our criterion of at least
 $1\,\%$ detached particles for an aggregate to be deemed ‘broken’. For the largest kinetic energy, the breakage of the aggregate generates only about 14 % of floating particles and the largest number of binary aggregates is
 $N_2 \simeq 0.05N_p$. Hence, according to (3.9), the binary aggregates are responsible for a maximum loss of 0.6 in the value of
 $Z_c$. However, figure 16(a) shows that at high values of
 $\xi$,
 $Z_c$ declines from 6 to 3.6, which is a decrease of 2.4. This decrease is therefore mainly due to the generated fragments of three or more particles at high impact energies. Hence, for all values of
 $\xi$, we may consider that
 $N_2 \ll N_a$ and the average number of particles per fragment
 $N_{p/a}$ can be expressed and approximated as
 \begin{equation} N_{p/a} = \frac{N_p(1-P_0)}{N_a} \simeq \frac{12}{6- Z_c}. \end{equation}
This estimation includes the initial aggregate, which is not fully broken and its size is larger than the smaller detached aggregates. This distinction is not necessary at higher values of  $\xi$ as the initial aggregate disappears and we may assume that (3.10) provides a correct estimate of the average size of the aggregates.
Proportion of floating particles  $P_0$ (a), the number of fragments composed of two particles
 $N_2$ (b) and the total number of fragments composed of three or more particles (c) after impact as a function of
 $\xi$.

The plot of  $Z_c$ estimated from (3.9) is shown in figure 16(a) together with the values directly measured from the simulations as a function of
 $\xi$. For this estimation, we used the numerical values of
 $P_0$,
 $N_a$ and
 $N_2$ shown in figure 17. We see that the estimated values have basically the same trend as the measured values, but they are systematically higher and the difference increases with
 $\xi$. Since the model is based on the assumption of isostaticity, the only plausible explanation of this discrepancy is that, when the number of contacts is evaluated from the simulations (24 ms after impact), the fragments are not fully relaxed and, therefore, the number of contacts is underestimated.
Figure 18 shows the directly measured and estimated values of  $N_{p/a}$ as a function of
 $\xi$. We see that both values of
 $N_{p/a}$ decline from
 $N_p$ (i.e. the initial aggregate size when it does not break) down to values below 10. The lowest non-zero value of
 $Z_c$ corresponds to the limit where
 $N_a \ll N_2$, which can be reached at much higher impact velocities than those used in our simulations. In this limit, we have
 $N_2/N_p=0.5$ and
 $Z_c=1$. The slightly lower level of the estimated values of
 $N_{p/a}$ as compared with the measured values has the same origin as the discrepancy observed between the predicted and measured values of
 $Z_c$.
Average number of particles per fragment  $N_{p/a}$ as a function of
 $\xi$ both from direct measurement of fragment statistics (black squares) and from (3.10) (red crosses).

4. Effect of lubrication forces
In this section we are interested in the effect of lubrication forces on the impact behaviour of wet aggregates. We varied the viscosity  $\eta$ in a broad range of values up to 0.3 Pa s for a total number of 303 simulations. The initial aggregates were the same as those used for the impact simulations with zero viscosity for the same range of values of surface tension
 $\gamma _s$. We discuss below the lubrication effects along three lines: How does the transition between the deformation and breakage regimes depend on
 $\eta$? How does
 $\eta$ influence the effective restitution coefficient
 $e_n$ of the aggregate? How do the post-impact coordination numbers
 $Z_c$ and
 $Z_b$ vary with
 $\eta$?
4.1. Transition from deformation to breakage
To characterize the breakage phase space, we extend the parametric space to include  $\eta$. The main contribution of
 $\eta$ is to introduce a new source of energy dissipation. As
 $\xi$ reflects the relative importance of the initial kinetic energy
 $E_k^i$ to the initial capillary energy
 $E_c^i$, we introduce
 $\eta$ on the basis of the amount of energy
 $E_v$ dissipated by viscosity per bond as compared with
 $E_c^i$. At constant relative normal velocity
 $v_r$ between two particles, viscous dissipation can be evaluated by integrating the lubrication force
 $f_v$ given by its expression in (2.8) from the current gap distance
 $\delta _n$ to debonding distance and averaging over all bonds:
 \begin{equation} E_v = \left\langle \int_{\delta_n}^{d_{rupt}} f_{vis}(x) \, \mathrm{d}\kern0.07em x \right\rangle. \end{equation}
This is the amount of viscous energy dissipated when a bond breaks between two particles.
The largest value  $E_v^{max}$ of viscous dissipation occurs for a contact in equilibrium, in which case
 $\delta _n=\delta _c$. Hence, we obtain
 \begin{equation} E_v^{max} = \frac{3{\rm \pi}}{8} \eta d^2 v_r \left\{ \ln \left(\dfrac{d_{rupt}}{\delta_{n0}} \right) + \dfrac{{\rm \pi} d}{\delta_{n0}} \frac{\gamma_s}{k_n} \right\}. \end{equation}
Since  $\gamma _s/k_n \ll 1$, the second term can be neglected. We have seen previously that most bonds inside the initial relaxed aggregate before impact are contact points. For this reason, as in the case of capillary energy,
 $E_v^{max}$ is generally a reasonable approximation of
 $E_v$.
The relative normal velocity  $v_r$ between particles is proportional to the impact velocity
 $v$. Assuming that the aggregate deforms uniformly across its diameter, the scale factor is
 $d/D$, where
 $D$ is the diameter of the aggregate:
 \begin{equation} v_r \simeq v \frac{d}{D}. \end{equation}
We therefore define a reduced viscous dissipation as  $E_v^{max}$ normalized by
 $E_c$:
 \begin{equation} \kappa = \frac{E_v^{max}}{E_c^{max}} \simeq \frac{3{\rm \pi}}{8} \frac{d}{\lambda_f} \ln \left( \frac{d_{rupt}}{\delta_{n0}} \right) \frac{\eta v d}{\gamma_s D} . \end{equation}
Note that up to a numerical factor depending on  $d^{rupt}$,
 $\delta _{n0}$ (surface roughness) and
 $\lambda _f$, the reduced viscous dissipation is the same as the viscous capillary number defined by
 \begin{equation} {Ca} = \frac{\eta v d}{\gamma_s D}. \end{equation}
Figure 19 displays all data points in the parametric space defined by the coordinates  $\xi$ and
 $Ca$ on the logarithmic scale. The data points are placed with three different symbols as in the previous section for the three regimes ‘deformed’, ‘cracked’ and ‘broken’. Remarkably, despite the nearly random values of
 $\gamma _s$,
 $v$ and
 $\eta$, the data suggest a well-defined borderline between the deformation/cracking and breaking regimes. We also see that a transition occurs from the zone of low values of
 $Ca$, where the borderline corresponds to
 $\xi = \xi _2$ as in the purely capillary case, and the zone of higher values of
 $Ca$, where the value of
 $\xi$ at the crossover point increases with
 $Ca$. A single functional form nicely fits the borderline:
 \begin{equation} \xi = \xi_2 + \left( \frac{{Ca}}{{Ca}^*}\right)^h. \end{equation}
Here  ${Ca}^* \simeq 0.003$ and
 $h\simeq 2/3$. The value of
 ${Ca}^*$ corresponds to a transition from the capillary regime to the viscous regime as
 $Ca$ increases. The capillary regime (
 $Ca < Ca^*$) is characterized by a negligible effect of viscosity, and energy dissipation is essentially due to the dynamics of capillary bonds whereas in the viscous regime (
 $Ca > Ca^*$), viscous dissipation prevails. The observed higher values of
 $\xi$ in the viscous regime for crossover to the breaking regime means that the breakage of aggregates requires a larger impact velocity or lower surface tension due to the absorption of a significant amount of the impact energy by liquid viscosity.
Phase space of particle breakage defined by the initial reduced kinetic energy  $\xi$ and capillary number
 $Ca$. The simulation data points are represented by full circles for broken aggregates, open circles for deformed aggregates and half-open circles for cracked aggregates. The full line is a fitting form, given by (4.6), for the approximate borderline defining the crossover between the deformation and cracking regimes.

From (4.6) we obtain an equation that combines all impact parameters by replacing  $\xi$ by its approximate expression from (3.2) and
 $Ca$ by its expression from (4.5). Starting with parameter values such that the impact test takes place on the borderline, this relation predicts the effect of changing any of the parameters. For example, either increasing the incident velocity or decreasing the surface tension always leads to particle breakage independently of where on the borderline we are since the velocity appears on both sides of relation (4.6). Moving on the borderline implies a combined variation of the parameters such that
 $\xi - ({{Ca}}/{{Ca}^*})^h$ remains constant and equal to
 $\xi _2$. Furthermore, the same relation predicts that increasing
 $\eta$ without changing any other parameter leads to the stabilization of the aggregate whereas increasing aggregate size
 $D$ leads to its breakage. These predictions need to be checked by means of further simulations.
4.2. Effective restitution coefficient
As in the capillary regime, we consider here the effective restitution coefficient  $e_n$ of the aggregate as a function of both
 $\xi$ and
 $Ca$. Figure 20 shows
 $e_n$ as a function of
 $\xi$ for all impact tests with different values of
 $\eta$, including those with zero viscosity. We see that viscosity does not affect the general dependence of
 $e_n$ on
 $\xi$. For all values of
 $Ca$,
 $e_n$ declines with increasing
 $\xi$, passes by a minimum at
 $\xi =\xi '_1$ and then increases with
 $\xi$. It is interesting that our data points collapse on the same curve in the descending phase but they differ in the ascending phase according to the value of the liquid viscosity. Note that many data points on the descending branch of figure 20 correspond to impact tests with non-zero viscosity. In the presence of lubrication forces, the descending branch extends to lower values of
 $e_n$ than in the inviscid case and the transition to the ascending branch takes place at higher values of
 $\xi '_1$. This is consistent with a transition from capillary regime to viscous regime, as discussed in the previous section for crossover to the cracking regime. Nevertheless, we see that this transition to an ascending branch does not necessarily imply the fracture of the aggregates. Indeed, independently of viscosity, no breakage occurs when
 $e_n < 10^{-3}$. The increase of the transition point
 $\xi '_1$ with
 $Ca$ simply means that, due to liquid viscosity, more energy dissipation occurs in the capillary regime.
Effective restitution coefficient  $e_n$ as a function of
 $\xi$ for all impact tests including those with non-zero viscosities (shown in black) for different values of the capillary number
 $Ca$.

The general trend of  $e_n$ as a function of
 $\xi$ in the breaking regime is similar for different values of
 $Ca$. We do not have a sufficient number of data points for a quantitative description of the evolution of
 $e_n$ for each value of
 $Ca$. But figure 20 suggests that, as
 $Ca$ increases, the transition point
 $\xi '_1$ and the ascending curve of
 $e_n$ are shifted to higher values of
 $\xi$. On the other hand, for each value of
 $\xi$,
 $e_n$ in the breaking regime declines as
 $Ca$ increases. This shift is consistent with the fact that a higher proportion of energy is dissipated during plastic deformation and breakage of the aggregate due to the effect of lubrication forces. Technically, this means that the toughness of the aggregate increases with
 $Ca$ for a given value
 $\xi$.
4.3. Coordination numbers
Figure 21 shows the evolution of an aggregate during impact with the wall in the viscous regime for  $Ca = 2.25$ and
 $\xi = 177$, as well as the top view of its last registered configuration. The phenomenology of impact, spreading and fracture of the aggregate is very similar to what was observed in the inviscid case. As in the inviscid case, the fracture process can be quantified from the final values of the coordination numbers. Figure 22 shows both
 $Z_c$ and
 $Z_b$ as a function of
 $\xi$ for all values of
 $Ca$, including the impact tests with
 $\eta =0$. The trends are globally similar to those observed in the inviscid case but with higher values for each value of
 $\xi$. The contact coordination number
 $Z_c$ has a constant value close to 6 in the range
 $\xi < \xi '_1$ corresponding to the deformation regime. For higher values of
 $\xi$,
 $Z_c$ decreases at a rate that is nearly the same for all values of
 $Ca$. But since
 $\xi '_1$ increases with
 $Ca$,
 $Z_c$ also increases with
 $Ca$ for a given value of
 $\xi$. As a result, according to (3.9), the number of fragments decreases with increasing
 $Ca$. The bond number
 $Z_b$ follows a similar trend in the breaking regime. However, in contrast to
 $Z_c$,
 $Z_b$ decreases also in the deformation regime as a function of
 $\xi$ as in the inviscid case.
(a) Side-view snapshots of the time evolution of the impact of an aggregate in the viscous regime with  $Ca = 2.25$ and
 $\xi = 177$. (b) Top view of the last configuration of the same impact test.

Variation of the contact coordination number  $Z_c$ (a) and bond coordination number
 $Z_b$ as a function of the reduced initial kinetic energy
 $\xi$ for different values of capillary number
 $Ca$. Black symbols are data points of the inviscid case.

In figure 22(a) we also observe that the fragments with the two highest values of viscosity show anomalously low values of  $Z_c$. The corresponding bond coordination numbers are, however, well behaved without any apparent anomaly. These extremely low values of
 $Z_c$ can be explained by the long return time of the fragments to equilibrium. When the impact occurs, many contacts are lost without losing their liquid bridge. Such contacts can be regained subsequently under the action of the capillary force between particles provided the lubrication force is overcome before the end of the simulation, i.e. 24 ms after impact. For our two highest viscosities, the return time is longer than the simulation time. This is more directly evidenced in figure 23(a), which shows the proportions
 $P_0$ of floating particles as a function of
 $\xi$ for increasing values of the capillary number
 $Ca$:
 $P_0$ has anomalously high values for the two largest values of the liquid viscosity.
Proportions of floating particles (a) and total number of fragments composed of three or more particles after impact as a function of the initial reduced kinetic energy  $\xi$ for different values of capillary number
 $Ca$. Black symbols are data points for the inviscid case.

Consistently with other data, both  $P_0$ (figure 23a) and
 $N_a$ (figure 23b) begin to increase from zero in the breaking regime as a function of
 $\xi$, but at a rate that declines as
 $Ca$ increases. Figure 24 displays
 $N_{p/a}$ as a function of
 $Z_c$ from all simulations with different values of
 $\xi$ and
 $Ca$. In exception to the data points corresponding to our two highest viscosities, all data points collapse well on a master curve, which is closely approximated by the calculation of
 $N_{p/a}$ using (3.10) with the values of
 $P_0$ and
 $N_2$ shown in figure 23. Here also the discrepancy is due to the overestimation of
 $Z_c$ by the model.
Average fragment size (in number of particles)  $N_{p/a}$ as a function of contact coordination number
 $Z_c$ from simulations with different values of
 $Ca$ (symbols) and the model prediction according to (3.10) (black solid line).

5. Conclusion
We conducted extensive particle dynamics simulations to investigate the impact of wet aggregates on a rigid plane with varying impact velocity, surface tension and viscosity. The objective was to characterize different regimes and identify scaling parameters controlling the behaviour. By focusing on particle breakage or cracking, post-impact kinetic energy and aggregate connectivity, four distinct regimes were delineated: inelastic rebound, plastic deformation via particle rearrangements, cracking and breakage. The transitions between these regimes were analysed, revealing that they are fully governed by two dimensionless parameters: (1) the ratio of impact energy to the initial capillary energy of the aggregate (initial reduced kinetic energy), and (2) the capillary number defined from the ratio of viscous dissipation to capillary energy. An interesting finding of this study was the non-trivial relationship between these two numbers for breakage conditions. Furthermore, a transition from a capillary to a viscous regime was observed at a critical value of the capillary number.
The proposed scaling is grounded in a rigorous analysis of simulation data, yet it involves parameters that were not varied in this study, requiring further investigation for a comprehensive description of the impact process. One such parameter is the size of primary particles constituting the aggregates, suggesting that larger particle sizes may diminish aggregate stability and strength. Additionally, the influence of varying debonding distances is crucial to understanding their influence on capillary energy and the overall dynamics elucidated in this study.
In our simulations we set the friction coefficient to zero to build dense aggregates with high packing fractions in a well-defined isostatic state. Subsequently, during impact tests, we maintained a zero friction coefficient. This assumption is physically plausible in the case of an ideally smooth particle surface, where lubrication forces prevail. However, real particles always have some degree of surface roughness and friction can play a substantial role. Introducing a non-zero friction coefficient during initial particle relaxation would yield less-compact aggregates with lower coordination numbers. The effect of a non-zero friction coefficient during impact tests depends on the competing effects of reduced aggregate strength due to lower packing fractions and connectivity and enhanced strength resulting from reduced particle mobility. This interplay is anticipated to impact the onset of particle breakage and transitions between different regimes. A detailed parametric study can shed light on the efficacy of these competing mechanisms and their influence on regime crossovers. However, we anticipate that the fundamental physical insights derived from this study will remain intact.
In this work we also assumed that the target wall is hydrophobic and no capillary bonds can form between the primary particles and the wall. The presence of such bonds can enhance dissipation and reduce the effective restitution coefficient of the aggregate. It can also influence the spreading dynamics of the aggregate on the wall before its possible split into fragments. Comparing further simulations involving a wet wall with the results presented in this paper can allow for a clear quantification of wet wall effects. Further simulations encompassing a broader parametric space and laboratory impact experiments are necessary to verify and validate our findings about the scaling behaviour, different regimes, dynamics of spreading and breakage, transition values and effects of various system parameters.
Declaration of interests
The authors report no conflict of interest.


 Open access

