Introduction
Compared to traditional metallic biomaterials (such as stainless steel, Ti alloys, and Co alloys), magnesium and its alloys have many advantages in the case of orthopedic implants, such as low density, low Young’s modulus, and biodegradability [Reference Zeng, Dietzel, Witte, Hort and Blawert1, Reference Lin, Chen and Chen2, Reference Shi, Liu and Atrens3, Reference Atrens, Johnston, Shi and Dargusch4, Reference Atrens, Song, Cao, Shi and Bowen5]. These advantages make it possible to avoid second surgery and eliminate stress shielding effect [Reference Zhao, Gao, Gao, Yuan and Chen6, Reference Staiger, Pietak and Huadmai7]. However, one of the largest obstacles for clinical application of magnesium implants is their fast degradation. The fast degradation may result in the prefailure of in vivo implants, and the excessive gas bubbles can block the blood flow [Reference Raman and Harandi8, Reference Bian, Zhou, Liu, Li, Zheng and Sun9]. Under in vivo environment, the chloride ion concentration of the body fluid is about 150 mmol/L and the corrosion of magnesium is easy to occur. Furthermore, the orthopedic implants will also experience cyclic loading due to walking, running, and jumping [Reference Choudhary and Raman10, Reference Raman, Jafari and Harandi11]. The synergistic effect of corrosion and cyclic loading (i.e., corrosion fatigue) will cause magnesium and its alloys much more susceptible to failure. Accordingly, it is important to research the corrosion fatigue behavior of magnesium and its alloys under the simulated body fluid.
There have been a large number of studies dealing with the corrosion behavior of magnesium and its alloys [Reference Song and Atrens12, Reference Atrens, Song, Liu, Shi, Cao and Dargusch13, Reference Song and Atrens14]. However, only limited work has addressed the corrosion fatigue behavior of magnesium alloys under simulated body fluid [Reference Gu, Zhou and Zheng15, Reference Jafari, Raman and Davies16, Reference Jafari, Raman and Davies17, Reference Jafari and Raman18, Reference Liu, Chu and Ding19, Reference Chen, Lu, Cui, Xing, Gao and Chen20]. Corrosion fatigue behaviors of WE43, AZ91D, Mg–Ca, Mg–Zn–Ca, and HP-Mg under simulated body fluid were systematically investigated by Zheng et al. [Reference Bian, Zhou, Liu, Li, Zheng and Sun9, Reference Gu, Zhou and Zheng15], who found that the fatigue life decreases due to the stress concentration of corrosion pit and the corrosion rate increases with increasing cyclic loading due to the stress corrosion behavior. Raman et al. [Reference Choudhary and Raman10] studied the corrosion fatigue behavior of AZ91D with different electrochemical conditions under modified simulated body fluid. The results suggested inclusions and corrosion pits to be the crack initiation sites, and hydrogen embrittlement to play a dominant role in cracking of AZ91D magnesium alloy in modified simulated body fluid. Jafari et al. [Reference Raman, Jafari and Harandi11] compared the corrosion fatigue behavior of the ZX10 and ZX50. The results showed that ZX10 has the resistance to corrosion fatigue superior to ZX50 attributed to grain boundary strengthening and the absence of cathodic noble intermetallic phases. Based on a series of corrosion fatigue tests on Ca–P-coated AZ91D magnesium alloy under different cyclic loading amplitudes, Jafari et al. [Reference Jafari and Raman18] reported that the improvement in resistance to corrosion fatigue of the alloy in modified simulated body fluid is little mainly because of the dissolution of the coating layer and the presence of defects which act as fatigue initiation sites under cyclic loading conditions.
Although many factors are taken into account, the effects of different pH values of simulated body fluid on the corrosion fatigue behavior of magnesium alloys were not reported as yet. Under in vivo conditions, the normal pH value of the body fluid is about 7.4. However, due to the inflammation reaction of the bone fracture area, the pH value of the body fluid drops to 5.2 and then gradually recovers to 7.4 by about two weeks [Reference Zeng, Dietzel, Witte, Hort and Blawert1, Reference Liu, Chu and Ding19, Reference Liu, Xin and Tian21]. Moreover, the pH value of the blood may decrease due to the release of hydrogen ions caused by glucose metabolism while exercising [Reference Alberti and Cuthbert22]. Cheng et al. [Reference Ng, Chiu and Cheng23] and Atrens et al. [Reference Johnston, Shi and Atrens24] investigated the influence of pH value on the corrosion rate of magnesium and its alloys, respectively. They found that the corrosion rate of magnesium and its alloys increases with the decrease in pH value. However, there has been no study concerning the effect of pH value on the corrosion fatigue properties of magnesium alloys under simulated body fluid.
In the present paper, the corrosion and corrosion fatigue tests were conducted on AM60 magnesium alloy in PBS solution. The effect of different pH values on the corrosion and corrosion fatigue behavior was systematically investigated.
Results
Electrochemical test and immersion test
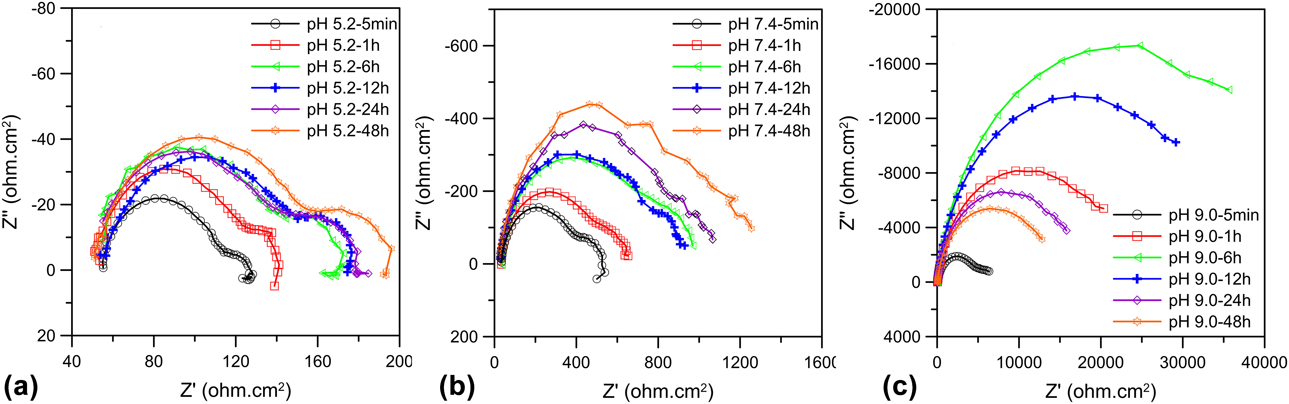
Figure 1 shows the Nyquist diagrams of AM60 immersed in PBS solutions with different pH values for 5 min, 1, 6, 12, 24, and 48 h. The Nyquist diagrams [Fig. 1(a)] of the pH 5.2 PBS solutions at different time intervals all consisted of one high-frequency capacitance loop, one low-frequency capacitance loop, and one low-frequency inductance loop. The EIS spectra were similar except for the difference in the diameters of the loops. This suggests that the corrosion mechanisms are the same, while the corrosion rates are different. The Nyquist diagrams [Fig. 1(b)] of the pH 7.4 PBS solutions immersed in PBS for 5 min consisted of one high-frequency capacitance loop, one medium-frequency loop, and one low-frequency inductance loop. During the subsequent immersion times, the low-frequency inductance loop disappeared. Chen et al. [Reference Chen, Wang, Han, Dong and Ke25] also observed the similar phenomenon; they attributed the presence of inductive loop at the initial immersion time to the occurrence of metastable Mg+ ions, and it can be explained by the phenomenon mentioned above. The Nyquist diagrams [Fig. 1(c)] of the pH 9.0 PBS solutions immersed in 5 min shows one high- to medium-frequency capacitance loop while only one capacitance with the immersion time increased. This can be attributed to the incomplete film formation at a short exposure time [Reference Kannan and Raman26].
Nyquist plots of EIS data for AM60 magnesium alloy in different pH value PBS solutions at different time intervals: (a) pH 5.2; (b) pH 7.4; (c) pH 9.0.

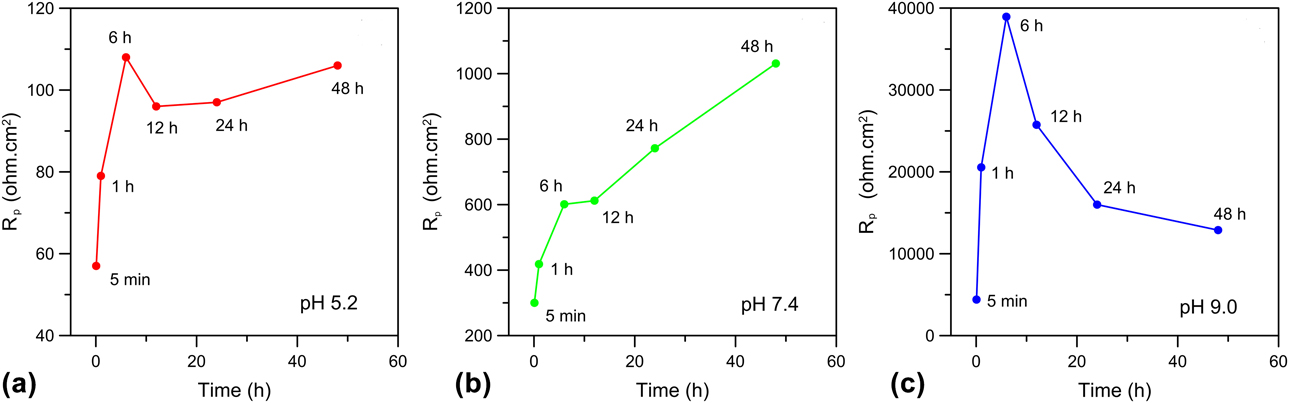
To further clarify the corrosion properties under different pH PBS solutions, the EIS spectra were analyzed by the equivalent circuits shown in Fig. 2. According to these equivalent circuits, variations in the polarization resistance R p of AM60 in different pH value PBS solutions as a function of immersion time were achieved, as shown in Fig. 3. It is obvious that the polarization resistance was increased in the order of pH 5.2 < pH 7.4 < pH 9.0. The detailed analysis of EIS was discussed in Discussion section.
Equivalent circuits of the EIS spectra: (a) pH 5.2 and pH 7.4 at 5 min; (b) pH 7.4 except 5 min and pH 9.0 at 5 min; (c) pH 9.0 except 5 min.

Polarization resistance R p of (a) pH 5.2, (b) pH 7.4, (c) pH 9.0 obtained from EIS data at different time intervals for 48 h.

Figures 4(a)–4(c) show the surface morphologies of specimens immersed in different pH value PBS solutions for 14 h. It can be found that there were no corrosion pits at the surface of AM60 at pH 5.2, while there were many uncorroded dots distributed. On the other hand, only a few uncorroded dots were found for pH 7.4 and the surface was almost unaffected for pH 9.0.
SEM micrographs of specimens immersed in PBS solution for 14 h: (a) pH 5.2, (b) pH 7.4, (c) pH 9.0, and specimens tested at 90 MPa at PBS solution: (d) pH 5.2, (e) pH 7.4, (f) pH 9.0.

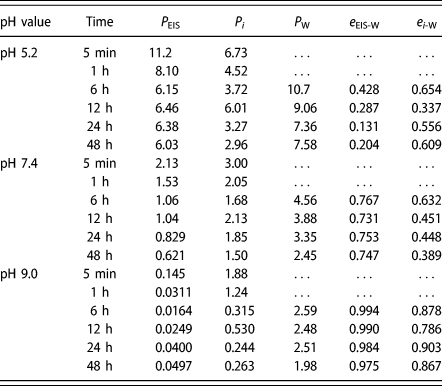
Table I presents the corrosion rate data evaluated at different times, pH values and methods. There was a large relative deviation for the corrosion rates between EIS and Tafel extrapolation with weight loss method. Moreover, the relative deviation was relatively larger when the pH value is 9.0.
Corrosion rate (mm/year) for AM60 magnesium alloy exposed 5 min–48 h in different pH value PBS solutions measured using EIS, P EIS, Tafel extrapolation, P i, and weight loss, P W [the relative deviation of P EIS, e EIS-W, P i, P W, and e i-W were evaluated using Eqs. (5)–(10)].

S–N curve
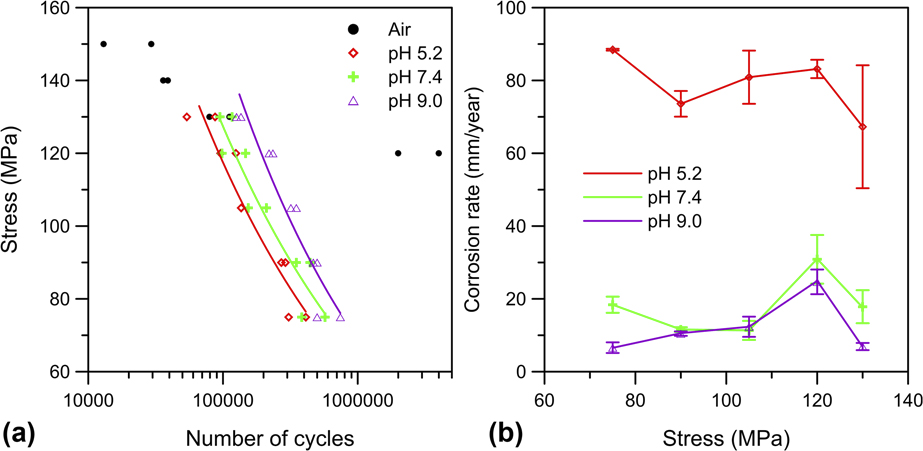
The relationships between stress amplitude and the number of cycles to failure under different pH PBS solutions are shown in Fig. 5(a). The results indicate that with decrease in pH value, the fatigue life decreased a lot. The fatigue limit of AM60 magnesium alloy was 120 MPa at 106 cycles when tested in air, while such a fatigue limit was not observed when tested in PBS solutions. When stress amplitude was greater than fatigue limit in air (120 MPa), the fatigue lives were similar under different conditions, which indicated that the fatigue life was decided by the stress amplitude. When stress amplitude was smaller than fatigue limit in air (120 MPa), the fatigue lives showed distinct differences, which suggested that corrosion environment has a tremendous influence on the fatigue life. The loss of mechanical properties observed in PBS solutions was relevant to hydrogen embrittlement generated by magnesium dissolve, and the detailed analysis was discussed in Discussion section. By fitting the experimental data of Basquin’s equation [Reference Eliezer, Gutman, Abramov and Unigovski27], the relationships between fatigue life and stress amplitude in different pH PBS solutions were as follows:
 $${\rm{PBS}}\;{\rm{solution}}\;{\rm{of}}\;{\rm{pH}}\;5.2{\rm{:}}\;S = 3887.54 \times {N^{ - 0.30}}\quad ;$$
 $${\rm{PBS}}\;{\rm{solution}}\;{\rm{of}}\;{\rm{pH}}\;7.4{\rm{:}}\;S = 3798.55 \times {N^{ - 0.30}}\quad ;$$
 $${\rm{PBS}}\;{\rm{solution}}\;{\rm{of}}\;{\rm{pH}}\;9.0{\rm{:}}\;S = 5762.41 \times {N^{ - 0.32}}\quad ,$$
where S and N are the stress amplitude and the fatigue life, respectively.
(a) Effect of pH value on the S–N relationship in PBS solutions; (b) effect of pH value on the corrosion rate in PBS solutions.

Effect of pH value on corrosion fatigue behaviors
There are four commonly used methods to evaluate the corrosion rate of magnesium alloys, namely (i) electrochemical method, (ii) hydrogen evolution measurement, (iii) Mg ion release measurement, and (iv) weight loss measurement. However, electrochemical methods cannot accurately measure the corrosion rate of magnesium alloys due to the “negative difference effect” [Reference Ng, Chiu and Cheng23]. Hydrogen evolution measurement is difficult to realize during the corrosion fatigue tests and part of hydrogen would dissolve into the Mg matrix [Reference Johnston, Shi and Atrens24, Reference Abidin, Atrens, Martin and Atrens28, Reference Shi, Jia and Atrens29]. Mg ion measurement is not reliable due to the presence of insoluble corrosion products [e.g., Mg3(PO4)2] when the magnesium alloy was immersed in simulated body fluid (e.g., PBS solution). Therefore, weight loss measurement was chosen due to its advantages of simplicity and accuracy.
Figure 5(b) shows the corrosion rate of AM60 magnesium alloy immersed in different pH value PBS solutions under different cyclic stresses. Figures 4(d)–4(f) show the corrosion morphology of samples under cyclic stress as a function of pH value. At pH 5.2, the concentration of hydrogen ions was largely higher than under other conditions and since hydrogen ions are considered as strong oxidizers, they made the magnesium dissolution reaction fast (i.e., Mg → Mg2+ + 2e−) and the hydrogen evolution (i.e., 2H++ 2e− → H2). Although the hydrogen ion concentration was very high, there were no apparent corrosion pits in the surface except many uncorroded pots, which is similar to immersing under no applied stress [Fig. 4(a)]. The possible reason is that the oxide (hydroxide) film cannot form under pH 5.2 environment with the existence of circulating fluid and applied stress that make the pH value and the density of chloride ions around the alloy surface nearly constant. Thus, the pitting corrosion was inhibited. At pH 7.4 and 9.0, due to the accumulation of corrosion products, the corrosion rate decreased with the increase in corrosion time when compared to pH 5.2. The corrosion surface was relatively flat and the corrosion pit was not distinct, which is similar to that with no applied stress condition [Figs. 4(b) and 4(c)]. The reason is that the oxide (hydroxide) film can protect the matrix to a certain extent. However, due to the stress corrosion effect [Reference Bian, Zhou, Liu, Li, Zheng and Sun9, Reference Gu, Zhou and Zheng15], the surface bore more serious corrosion when the cyclic stress was imposed.
It can be seen that the corrosion rate increased with the decrease in pH value under no applied stress static state (see Table I). When the cyclic stress was imposed, the AM60 magnesium alloy showed a notably higher corrosion rate than that in the static state due to the stress corrosion phenomenon [Reference Bian, Zhou, Liu, Li, Zheng and Sun9, Reference Gu, Zhou and Zheng15]. Li et al. [Reference Zheng, Li, Chen and Zou30] found that the Mg–2.65Zn magnesium alloy deformed in tension had high-density dislocations and that compressive deformation was characterized by deformation twins. Both of them increase residual stress level, which leads to the enhancement of stress corrosion. Furthermore, the formation of extrusions and intrusions due to persistent slip bands would break the oxide film, allowing the contact of the underlying metal with the electrolyte [Reference Sajuri, Miyashita and Mutoh31, Reference Diab, Pang and Jahed32]. Thus, the corrosion rate was enhanced.
Discussion
Electrochemical test and immersion test
Effect of pH value on EIS
The equivalent circuits of the EIS spectra were obtained to probe the corrosion properties with different pH PBS solutions, which are shown in Fig. 2. Among them, R s represents the resistance of corrosion solution and R ct represents the charge transfer resistance. Generally, a higher R ct value indicates the higher corrosion resistance ability [Reference Panindre, Raja and Krishnan33]. CPE1 corresponds to the electric double layer capacitance. R ct and CPE1 are used to describe the first capacitance loop in high frequency. C f and R f represent the film capacity and resistance, respectively, which are used to describe the second capacitance loop in medium frequency. The existence of the second capacitance loop can be attributed to the oxide films on the surface of the alloys [Reference Panindre, Raja and Krishnan33]. L and R L represent inductance and resistance, respectively, which is used to describe the low-frequency inductance loops of the alloys. The low-frequency inductance loop is related to the occurrence of Mg+ or pitting corrosion [Reference He, Liu, Wu, Tang and Hu34]. Figure 3 shows the polarization resistance R p (R ct + R f + R L) of AM60 in different pH value PBS solutions. It can be seen that the evolution of R p at different pH values presented the different trends. At pH 5.2, AM60 showed a steady increase in R p before 6 h and then nearly stable afterwards, possibly because the insoluble protective corrosion product layer was formed before 6 h and then there was a dynamic balance between dissolution and formation rate. At pH 7.4, R p showed a steady increase stage, which indicated that the corrosion product was accumulated continuously. At pH 9.0, R p increased rapidly at the initial 6 h and then decreased rapidly. This may be related to not only the formation of corrosion product film but its dissolution due to the existence of chloride ions. Therefore, the corrosion mechanisms of AM60 under different pH values were different. Moreover, pH values had a tremendous influence on R p. After 48 h of immersion, R p of pH 9.0 was approximately 12.9 kΩ cm2, which was an order of magnitude higher than tested in pH 7.4 and two orders of magnitude higher than tested in pH 5.2.
Corrosion rate analysis
As shown in Table I, the corrosion rates achieved by weight loss method were much higher than those achieved by electrochemical methods, namely Tafel extrapolation method and EIS method. The difference can be explained as follows: on the one hand, electrochemical method and weight loss method measured different types of corrosion. The electrochemical method measured the onset corrosion rate of magnesium alloy, while the weight loss method measured an average corrosion rate of a long time period. On the other hand, the negative difference effect (NDE) is also an important reason that causes this great difference [Reference Shi, Liu and Atrens3]. According to an implication of the NDE, the magnesium corrosion behavior can be described as follows [Reference Shi, Liu and Atrens3, Reference Atrens and Dietzel35]:
 $${\rm{Mg}} = {\rm{M}}{{\rm{g}}^ + } + {\rm{e}}\;\left( {{\rm{anodic}}\;{\rm{partial}}\;{\rm{reaction}}} \right)\quad ,$$
 $$k{\rm{M}}{{\rm{g}}^ + } = k\;{\rm{M}}{{\rm{g}}^{ + + }} + k\;{\rm{e}}\;\left( {{\rm{anodic}}\;{\rm{partial}}\;{\rm{reaction}}} \right)\quad ,$$
 $$\eqalign{\left( {1 - k} \right){\rm{M}}{{\rm{g}}^ + } + \left( {1 - k} \right){{\rm{H}}^ + } = \left( {1 - k} \right){\rm{M}}{{\rm{g}}^{ + + }} + \left( {1 - k} \right)\left( {{1 / 2}} \right){{\rm{H}}^ + }\;\left( {{\rm{chemical}}\;{\rm{reaction}}} \right)\quad ,$$
 $$\eqalign{\left( {1 + k} \right){{\rm{H}}^ + } + \left( {1 + k} \right){\rm{e}} = \left( {1 + k} \right)\left( {{1 / 2}} \right){{\rm{H}}_2}\;\cr\left( {{\rm{cathodic}}\;{\rm{partial}}\;{\rm{reaction}}} \right)\quad .$$
From the above Eqs. (1)–(4), it can be seen that in addition to electrochemical reaction, chemical reaction also exists. This means that the electrochemical method can only measure a part of the actual corrosion rate.
Effect of pH value on corrosion fatigue behaviors
Fatigue crack initiation analysis
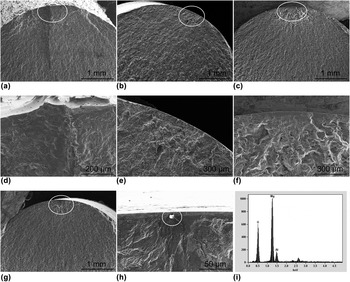
To reveal and compare the fatigue crack initiation mechanisms of specimens tested under different pH value PBS solutions, the representative fatigue fracture surfaces were selected for analysis, as shown in Fig. 6. EDS analysis of the initial sites of the as-extruded specimens under air condition showed that fatigue cracks nucleated from the MgO particle, as shown in Figs. 6(h) and 6(i). However, when specimens were tested under corrosion environment, the fatigue crack initiation mechanism changed. As shown in Fig. 6(a), two steps exist near the specimen surface when tested in pH 5.2 PBS solutions, which indicates that fatigue cracks would nucleate from different locations and then coalesce to one crack. As shown in Figs. 6(b) and 6(c), on the other hand, for most of the specimens tested in pH 7.4 and 9.0 PBS solutions, only one crack initiation site was observed on the entire fracture surface, but no corrosion pit was observed at the fatigue crack initiation site. As a matter of fact, this phenomenon has been reported in other studies [Reference Khan, Miyashita, Mutoh and Koike36, Reference Khan, Bhuiyan, Miyashita, Mutoh and Koike37, Reference Maruyama, Mori, Hiromoto, Kanazawa and Nakamura38], which indicates that the crack initiation is not related to the pitting corrosion.
Typical fatigue fracture morphologies of specimens tested under different conditions: (a) pH 5.2 at 90 MPa; (b) pH 7.4 at 90 MPa; (c) pH 9.0 at 90 MPa; (d) pH 5.2 at 90 MPa of initiation region [in white circle of (a)]; (e) pH 7.4 at 90 MPa of initiation region [in white circle of (b)]; (f) pH 9.0 at 90 MPa of initiation region [in white circle of (c)]; (g) air at 130 MPa; (h) air at 130 MPa of initiation region [in white circle of (g)]; and (i) EDS of initiate site [in white circle of (h)] tested in air of 130 MPa.

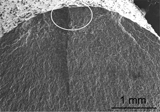
Figure 7 shows the side surface of the specimens tested in different pH value PBS solutions. It can be seen that there exist many secondary cracks in the side surface of specimens tested in different PBS solutions, which is a typical characteristic of hydrogen embrittlement [Reference Panindre, Raja and Krishnan33, Reference Kappes, Iannuzzi and Carranza39, Reference Kannan and Dietzel40]. It is possible that the oxide film was damaged by the applied stresses during tests, leading to many cracks. On the other hand, the dissolves of magnesium can promote the hydrogen evolution and entry into the material matrix, which can cause the embrittlement of magnesium matrix. Moreover, the applied stress can also contribute to the transfer of hydrogen from environment to matrix [Reference Song, Blawert and Dietzel41, Reference Kappes, Iannuzzi and Carranza42], which can lead to the increase in the embrittlement of magnesium matrix and reduction in the fatigue life of magnesium alloys. Uematsu et al. [Reference Uematsu, Kakiuchi, Nakajima, Nakamura, Miyazaki and Makino43] and Kakiuchi et al. [Reference Kakiuchi, Uematsu, Hatano, Nakajima, Nakamura and Taniguchi44] found that the fatigue crack propagation rate of AM60 magnesium alloy increases with the charge of hydrogen increasing. They concluded that hydrogen embrittlement is the primary and anodic dissolution is the secondary factor that influence the acceleration of crack propagation Therefore, the fatigue life of specimens tested in different pH value PBS solutions reduced in the order of pH 9.0 > pH 7.4 > pH 5.2. It should be pointed out that the number of secondary cracks of specimens tested in pH 5.2 PBS solutions is much lower than tested in pH 7.4 and 9.0. This is because the secondary crack of pH 5.2 can reach the critical size faster due to the hydrogen embrittlement, which is more severe than the other conditions, so the stress around the crack is relaxed and additional crack growth would be impeded.
SEM micrographs of specimens tested at 90 MPa at PBS solution: (a) pH 5.2; (b) pH 7.4; (c) pH 9.0.

Effect of HE on the corrosion fatigue behavior
It is well known that magnesium and its alloys are easy to degrade in simulated body fluid (e.g., PBS solution) by anodic reaction accompanied by hydrogen evolution from cathodic reaction [Reference Kannan and Dietzel40, Reference Jamesh, Wu and Zhao45]. Therefore, magnesium and its alloys will suffer hydrogen embrittlement during stress corrosion cracking and corrosion fatigue tests. Generally, the presence of corrosion product film on the side surface of specimens can inhibit the hydrogen from diffusing into the magnesium matrix to some extent. However, the protective film may be broken due to the existence of cyclic stress. For pH 5.2, the role of massive hydrogen ions is interesting: they not only caused the hydrogen diffusion more serious, but also damaged the protective film, which led to the smoother hydrogen ion diffusion [Reference Yang, Scenini and Curioni46, Reference Zhang, Chen, Shao, Meng, Wang, Li and Dong47]. For pH 9.0, magnesium hydroxide is stable according to the Pourbaix diagram [Reference Pourbaix48], and it somewhat hinders the hydrogen diffusion and matrix dissolution. Thus, the samples with pH 5.2 have the shortest fatigue life, while those with pH 9.0 have the longest fatigue life [Fig. 5(a)].
The corrosion product film and hydrogen embrittlement effect work together to influence the crack initiation for AM60 magnesium alloy tested in PBS solutions. The corrosion product film was broken by tensile stress during cyclic loading, leading to the occurrence of some fresh surface. The hydrogen immerses into the crack of corrosion product film and contacts with the fresh surface. Then the hydrogen diffuses into magnesium matrix through grain boundaries and low-surface-energy planes, including {0001},  $\left\{ {10\bar{1}0} \right\}$,
 $\left\{ {10\bar{1}1} \right\}$,
 $\left\{ {31\bar{4}0} \right\}$, and
 $\left\{ {2\bar{2}03} \right\}$ [Reference Wang, Xu and Wang49, Reference Zhou, Liu and Wu50], causing the embrittlement of the fresh surface. Since hydrogen can effectively decrease the bonding strength of crystallographic planes [Reference Atrens and Dietzel35], many small secondary cracks are formed, as shown in Fig. 7. Moreover, the hydrogen would further accumulate in the crack tip by stress-assisted diffusion [Reference Kannan and Dietzel40, Reference Winzer, Atrens and Song51], which also leads to the increase in fatigue propagation crack rate. Thus, the hydrogen embrittlement plays a major role in the fatigue life of AM60 magnesium alloy.
Conclusions
The electrochemical and corrosion fatigue behavior of AM60 magnesium alloy was studied in different pH value PBS solutions. According to the experiment results, some important conclusions can be drawn as follows:
(1) Electrochemical test showed that the corrosion mechanism of AM60 under different pH values was different, and corrosion rate comparison indicated that the corrosion rate was reduced in the order of pH 5.2 > pH 7.4 > pH 9.0.
(2) pH value had a significant influence on the corrosion fatigue life of AM60 magnesium alloy, and the fatigue life was reduced in the order of pH 9.0 > pH 7.4 > pH 5.2.
(3) Mechanical condition was the predominant factor affecting the fatigue life at stress greater than 120 MPa, while the corrosion environment was the main factor when the stress was below 120 MPa.
(4) Photography revealed secondary cracks at the corrosion fatigue crack initiation sites. Hydrogen embrittlement plays a major role in the crack initiation mechanism for AM60 magnesium alloy tested in different pH value PBS solutions.
Material and experiments
Materials and specimens
The commercial hot-rolled AM60 magnesium alloy rod was provided by Jiaozuo Yi-Rui Alloy Materials Co., Ltd., (Jiaozuo, China). The chemical compositions of the material are shown in Table II. The gauge length and diameter of specimens were 15 mm and 6 mm, respectively. For immersion test and electrochemical tests, rectangular specimens of dimensions 16 × 16 × 5 mm were sectioned from the extruded rod. Before the test, the specimens were polished with SiC papers up to 5000 grit, then cleaned ultrasonically in ethanol for 10 min, and dried in open air. The medium used in the corrosion and corrosion fatigue tests was PBS (containing 0.24 g/L KH2PO4, 1.44 g/L Na2HPO4, 0.2 g/L KCl, 8 g/L NaCl, pH 7.2–7.6). The pH value of PBS was kept at 5.2 and 7.4 using citric acid-Na2HPO4 buffer solution because citric acid exists in body fluid, and the pH value of PBS was kept at 9.0 using sodium hydroxide.
Chemical compositions of AM60 magnesium alloy (wt%).

Electrochemical test and immersion test
The corrosion behavior of magnesium alloy in PBS of different pH values was tested by electrochemical impedance spectroscopy (EIS), potentiodynamic polarization scan, and weight loss method. The EIS experiments were carried out by applying a sinusoidal wave at the open circuit potential (OCP) with an amplitude of 10 mV, after prior immersion in PBS for 5 min, 1, 6, 12, 24, and 48 h. The impedance spectra were required in the frequency range from 100 KHz to 100 MHz. Polarization scans were carried out starting at 300 mV negative to OCP, at a scan rate of 0.5 mV/s. For immersion test, specimens were encapsulated in resin and only one surface, whose dimension is 16 × 16 mm, was exposed to the solution. During the test, the PBS solution was replaced by a new one every 24 h to maintain the pH value.
The corrosion rate (mm/year) obtained by weight loss method was calculated by the following equation:
 $${P_{\rm{w}}} = 3.65{{\Delta W} / {\rho \quad ,}}$$
where ΔW is the weight loss rate (mg/cm2/d), ρ is the density of AM60 magnesium alloy, and ρ is 1.74 g/cm3.
In the Tafel extrapolation method, the corrosion current i corr (mA/cm2) was estimated by Tafel extrapolation of the cathodic branch of the polarization curve, and i corr is related to the corrosion rate as follows:
 $${P_i} = 22.85{i_{{\rm{corr}}}}\quad .$$
In the EIS method for measuring the magnesium corrosion rate, the corrosion current i k is estimated using Stern–Geary equation:
 $${i_{\rm{k}}} = {B / {{R_{\rm{p}}}\quad ,}}$$
where R p is polarization resistance (Ω cm2), B is Stern–Geary coefficient, which can be obtained by fitting the polarization curves, and B is 28 in here. Then the corrosion rate can be calculated as follows:
 $${P_{{\rm{EIS}}}} = 22.85{i_{\rm{k}}}\quad .$$
The relative deviation was used to evaluate the corrosion rates obtained from EIS, P EIS, Tafel extrapolation (using the cathodic branch), P i, and weight loss, P W. The relative deviation for the corrosion rate determined from EIS and Tafel extrapolation was evaluated as follows:
 $${e_{{\rm{EIS ‐ W}}}} = {{\left| {\left( {{P_{{\rm{EIS}}}} - {P_{\rm{W}}}} \right)} \right|} / {{P_{\rm{W}}}}}\quad ,$$
 $${e_{i{\rm{ ‐ W}}}} = {{\left| {{P_i} - {P_{\rm{W}}}} \right|} / {{P_{\rm{W}}}}}\quad .$$
Corrosion fatigue test
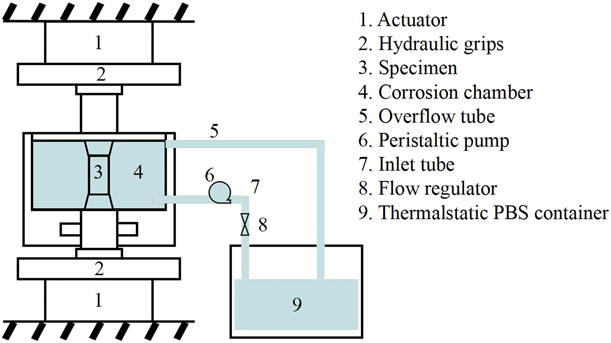
The corrosion fatigue tests were performed under a fully reversed triangle waveform loading condition on a MTS 793 fatigue testing machine, as shown in Fig. 8. The temperature of PBS was kept at 37 ± 1 °C by a thermostat water bath. The PBS was circulated through the chamber by a pump with a flow rate of 120 mL/min and was replaced for each new test. During fatigue test, the total stress amplitudes were 75, 90, 105, 120, and 130 MPa, and the frequency was 10 Hz. At each stress level, at least two samples were tested.
The sketch of the testing apparatus.

After corrosion fatigue test, the corrosion products were cleaned by chromic acid solution (200 g/L CrO3 + 10 g/L AgNO3) for 5 min, ultrasonically cleaned in distilled water, and then dried in open air. Fatigue fractographies were investigated with a Hitachi S-4800 scanning electron microscope (SEM, Hitachi Ltd., Tokyo, Japan). The dried specimens were weighed by precision electronics, and the corrosion rate was calculated using Eq. (5).
Acknowledgments
The project was supported by the National Natural Science Foundation of China (Grant Nos. 51571150 and 11572222) and Tianjin Natural Science Foundation (Grant No. 14JCYBJC16900).