Binge-eating disorder (BED), the most prevalent eating disorder among adults in the United States (prevalence rate: ~1.0%; Udo and Grilo, Reference Udo and Grilo2018), is characterized by recurrent episodes of binge eating (consuming an objectively large amount of food while experiencing a subjective sense of loss of control), with marked distress and without regular, extreme weight-compensatory behaviors (APA, 2013). BED is distributed across sex, ethnic/racial, and age groups and is associated strongly with obesity and with heightened risk for psychiatric/medical comorbidity (Udo & Grilo, Reference Udo and Grilo2018, Reference Udo and Grilo2019). Although psychological and pharmacological treatments for BED are effective at reducing binge eating (Grilo, Reference Grilo2017; Hilbert et al., Reference Hilbert, Petroff, Herpertz, Pietrowsky, Tuschen-Caffier, Vocks and Schmidt2019), approximately 50% of patients do not achieve abstinence (Linardon, Reference Linardon2018). Accordingly, research on predictors, moderators, and processes of treatment change is essential both to improve treatments and to refine conceptual models of the psychopathology of BED (Kraemer, Wilson, Fairburn, & Agras, Reference Kraemer, Wilson, Fairburn and Agras2002).
A candidate process that may influence treatment outcomes for BED is impulsivity. Impulsivity is a multi-dimensional construct reflecting poor reward-related decision-making and a propensity to engage in rash or reward-seeking behavior (Dawe & Loxton, Reference Dawe and Loxton2004). Impulse-control difficulties have transdiagnostic neurobiological correlates (Bari & Robbins, Reference Bari and Robbins2013) and are related to severity of psychopathology (Berg, Latzman, Bliswise, & Lilenfeld, Reference Berg, Latzman, Bliswise and Lilenfeld2015), including eating psychopathology (Waxman, Reference Waxman2009). Individuals with BED have heightened impulsivity in the context of food (Giel, Teufel, Junne, Zipfel, & Schag, Reference Giel, Teufel, Junne, Zipfel and Schag2017) and in general (Boswell & Grilo, Reference Boswell and Grilo2020; Boswell, Potenza, & Grilo, Reference Boswell, Potenza and Grilo2021; Kober & Boswell, Reference Kober and Boswell2018). To determine whether impulsivity might be a target for BED treatment, it will be important to establish whether impulsivity is impacted by treatments for BED and whether changes in impulsivity are associated with treatment outcomes.
To date, very little research has examined the relationship between impulsivity and BED treatment outcomes. Greater impulsivity is associated with poorer treatment outcomes for substance use disorders (Hershberger, Um, & Cyders, Reference Hershberger, Um and Cyders2017), gambling (Mallorqui-Bague et al., Reference Mallorqui-Bague, Mestre-Bach, Lozano-Madrid, Fernandez-Aranda, Granero, Vintro-Alcazaz and Jimenez-Murcia2018), and bariatric surgery (Yeo et al., Reference Yeo, Toh, Yeo, Low, Yeo, Aung and Kaushal2020); findings to date for BED are mixed. In two small pilot studies, baseline self-reported behavioral and brain-based measures of impulsivity were associated with poorer response to BED treatment (Balodis et al., Reference Balodis, Grilo, Kober, Worhunsky, White, Stevens and Potenza2014; Manasse et al., Reference Manasse, Espel, Schumacher, Kerrigan, Zhang, Forman and Juarascio2016). Two other studies, however, reported null associations between baseline impulsivity and treatment outcomes (Anderson et al., Reference Anderson, Smith, Schaefer, Crosby, Cao, Engel and Peterson2020; Castellini et al., Reference Castellini, Mannucci, Lo Sauro, Benni, Lazzeretti, Ravaldi and Ricca2012). Overall, the limited research to date has identified very few reliable patient predictors of outcome and even fewer findings about moderators (Linardon, de la Piedad Garcia, & Brennan, Reference Linardon, de la Piedad Garcia and Brennan2017). Identifying patient characteristics at baseline that predict or moderate treatment responses (e.g. for whom specific treatments work better) could inform rational decision-making about prescribing treatments (Grilo, Reference Grilo2017; Wilson, Grilo, & Vitousek, Reference Wilson, Grilo and Vitousek2007).
Although historically conceptualized as a trait measure and thought to be relatively stable over time, impulsivity changes in both prospective naturalistic studies (McGlashan et al., Reference McGlashan, Grilo, Sanislow, Ralevski, Morey, Gunderson and Pagano2005) and during treatment, including for substance use disorders and obesity (Littlefield et al., Reference Littlefield, Stevens, Cunningham, Jones, King, Schumacher and Coffey2015; Ross et al., Reference Ross, Eastman, Ugwoaba, Demos, Lillis and Wing2020). Because greater impulsivity may interfere with treatment outcomes, reductions in impulsivity during treatment could signal better prognosis. To date, in the sole study with BED that has examined change in impulsivity during pharmacological treatment, lisdexamfetamine dimesylate, a pro-drug-stimulant medication that improves executive functioning, was associated with reduced self-reported impulsivity (McElroy et al., Reference McElroy, Mitchell, Wilfley, Gasior, Ferreira-Cornwell, McKay and Hudson2016). In contrast, a pilot study of an impulsivity-focused cognitive-behavioral therapy (CBT) for BED did not produce significant changes in impulsivity (Schag et al., Reference Schag, Rennhak, Leehr, Skoda, Becker, Bethge and Giel2019). Despite interest in the role of impulsivity in maintaining eating disorders (Waxman, Reference Waxman2009), no prior research has examined whether changes in impulsivity during treatment predict outcomes for BED (or any eating disorders).
Timing of reductions in impulsivity during treatment might also influence outcomes. Rapid response to treatment is the strongest and most well-established mediator of treatment outcomes across eating disorders (Linardon, Brennan, & de la Piedad Garcia, Reference Linardon, Brennan and de la Piedad Garcia2016). In BED, rapid reduction in binge eating (i.e. during the first month of treatment) is reliably associated with better outcomes across psychological and pharmacological treatments (Grilo & Masheb, Reference Grilo and Masheb2007; Grilo, Masheb, & Wilson, Reference Grilo, Masheb and Wilson2006; Grilo, White, Masheb, & Gueorguieva, Reference Grilo, White, Masheb and Gueorguieva2015; Grilo, White, Wilson, Gueorguieva, & Masheb, Reference Grilo, White, Wilson, Gueorguieva and Masheb2012; Masheb & Grilo, Reference Masheb and Grilo2007). Prior BED research focused exclusively on rapid reductions in binge eating rather than early/rapid changes in other potentially clinically relevant variables such as impulsivity. Recent research with bulimia nervosa found that rapid improvements in emotion regulation predicted outcomes (MacDonald & Trottier, Reference MacDonald and Trottier2019; MacDonald, Trottier, & Olmsted, Reference MacDonald, Trottier and Olmsted2017; Peterson et al., Reference Peterson, Berg, Crosby, Lavender, Accurso, Ciao and Wonderlich2017).
Examining change in impulsivity as a prospective indicator of treatment outcomes could highlight a transdiagnostic process underlying BED psychopathology and its treatment. This study examined changes in impulsivity during and after treatment with CBT and fluoxetine, alone and together, for BED. Examining changes in impulsivity in these treatments seems indicated for the following reasons. CBT, which has well-established effectiveness for BED (Grilo, Reference Grilo2017), includes structured treatment components (e.g. self-monitoring, regular eating, and cognitive reappraisal) that target/reduce binge eating. These CBT–BED-based skills, which require practice in planning, problem-solving, and cognitive flexibility, may indirectly generalize to broader behavioral and cognitive aspects of impulsivity. Fluoxetine modulates serotonergic systems implicated in impulsive responding, which is hypothesized to be broadly related to general psychopathology (Carver, Johnson, & Joormann, Reference Carver, Johnson and Joormann2008; Coccaro & Kavoussi, Reference Coccaro and Kavoussi1997; Walderhaug et al., Reference Walderhaug, Lunde, Nordvik, Landrø, Refsum and Magnusson2002). However, although fluoxetine has demonstrated effectiveness for depression and bulimia nervosa (Hagan & Walsh, Reference Hagan and Walsh2021), its effects on impulsivity are less certain (Boswell et al., Reference Boswell, Potenza and Grilo2021).
Thus, the specific aims were: (1) to determine whether impulsivity changes during treatment for BED and during follow-up; and (2) to determine whether changes in impulsivity are related to treatment outcomes for BED, including: (a) does rapid change in impulsivity prospectively influence treatment outcomes?; and (b) does overall change in impulsivity during treatment influence outcomes? In order to examine the specificity of the effects of changes in impulsivity and include secondary outcomes from existing BED randomized controlled trials (RCTs), we characterized CBT and fluoxetine treatment outcomes broadly by including eating-disorder symptoms and features (i.e. binge-eating episodes and global eating-disorder psychopathology), depression scores, and body mass index (BMI) as outcome variables. In doing so, we addressed an additional specific aim: (3) to examine whether the association of change in impulsivity during treatment for BED is specific to eating psychopathology or also related to associated clinical outcomes. Finally, we examined an exploratory aim: (4) is baseline impulsivity a predictor or moderator of treatment outcomes (Kraemer et al., Reference Kraemer, Wilson, Fairburn and Agras2002)?
Methods
Participants
Participants were 108 adult patients who met DSM-IV-defined BED (APA, 1994), were ⩾100% ideal weight, and were consecutively enrolled in a randomized double-blind, placebo-controlled study examining fluoxetine and CBT, alone and in combination. Detailed study descriptions and outcomes at post-treatment (Grilo, Masheb, & Wilson, Reference Grilo, Masheb and Wilson2005) and 12-month follow-up (Grilo, Crosby, Wilson, & Masheb, Reference Grilo, Crosby, Wilson and Masheb2012) have been reported and are therefore summarized briefly below. Study was approved by the Yale Institutional Review Board and all participants provided written informed consent.
Exclusion criteria included any concurrent treatment for eating, weight, or psychiatric problems, current medical conditions that influence eating/weight, current severe psychiatric conditions precluding accurate assessment or requiring alternative treatment, or current pregnancy/breastfeeding. Participants’ mean BMI was 36.3 (s.d. = 7.9) and mean age was 44.0 (range: 21–59, s.d. = 8.6). The participant group was 89% White, 78% female, and 87% attended/finished college.
Randomization and treatment
Participants were randomized to one of four treatment conditions in a balanced 2 × 2 factorial design for 16 weeks: (a) fluoxetine (60 mg/day), (b) placebo, (c) CBT + fluoxetine (60 mg/day), and (d) CBT + placebo. Randomization followed the consecutive order in which participants completed assessments and were deemed eligible to enroll. Computer-generated randomization schedule was created without stratification in blocks of eight to yield approximately equal allocations across conditions; the schedule was implemented by a research pharmacist separate from the blinded investigators/clinicians. The study medications were given in identical appearing capsules and delivered with minimal clinical management by faculty-level psychiatrists focused on medication regimen and adherence/safety without additional psychotherapeutic interventions. CBT was delivered following manualized protocols in weekly individual sessions by doctoral research-clinicians monitored for adherence. First stage of CBT (seven sessions) focused on psychoeducation about binge eating and specific behavioral strategies (e.g. self-monitoring, problem-solving, and regular-eating patterning) to help reduce binge-eating while normalizing eating. Middle stage (six sessions) included cognitive restructuring (of eating and weight/shape thoughts that maintain binge eating) while continuing to normalize eating patterns. Final stage (three sessions) focused on maintenance and relapse prevention. Independent (blinded) assessments were performed at baseline, monthly throughout treatment, post-treatment, and 12-month follow-up after completing and discontinuing treatments. Patients in placebo-only condition were not followed after posttreatment because they were offered treatment at that time (Grilo, Crosby, et al., Reference Grilo, Crosby, Wilson and Masheb2012).
Measures
Diagnostic assessment
BED was determined via Structured Clinical Interview for DSM-IV-Axis I Disorders (SCID-I/P; First, Gibbon, Spitzer, Williams, & Benjamin, Reference First, Gibbon, Spitzer, Williams and Benjamin1996) and confirmed with Eating Disorder Examination interview (EDE; Fairburn & Cooper, Reference Fairburn, Cooper and Fairburn1993). These diagnostic interviews were administered by doctoral-level research clinicians; interrater reliability was excellent (EDE: Spearman rho = 0.87–0.99; SCID: kappa for BED = 1.0).
Baseline and repeated measures
Measures were administered at baseline, monthly during treatment, end of treatment (post-treatment), and 12-month follow-up after completing treatments.
Impulsivity Control Scale (ICS; Grosz et al., Reference Grosz, Lipschitz, Sofia, Finkelstein, Blackwood, Gerbino-Rosen and Plutchik1994; Plutchik & van Praag, Reference Plutchik and van Praag1989). ICS is a 15-item self-report measure of impulsivity that conceptually is related to UPPS-P dimensions of positive/negative urgency and sensation-seeking (Verdejo-Garcia, Lozano, Moya, Alcazar, & Perez-Garcia, Reference Verdejo-Garcia, Lozano, Moya, Alcazar and Perez-Garcia2010). ICS has well-established psychometric properties (Grosz et al., Reference Grosz, Lipschitz, Sofia, Finkelstein, Blackwood, Gerbino-Rosen and Plutchik1994); in patients with BED, ICS shows concurrent validity with diagnostic interview-based assessment of impulsivity (Boswell & Grilo, Reference Boswell and Grilo2020). In this study, ICS had good internal consistency [alpha coefficient (α) = 0.75].
Eating Disorder Examination-Questionnaire (EDE-Q; Fairburn & Beglin, Reference Fairburn and Beglin1993). EDE-Q, the self-report version of the EDE interview, assesses the behavioral/cognitive features of eating-disorder psychopathology. EDE-Q evaluates the frequency of binge-eating episodes and generates a global total score reflecting overall eating-disorder psychopathology severity. EDE-Q converges well with the EDE interview (Grilo, Masheb, & Wilson, Reference Grilo, Masheb and Wilson2001a, Reference Grilo, Masheb and Wilson2001b) and has excellent reliability in BED samples (Berg, Peterson, Frazier, & Crow, Reference Berg, Peterson, Frazier and Crow2012; Reas, Grilo, & Masheb, Reference Reas, Grilo and Masheb2006). In this study, EDE-Q global scale had good internal consistency (α = 0.80).
Beck Depression Inventory (BDI; Beck, Steer, & Garbin, Reference Beck, Steer and Garbin1998). BDI is a 21-item measure of depression symptoms that is psychometrically well-established (Beck et al., Reference Beck, Steer and Garbin1998). In this study, the BDI had excellent internal consistency (α = 0.90).
Body mass index. BMI (kg/m2) was calculated from in-person measured height (at baseline) and weight at baseline and every session throughout the study 12-month follow-up.
Statistical analyses
Mixed effects models were fit (SAS 9.4) to evaluate changes in impulsivity and associations of those changes in impulsivity with outcomes during treatment and follow-up. Analyses included all participants randomized to treatments with all repeated measures for each individual included in mixed-effects models.
Predictor and outcome variables
Descriptive statistics and distributions were evaluated prior to analyses; no transformations were applied. Predictor (i.e. impulsivity) and outcome variables (i.e. binge-eating episodes, global eating-disorder psychopathology, depression scores, and BMI) were measured continuously. Rapid change in impulsivity was measured via the ICS change score following 1 month of treatment (baseline–month 1). In the case of missing month 1 ICS data, month 2 data were used (N = 1). Overall change in impulsivity was measured via the ICS change score during treatment (baseline–post). ICS predictor variables were mean-centered. If post data were missing, post value was imputed with last observation carried forward (20% imputed). No imputation was conducted for outcome variables because there was minimal missing outcome data and because mixed models provide unbiased and efficient estimates when data are missing at random. All available data from all available timepoints were included in analyses.
Change in impulsivity during treatment and follow-up
Change in impulsivity over time was investigated using two mixed models with measurements during treatment in one model (model 1A) and measurements during follow-up in another (model 1B). Fixed effects were time, treatment group, and the interaction. Because individuals in the placebo-only group did not complete follow-up assessments, there were four groups during treatment (fluoxetine, placebo, CBT + fluoxetine, and CBT + placebo) and three groups during follow-up (fluoxetine, CBT + fluoxetine, and CBT + placebo). The timepoints were baseline, monthly during treatment, and post-treatment (i.e. at 4 months). In the follow-up analyses, timepoints were baseline, post-treatment, and 12-month follow-up. For each model, the best-fitting variance–covariance structure was selected based on Akaike's information criterion (AIC). Least square means were compared in post-hoc tests to explain significant effects in the models.
Rapid change in impulsivity and outcomes
The effects of rapid change in impulsivity on outcomes during treatment and follow-up were tested via two sets of mixed models (referred to as models 2A and 2B, respectively). Model 2A included during treatment timepoints/groups. Model 2B included follow-up timepoints (post and 12-month follow-up) and groups. Outcome variables were included as change scores from baseline by timepoint (baseline–subsequent timepoint). Fixed effects were ICS change score, time, treatment group, and all interactions. The same model-selection process as described above was used.
Change in impulsivity during treatment and outcomes
The influence of change in impulsivity during treatment on outcomes was investigated using two separate types of models (model 3A during treatment and model 3B during follow-up). For model 3A, change in impulsivity was computed via the overall ICS change score (baseline–post) rather than through repeated measures (i.e. effect of time) because of overlapping time-course for predictor and outcome variables. We used a linear model with the ICS change score, treatment group, and their interaction as predictors and change in the outcome from baseline to post as response. Model 3B was mixed models that investigated change in outcomes from baseline during follow-up (post and 12-month follow-up). Model 3B included fixed effects of ICS change score, time, treatment group, and all interactions. Model selection was based on the AIC.
Exploratory analyses: baseline impulsivity
The association of baseline impulsivity on treatment outcome was examined using two sets of mixed models (model 4A during treatment; model 4B during follow-up). Outcome variables were change scores from baseline by timepoint. Fixed effects were baseline impulsivity, time, treatment group, and interactions. The interaction between baseline impulsivity and treatment group was used to test potential moderation effects. Model selection was based on the AIC.
Results
Treatment completion and primary outcomes
Overall, 80% of randomized patients completed treatment (Grilo et al., Reference Grilo, Masheb and Wilson2005). Of patients who completed treatment (excluding placebo-only condition), 71.6% completed 12-month follow-up (Grilo, Crosby, et al., Reference Grilo, Crosby, Wilson and Masheb2012). After treatment, intent-to-treat binge-eating remission rates were: 22% (fluoxetine), 26% (placebo), 50% (CBT + fluoxetine), and 61% (CBT + placebo; Grilo et al., Reference Grilo, Masheb and Wilson2005). At 12-month follow-up, remission rates were 3.7% for fluoxetine-only, 26.9% for CBT + fluoxetine, and 35.7% for CBT + placebo (Grilo, Crosby, et al., Reference Grilo, Crosby, Wilson and Masheb2012).
Change in impulsivity during treatment and follow-up
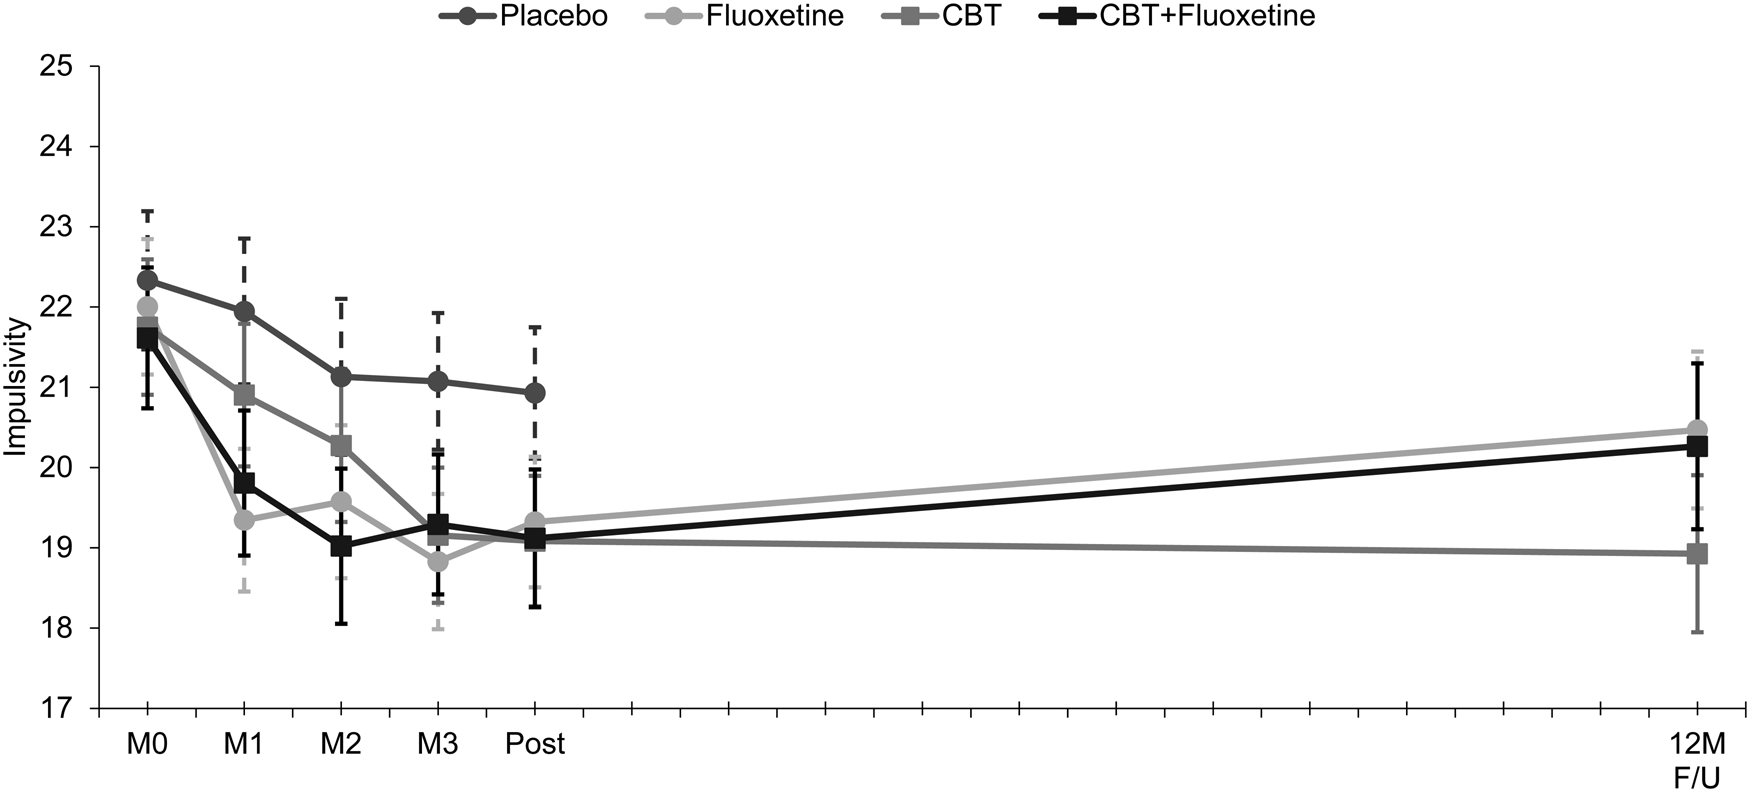
Figure 1 shows changes in impulsivity over time across the different treatment conditions. Mixed effects models revealed overall significant decreases from baseline to post-treatment across conditions (Model 1A: Time: F (4,86.9) = 9.45, p < 0.001), but no significant differences between the specific treatments (Group: Group × Time: ps > 0.34). Analyses revealed a significant main effect of time during follow-up (Model 1B: Time: F (2,59.2) = 13.10, p < 0.001), but no effects of treatment group or interactions (Group: Group × Time: ps > 0.65). Across groups, post-hoc analyses revealed significant decreases in impulsivity during treatment and significant increases during follow-up. After Tukey–Kramer adjustment, differences between baseline impulsivity and all subsequent timepoints remained significant (online Supplementary Table S1).
Change in impulsivity during treatment and follow-up.
Note. Impulsivity changes from baseline throughout treatment and 12-month follow-up after treatment (effects of time; Models 1A and 1B). Least squares means and standard errors are represented graphically. CBT, cognitive-behavioral therapy; M0, baseline, M1, month 1; M2, month 2; M3, month 3; Post, month 4; 12M F/U, 12 month follow-up.

Rapid change in impulsivity and outcomes
Binge eating frequency
Mixed effects models revealed a significant three-way interaction between impulsivity, group, and time (Model 2A: ICS × Group × Time: F (9,208) = 1.92, p = 0.05) and a significant interaction between ICS and time (Model 2A: ICS × Time: F (3,208) = 3.07, p = 0.03). However, none of the slopes describing the relationship between impulsivity and binge eating by treatment group and timepoint or by timepoint were statistically significant (ps > 0.06).
Eating-disorder psychopathology
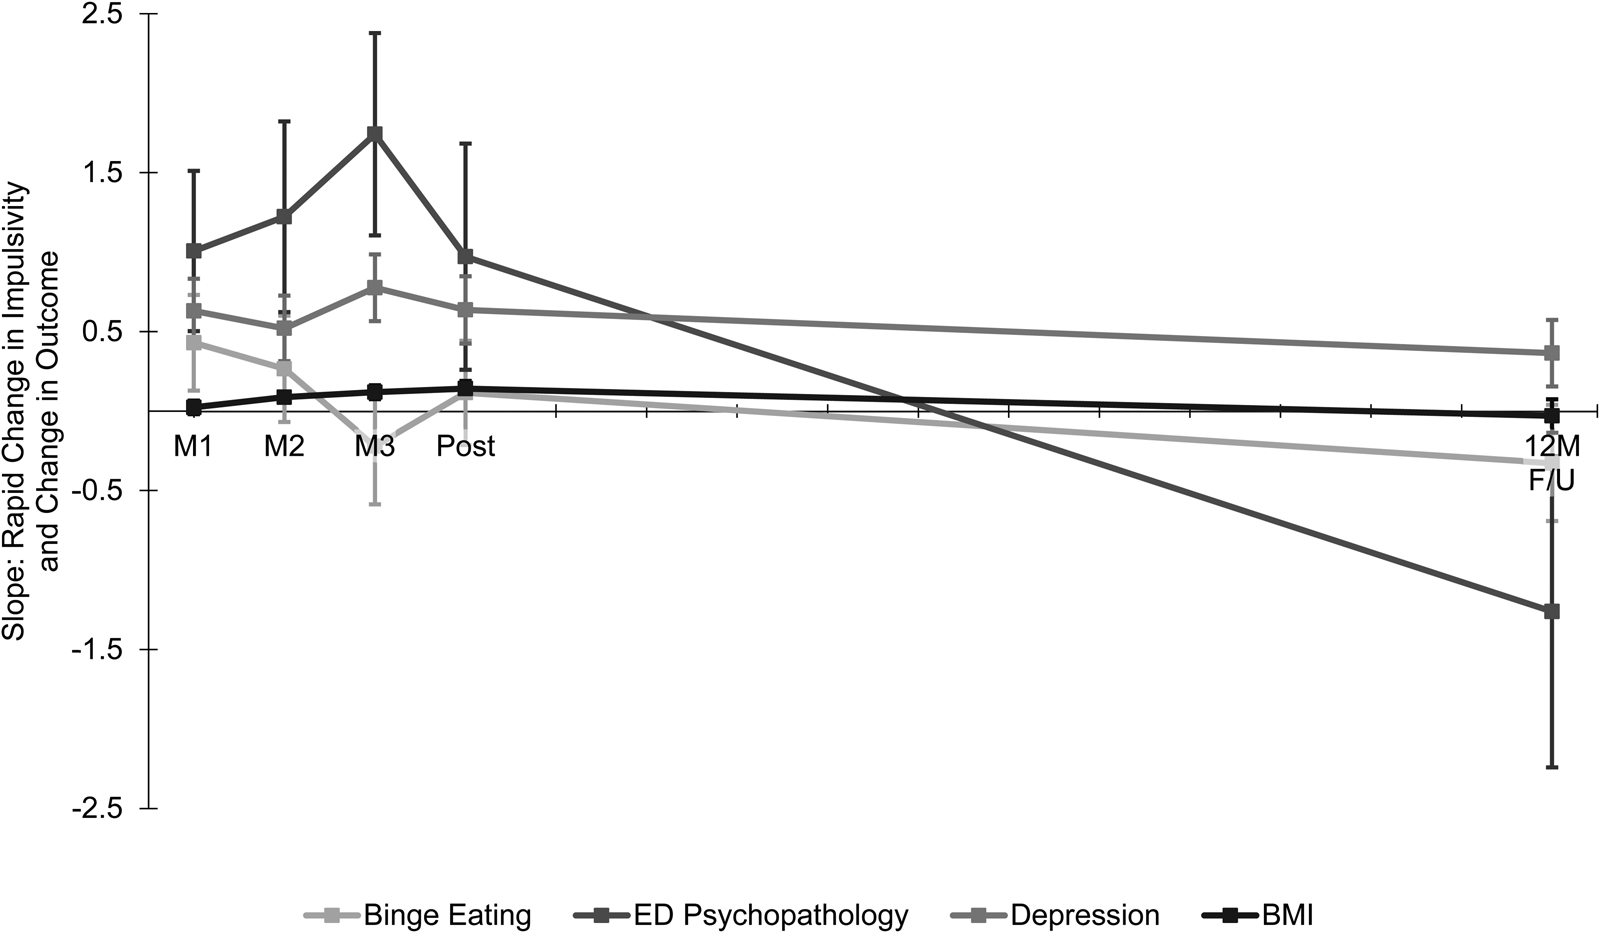
Mixed-model analyses revealed that rapid reduction in impulsivity was significantly associated with subsequent reduction in eating-disorder psychopathology during treatment (Model 2A: ICS: F (1,92.3) = 5.64, p = 0.02), but not during follow-up (Model 2B: ICS: F (1,62.3) = 0.04, p = 0.84; Fig. 2). During follow-up, analyses revealed an interaction between ICS and time, but the slopes were not significantly different from zero in post-hoc tests (Model 2B: ICS × Time: F (1,51.1) = 10.25, p = 0.002; online Supplementary Table S2).
Rapid change in impulsivity and treatment outcomes.
Note. Values represent slope of the association between rapid change in impulsivity (baseline – month 1) and change in outcome for the respective timepoint (Models 2A and 2B). Slope is expected change in outcome per unit change in impulsivity. Significant slopes are different than 0 (see online Supplementary Table S2). Error bars depict standard error. Y-axis: b -value representing slope of the effect of rapid change in impulsivity on change in outcome variables; X-axis: time. M1, month 1; M2, month 2; M3, month 3; Post, month 4; 12M F/U, 12 month follow-up; ED Psychopathology, eating disorder psychopathology.

Depression scores
In mixed-model analyses, rapid reduction in impulsivity was significantly associated with subsequent reduction in depression scores during treatment; these relationships were non-significant during follow-up (Model 2A: ICS: F (1,90.7) = 11.13, p = 0.001; Model 2B: ICS: F (1,64) = 3.81, p = 0.055; Fig. 2). Analyses also showed significant interactions between ICS, group, and time during treatment but not follow-up (ICS × Group × Time: F (9,77.5) = 2.95, p = 0.005; Model 2B: ICS × Group × Time: F (2,51.2) = 2.94, p = 0.06; other ps > 0.06). Post-hoc tests revealed that the relationship between rapid reduction in impulsivity and subsequent reduction in depression scores was significant in the fluoxetine and CBT + fluoxetine groups. There were no significant differences between slopes by treatment condition (ps > 0.17; online Supplementary Table S3).
BMI
In mixed-model analyses, rapid reduction in impulsivity was associated with subsequent reduction in BMI during treatment (Model 2A: ICS: F (1,88.2) = 7.38, p = 0.008) but not during follow-up (Model 2B: ICS: F (1,59.3) = 1.06, p = 0.31; Fig. 2).
Change in impulsivity during treatment and outcomes
Binge-eating frequency
There were no main or interactive effects of change in impulsivity during treatment on change in binge eating during treatment or follow-up (ICS: ps > 0.45).
Eating-disorder psychopathology
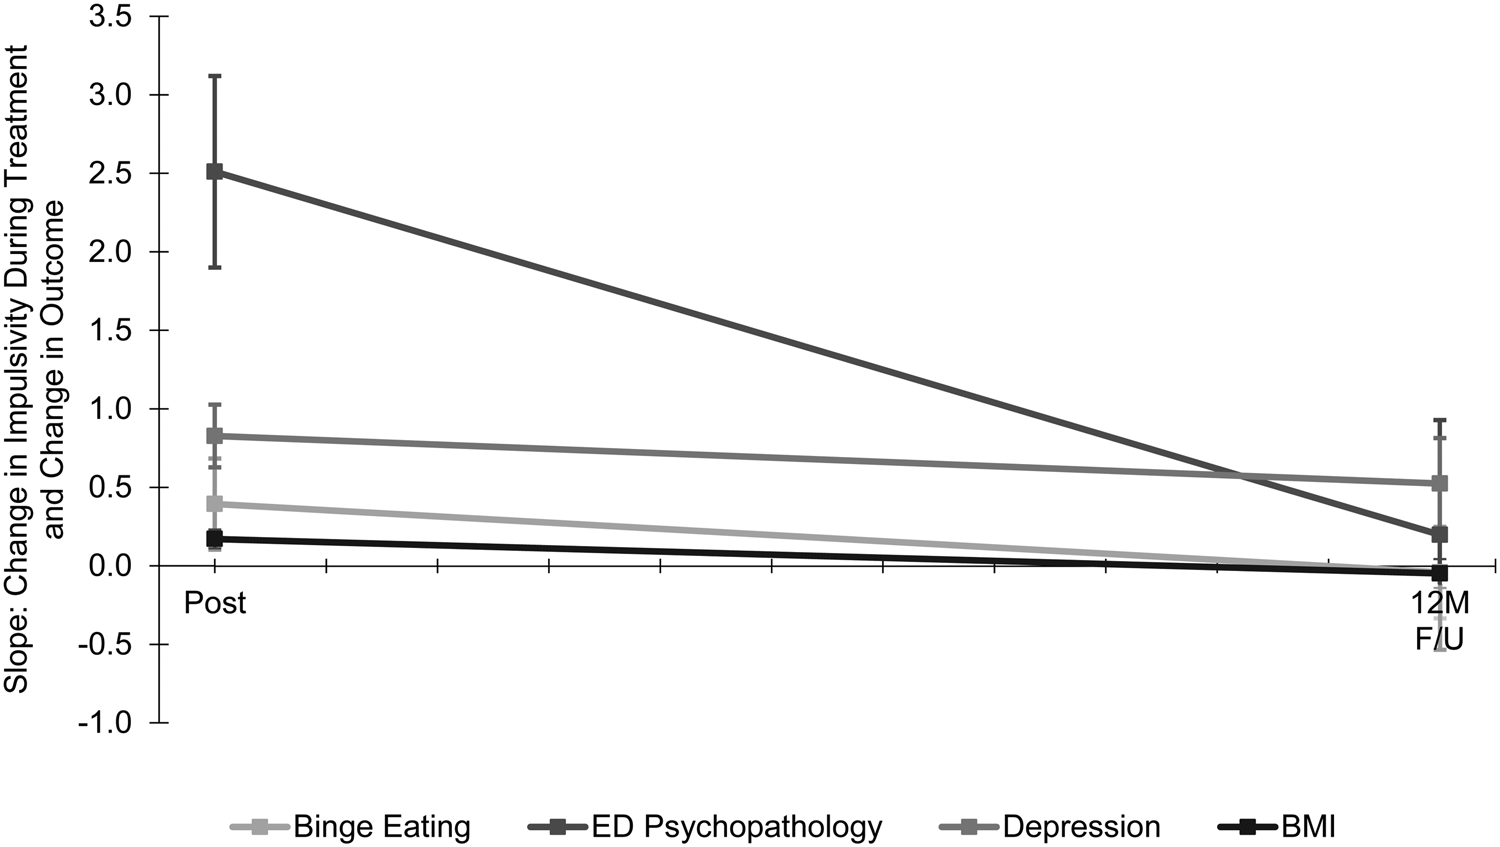
Reductions in impulsivity during treatment were significantly associated with reductions in eating-disorder psychopathology during treatment and follow-up (Model 3A: ICS: b = 2.38, p = 0.03; Model 3B: F (1,63.5) = 5.38, p = 0.02; Fig. 3). The analyses revealed a significant interaction between ICS and time (Model 3B: ICS × Time: F (1,54.4) = 11.77, p = 0.001), but no other interactions (ps > 0.32). This reflected a relationship between reduction in impulsivity during treatment and reductions in eating-disorder psychopathology at post-treatment, but not follow-up (post: b = 2.51, t (62.8) = 4.09, p < 0.001; 12-month follow-up: p = 0.79).
Change in impulsivity during treatment and treatment outcomes.
Note. Values represent slopes of the association between change in impulsivity (baseline – post) and change in outcome for the respective timepoint (Model 3B). Positive values at post are greater than zero, indicating significant effects of decrease in impulsivity during treatment on outcomes (see online Supplementary Table S4). Slope is expected change in outcome per unit change in impulsivity. Error bars depict standard errors. Y-axis: b -value representing slope of the effect of change in impulsivity during treatment on change in outcome variables; X-axis: time. Post, month 4; 12M F/U, 12 month follow-up; ED Psychopathology, eating disorder psychopathology.

Depression scores
Reductions in impulsivity during treatment were associated with reductions in depression scores at post-treatment and at 12-month follow-up (Model 3A: ICS: b = 1.11, p = 0.004; Model 3B: ICS: F (1,65.1) = 14.48, p < 0.001; Fig. 3; online Supplementary Table S4).
BMI
There was an interaction between ICS and time, reflecting a significant relationship between reduction in impulsivity during treatment and reduction in BMI at post-treatment but not during follow-up (Model 3B: ICS × Time: F (1,47) = 5.44, p = 0.02; online Supplementary Tables S4 and S5).
Exploratory analyses: baseline impulsivity
Binge-eating frequency
There were neither main effects of baseline impulsivity nor interactions between baseline impulsivity and treatment group, for binge-eating outcomes (Model 4A: ICS: F (1,107) = 0.67, p = 0.41; ICS × Group: F (3,106) = 2.51, p = 0.06; Model 4B: ICS: F (1,72) = 1.67, p = 0.20; ICS × Group: F (2,71.4) = 1.04, p = 0.36; online Supplementary Table S5).
Eating-disorder psychopathology
Baseline impulsivity did not predict or moderate treatment effects for eating-disorder psychopathology outcomes during treatment or follow-up (Model 4A: ICS: F (1,101) = 0.01, p = 0.91; ICS × Group: F (3,100) = 0.61, p = 0.61; Model 4B: ICS: F (1,68.4) = 0.00, p = 0.99; ICS × Group: F (2,67.6) = 0.28, p = 0.75).
Depression scores
Higher baseline impulsivity was associated with greater change in depression scores during treatment and follow-up (Model 4A: ICS: F (1,98.4) = 4.38, p = 0.04; Model 4B: ICS: F (1,67.8) = 6.41, p = 0.01). Additionally, there was a significant interaction between baseline impulsivity and treatment group during treatment and follow-up (Model 4A: ICS × Group: F (3,98) = 4.06, p = 0.009; Model 4B: ICS × Group: F (2,67.2) = 3.13, p = 0.05), explained by greater baseline impulsivity being significantly associated with greater change in depression scores in the CBT + fluoxetine group but not in the other groups (online Supplementary Table S6).
BMI
Greater baseline impulsivity was not associated with change in BMI (Model 4A: ICS: F (1,93) = 3.79, p = 0.06; Model 4B: ICS: F (1,68) = 0.02, p = 0.88; other ps > 0.14).
Discussion
The current study examined the effects of rapid and overall change in impulsivity on BED outcomes achieved with CBT and fluoxetine treatments. Across treatment conditions, impulsivity declined during treatment and remained at lower levels compared to baseline during 12 months of follow-up. Change in impulsivity was significantly associated with initial treatment outcomes. Rapid reductions in impulsivity were prospectively associated with reductions in eating-disorder psychopathology, depression scores, and BMI during treatment, but not with reductions in binge eating. Additionally, the relationship between change in impulsivity during treatment and depression scores persisted to 12-month follow-up. Baseline impulsivity neither predicted nor moderated treatment effects on eating-disorder outcomes or BMI. Collectively, these results suggest that change in impulsivity may be an important outcome and process underlying outcomes of CBT and fluoxetine treatments for BED, and that this process may be associated with longer-term psychological changes.
The significant reductions in impulsivity following treatments for BED were sustained 12 months after treatment. CBT, fluoxetine, and their combination were associated with significant reductions in impulsivity from baseline that persisted through 12-month follow-up. One previous treatment study for BED reported reductions in impulsivity during 11 weeks of treatment with lisdexamfetamine dimesylate (McElroy et al., Reference McElroy, Mitchell, Wilfley, Gasior, Ferreira-Cornwell, McKay and Hudson2016). Our findings extend those to different interventions (CBT and fluoxetine alone and in combination) and suggest that the changes are largely durable, as they were maintained for 12 months after discontinuing the acute treatments.
Reductions in impulsivity during treatment were observed across all treatment conditions including placebo (although a non-significant trend v. placebo was observed). Such findings might suggest that psychological and pharmacological treatments that do not specifically target impulsivity, including even a non-specific placebo treatment, may result in reduced impulsivity. These findings are consistent with previously observed reductions in impulsivity following bariatric surgery (Sarwer et al., Reference Sarwer, Allison, Wadden, Ashare, Spitzer, McCuen-Wurst and Wu2019) and varied treatments for other forms of psychopathology (Hershberger et al., Reference Hershberger, Um and Cyders2017; Littlefield et al., Reference Littlefield, Stevens, Cunningham, Jones, King, Schumacher and Coffey2015; Peckham, Forgeard, Hsu, Beard, & Bjorgvinsson, Reference Peckham, Forgeard, Hsu, Beard and Bjorgvinsson2019; Reese, Conway, Anand, Bauer, & Daughters, Reference Reese, Conway, Anand, Bauer and Daughters2019).
Our findings that changes in impulsivity were associated with broad treatment outcomes for BED echo recent research with patients being treated for substance use disorder that changes in distress tolerance were associated with outcomes (Reese et al., Reference Reese, Conway, Anand, Bauer and Daughters2019). These findings perhaps clarify further the mixed findings from prior research on baseline impulsivity as a predictor of treatment outcomes for BED (Balodis et al., Reference Balodis, Grilo, Kober, Worhunsky, White, Stevens and Potenza2014; Manasse et al., Reference Manasse, Espel, Schumacher, Kerrigan, Zhang, Forman and Juarascio2016; cf. Anderson et al., Reference Anderson, Smith, Schaefer, Crosby, Cao, Engel and Peterson2020; Castellini et al., Reference Castellini, Mannucci, Lo Sauro, Benni, Lazzeretti, Ravaldi and Ricca2012) by suggesting that impulsivity can decrease and, in those cases, the decreases predict improvements associated with treatments for BED even when baseline impulsivity does not. Because impulsive behaviors share neurobiological correlates (Bari & Robbins, Reference Bari and Robbins2013) and are observed across forms of psychopathology (Berg et al., Reference Berg, Latzman, Bliswise and Lilenfeld2015), change in impulsivity could be a transdiagnostic indicator of improvement during treatment across disorders. Future research should establish the consistency, specificity, timeline, and neurobiological mechanisms of changes in impulsivity and their relationships with BED treatment and outcomes.
Analyses revealed potential relationships between impulsivity and secondary outcome variables for BED (i.e. depression scores and BMI). Although CBT conditions had the greatest reduction in depression scores during the treatment study (Grilo, Crosby, et al., Reference Grilo, Crosby, Wilson and Masheb2012; Grilo et al., Reference Grilo, Masheb and Wilson2005), the present analyses revealed stronger relationships between change in impulsivity and depression scores in patients who received fluoxetine, which may indicate that fluoxetine reduced both impulsivity and depressive symptoms in some individuals. Exploratory analyses also showed stronger relationships between baseline impulsivity and depression scores in patients who received CBT + fluoxetine, suggesting that individuals with greater baseline impulsivity may derive this specific benefit from combination treatment. Furthermore, although these treatments did not produce significant overall reductions in BMI (Grilo, Crosby, et al., Reference Grilo, Crosby, Wilson and Masheb2012; Grilo et al., Reference Grilo, Masheb and Wilson2005), a well-known challenge in most treatment outcome studies for BED (Grilo, Reference Grilo2017; Hilbert et al., Reference Hilbert, Petroff, Herpertz, Pietrowsky, Tuschen-Caffier, Vocks and Schmidt2020), the present analyses revealed that change in impulsivity was associated with change in BMI and future research should investigate this finding further.
Our findings should be considered in the context of potential study limitations/strengths. The participants were predominantly female, White, and well-educated, and findings may not generalize to groups with different characteristics or to those who seek treatment in different types of clinical settings. Study design did not allow for including participants from the placebo condition in the follow-up analyses, which reduced the overall follow-up sample-size and precluded analyses of longer-term changes in impulsivity in those who received placebo. Additionally, the predictor/moderator analyses were exploratory in nature and thus should be interpreted cautiously. Potential strengths include the rigorous RCT design, different treatments delivered through standardized protocols, psychometrically established assessments performed by independent assessors, and rigorous statistical analyses examining multiple aspects of change in impulsivity and outcomes through 12-month follow-ups.
With the study's limitations/strengths as context, we cautiously offer clinical implications. Change in impulsivity may be a non-specific process that is prospectively associated with changes in some clinical outcomes in those receiving treatment for BED. Even if non-specific, active monitoring of the rate of change in impulsivity during treatment could help to inform timely interventions. The observed trend toward an increase in impulsivity during follow-up suggests potential utility of clinical and research work targeting risk for relapse. Alternatively, if change in impulsivity is found to be directly related to clinical improvement, incorporating impulsivity into conceptualizations of BED could refine treatments (Balodis, Grilo, & Potenza, Reference Balodis, Grilo and Potenza2015; Boswell & Grilo, Reference Boswell and Grilo2020; Boswell & Kober, Reference Boswell and Kober2016; Hutson, Balodis, & Potenza, Reference Hutson, Balodis and Potenza2018). Targeting impulsivity more specifically, including through specific pharmacological agents (McElroy et al., Reference McElroy, Mitchell, Wilfley, Gasior, Ferreira-Cornwell, McKay and Hudson2016), brief skills training (Boswell, Sun, Suzuki, & Kober, Reference Boswell, Sun, Suzuki and Kober2018), and impulsivity-focused augmented treatment (Schag et al., Reference Schag, Rennhak, Leehr, Skoda, Becker, Bethge and Giel2019) could help speed the rate at which impulsivity changes or improve the durability of these changes, and thereby enhance BED treatment outcomes.
Supplementary material
The supplementary material for this article can be found at https://doi.org/10.1017/S003329172100475X.
Financial support
This research was supported by the National Institutes of Health (NIH) grant R01 DK49587 (Dr Grilo). The authors were also supported, in part, by NIH grants (awarded to Dr Grilo) R01 DK121551, R01 DK114075, and R01 DK112771. The funders played no role in the content of this paper.
Conflict of interest
The authors (Boswell, Gueorguieva, and Grilo) report no conflicts of interest. Drs Grilo and Gueorguieva report several broader interests which did not influence this research or paper. During the past 12 months, Dr Grilo's broader interests include Honoraria for lectures and CME activities and Royalties from Guilford Press and Taylor & Francis Publishers for academic books. Dr Gueorguieva discloses consulting for Cohen Veterans Biosciences and a provisional patent submission by Yale University: Chekroud, A.M., Gueorguieva, R., and Krystal, J.H. ‘Treatment Selection for Major Depressive Disorder’ (filing date 3rd June 2016, USPTO docket number Y0087.70116US00), and Royalties from Taylor & Francis for an academic book.