


The Conservative and Unionist hegemony in the two decades between 1886 and 1906 is one of the most densely researched topics in late Victorian and Edwardian political history. The 1883–5 reforms – namely the Corrupt and Illegal Practices Act of 1883, the Third Reform Act of 1884, and the Redistribution of Seats Act of 1885 – transformed Britain's electoral system, and Conservatives, especially Lord Salisbury, were exceedingly pessimistic about their party's future prospects.Footnote 1 Perhaps unsurprisingly, historians have been preoccupied with explaining how the traditional party of the gentry and squirearchy managed to thrive in this new system of ‘unmoderated democracy’.Footnote 2 Within this discussion, one of the most hotly contested topics has undoubtedly been the degree to which Salisburyian Unionist success – especially the landslide election victories of 1886, 1895, and 1900 – can be seen as a ‘negative’ phenomenon based on low turnouts and Liberal disorganization, or instead as a ‘positive’ engagement with the emergent democracy driven by a new populist and progressive Conservatism.
At the centre of this debate is the work of the political scientist J. P. Cornford, whose pioneering statistical studies of the 1960s did most to establish the traditional negative interpretation.Footnote 3 In his seminal Victorian Studies article of 1963, Cornford traces the often hesitant development of the Conservative party's constituency organization after 1868, as it adapted to the challenge of the enlarged urban electorate created by the Second Reform Act. Part of this challenge, especially from the 1880s, lay in attracting the support of suburban electors, widely recognized to be the fastest growing demographic group in late Victorian Britain.Footnote 4 Indeed, Salisbury remarked to Stafford Northcote in 1882 that ‘I believe there is a great deal of Villa Toryism that requires organisation.’Footnote 5 For Cornford, the Redistribution of Seats Act of 1885 – where new suburban islands of villadom were created as discrete constituencies – paved the way for class to displace community as the chief basis of political identity. He argues that this began to bear substantial electoral fruit for the Conservatives from 1885, providing a solid nucleus of predominantly middle-class seats which were easy for Unionists to win consistently. In these constituencies (and to a lesser extent in others), the Conservatives benefited from low turnouts, smaller electorates, and Liberals failing to contest. Cornford thus contends that the new dynamics of post-reform politics gave the Unionists a systemic negative advantage, and gained the upper hand over their opponents almost by default.
Cornford's article seeks to demonstrate this theory for English borough constituencies. He prefaces his analysis first by highlighting the large number of seats won by the Conservatives uncontested.Footnote 6 Second, he calculates the relationship between Tory support and turnout using the Pearson's correlation coefficient,Footnote 7 finding that for most borough divisions in most regions and of most sizes, there is a noticeable inverse correlation.Footnote 8 Third, he compares overall Unionist vote share in each election from 1885 to January 1910 with that of December 1910, concluding that their support was relatively stable throughout the period – implying that electoral fluctuations were a function of vacillations in the Liberal poll. Finally, looking only at metropolitan divisions, Cornford establishes a statistical relationship between Conservative support and prosperity.Footnote 9 In addition to all this, Cornford elsewhere uses similar statistical measures to shed light on the social and regional dynamics of elections in this period.Footnote 10 Overall, he concludes that after the Third Reform Act, Unionists owed a portion of their success (at least up to 1900) to a limited, but very stable and affluent, base of support, with victory often made possible by lower turnouts, Liberal disarray, and superior organization.Footnote 11
Cornford's theory – especially the link between low turnout and Unionist success – came to influence numerous general histories of the Conservative party in the decades that followed, most of which used his fairly tentative statistical conclusions to make much bolder claims than he did. Robin Harris, for example, has written that ‘high turnouts became in Tory folklore ominous harbingers of a bad result’, while Ewan Green contends that the Conservatives were determined to ‘avoid rather than confront the mass electorate’ with organizers believing it ‘essential to keep as many of those on the register from turning out on polling day’, especially urban working-class voters and agricultural labourers.Footnote 12 Richard Shannon, meanwhile, claims that ‘tight registers and low polls were classic maxims of Conservative electioneering’ under Salisbury, while John Ramsden further argues that they represented ‘the Conservative ideal of electoral management right through to 1918’.Footnote 13 Brendan Evans and Andrew Taylor have attempted to explain the supposed Tory preoccupation with low turnouts by estimating that ‘core Conservative support was about 25 per cent to 30 per cent of the electorate’ with ‘support beyond this…[being] determined by the behaviour of Liberal voters’.Footnote 14 The driving philosophy of Salisbury and Captain Middleton was thus to ‘keep the electorate to less than democratic proportions…by exclud[ing] enough of the poorer population from the vote to keep the electorate below sixty per cent of Britain's adult males’.Footnote 15 It is entirely in character of the general historiography that Martin Pugh should describe the best Conservative result in the period, 1895, as ‘essentially a negative reaction…which saw Liberal abstentions and Conservative victory by default’.Footnote 16
The past twenty years have also seen numerous revisionist interventions by scholars influenced by the ‘new political history’ which have sought to debunk this ‘negative’ consensus. Much of the groundwork for this was assembled by Jon Lawrence's English Historical Review article of 1993, which stressed the crucial but hitherto underplayed positive appeal of late Victorian urban Conservatism in the constituencies.Footnote 17 Although not an explicit refutation of Cornford, Lawrence depicts a vibrant and populist ‘cakes and ale’ Toryism which socialized the population through garden parties, fetes, shows, and sport – and championed the working man's right to his pint and his baccy, and to an occasional flutter at the bookies. For Lawrence, Conservative candidates were often at pains to indulge rather than avoid the electorate. A succession of subsequent scholars – discussed below – developed and expanded Lawrence's argument. In the words of one, this body of work ‘constructs a positive view of the Conservative party that impresses by its ability to use politics and ritual to socialise the masses’.Footnote 18
Two early criticisms of Cornford appeared in 1997 in Parliamentary History. The first, by Frans Coetzee, dissects the foundations of Conservative success in the borough of Croydon.Footnote 19 For him, suburban England was not a staid repository of passive Conservatism, but an unstable setting for many clashes, such as between locals and newcomers, or commuters and manual workers. These clashes concerned not only economic self-interest, but also hinged on Croydon's idiosyncratic political culture. Villa Toryism, then, was not merely a matter of the party harvesting affluent voters who looked to Unionism to safeguard their propertied interests, but a process of constant churn, and of co-opting new voters and adapting to changing cultural circumstances.Footnote 20 The second article, by Jon Lawrence and Jane Elliott, relies on a statistical examination rather than a reconstruction of local electoral culture.Footnote 21 Though criticizing the top-down ‘ecological’ approaches for their insensitivity towards the nuances of local politics, they advocate more tightly controlled psephological analyses which are anchored around constituencies rather than the ‘surrogate units’ popular with electoral sociologists such as K. D. Wald.Footnote 22 On this proviso, they conduct various tests of the negative Unionism hypothesis on single-member English boroughs. They find that throughout the period, only in 1895, 1900, and 1906 was average turnout in Conservative-held seats lower than in Liberal-held seats (and only in 1900 was the difference substantial). Furthermore, what decrease in Tory seats’ turnout was discernible was heavily skewed towards the south-east, whereas in the rest of England it remained almost unchanged. Similarly, they conclude that there was a limited relationship between the size of a borough and turnout (and what relationship did exist in 1885 had faded by 1910).Footnote 23 In short, they conclude that the evidence for the main assertions of negative Unionism in the single-member English boroughs is underwhelming.
Paul Readman, in his Historical Journal article of 1999, questions the negative interpretation of the Unionist victory in the 1895 general election.Footnote 24 Indeed, with the Liberals hamstrung by their jumbled ‘faddist’ message, this election may seem to be the apogee of Salisburyian negativity. Echoing Lawrence, Readman emphasizes the extent to which Tory attacks on the Local Veto bill or church disestablishment were expressed in a populist, libertarian language.Footnote 25 He also questions Cornford by highlighting the disparity (which Cornford acknowledged) between the seemingly strong negative relationship between Unionist vote share and turnout on the one hand, and on the other, the much weaker correlation between Unionist swing and change in turnout.Footnote 26 For the 1895 election, he compares the swing to both Unionists generally and Conservatives specifically in those seats that saw a fall in turnout, and those that saw a rise. The majority of cases show a greater swing where turnout had increased.Footnote 27 These observations, along with the absence of any systematic evidence of Tory agents suppressing the register, lead Readman to doubt the perception of the 1895 election as an exemplar of negative Unionism. His findings are corroborated by Kathryn Rix's study of party agents in this period, which argues that Liberal organizers were just as willing to strike electors off the register as their Tory opponents.Footnote 28
Matthew Roberts, in his 2006 Historical Journal article, further emphasizes Unionism's positive working-class appeal in his case-study of Leeds, focusing on the North division and its illustrious Conservative MP, W. L. Jackson.Footnote 29 The seat may superficially seem an archetype of Villa Toryism but, like Coetzee, Roberts is keen to challenge preconceptions of such places as tranquil havens of political conformity. He points out that Leeds Conservatives did not treat the 1885 Redistribution Act as an automatic boon, nor did Leeds North at first seem to them especially middle class or winnable.Footnote 30 Like Coetzee and Readman, Roberts sees Unionist success after 1885 as the fruit of a sustained investment in working-class culture. Especially notable is his brief statistical comparison of the five Leeds divisions, where he correlates Unionist vote share with turnout in each.Footnote 31 The two more affluent seats conform to Cornford's analysis, whereas the other more working-class constituencies do not. In a second intervention in the debate seven years later, Roberts also investigates the understudied field of by-elections.Footnote 32 He finds, in the 218 contests which occurred between 1885 and 1906, only a mild inverse correlation between Unionist performance and turnout.Footnote 33 Additionally, he finds considerable divergence in this trend between by-elections in different social settings.Footnote 34 Overall, Roberts sees this analysis as further corroboration of the ‘positive Unionism’ thesis and the weakness of Cornford's argument.
The final major revisionist contribution is Alex Windscheffel's monograph on London Conservatism, which contains a statistical analysis methodologically similar to those above, but for the fifty-nine constituencies in the capital.Footnote 35 Starting with an explicit imitation of Cornford's method, Windscheffel shows inverse correlations between turnout and Unionist vote share for around half of all London seats through the whole period.Footnote 36 Distinguishing between individual elections shows especially marked negative correlations in 1895 and 1900.Footnote 37 Furthermore, measuring the relationship with turnout by swing rather than vote share gives noticeable negative readings for 1886, 1892, and 1900 (although not 1895).Footnote 38 An examination of social class also supports Cornford, and a positive link between rateable value per head and Unionist support is apparent.Footnote 39 While these analyses generally seem to strengthen the negative Unionism thesis, a number of counter-trends nonetheless lead Windscheffel to reject it. The first is the fact that, in safe Conservative seats, turnout was lower than in safe Liberal seats only in 1900.Footnote 40 Also, correlating electorate size with Unionist vote share for each general election gives us predominantly positive, rather than negative, coefficients. Finally, the positive link established between affluence and Unionist support markedly diminishes when a small number of exceptionally affluent constituencies are excluded.Footnote 41 In short, Windscheffel maintains that Unionist domination in Victorian London after 1885 had little to do with low turnouts and stale registers, and also cannot adequately be explained by Liberal shortcomings.
I
This article's central contention is that historians have gone too far in rejecting ‘negative Unionism’ as originally described by Cornford himself. While his focus on top-down aggregations and class cleavages clearly led him to underplay the vibrancy of local electoral cultures and the dynamism of local candidates’ constructions of claims to legitimacy, the fundamental relationship between Unionist vote share and turnout which he discovered is broadly corroborated in the analysis below, albeit for England, rather than Britain. Although Cornford's data and interpretation were used by subsequent historians to construct an overarching interpretation of negative Unionism, it is undoubtedly they who made the more grandiose claims. Crucially, scholars such as Green, Marsh, and Shannon also argued that the Conservatives deliberately sought to suppress the number of people who voted, rather than simply benefited from low polls. In reality, it is this interpretation that revisionist scholars have powerfully refuted, with Cornford condemned alongside his more dogmatic acolytes. Indeed, while the discovery of counter-trends has successfully undermined the universality of his psephological models, it is easily overlooked that some existing revisionist analyses actually corroborate him.Footnote 42 Our contention is that while his work contains many flawed sociological assumptions, his thesis is largely correct. Using more than treble the electoral data originally utilized by Cornford, we seek to investigate the statistical basis for negative Unionism more holistically, exploring the relationship between turnout and Unionist strength nationally, by constituency, by region, and by social cleavage, before proceeding to an analysis of the wider impact of uncontested seats.Footnote 43 Rather than attempting to advance a new counter-revisionism, this article seeks to qualify the recent positive Unionism consensus by demonstrating that the Conservatives benefited from important negative structural factors, especially in the years 1886–1900. That we examine (and demonstrate) considerable variation in trends between localities and constituency types also corroborates the core revisionist contention on the importance of locality, but at the same time uses it to forward a more nuanced statistical case on the electoral fundamentals of Unionism that broadly supports many of Cornford's original contentions.
One key advantage that allows this study to go further than previous endeavours is the breadth of its electoral dataset. The recently released British electoral data, 1885–1949 resource provides digital versions of two volumes of F. W. S. Craig's British parliamentary election results, and this development entirely transforms the potential of psephology for this period.Footnote 44 Previous work has concentrated only on one relatively small group of constituencies – the 183 single-member English boroughs, or seats in one locality such as London or Leeds. Crucially, Scotland and Wales, double-member boroughs, and county divisions have been excluded from this debate, which is somewhat problematic considering that they make up around two-thirds of the total number of constituencies in Great Britain. We instead analyse every seat at every election in the 1885–1910 period (537 excluding Ireland and the universities) giving us close to 5,000 data-points to perform large-scale comparative analyses for correlation and regression. Having the complete dataset means we are no longer relying on samples, and it is only the large number of uncontested elections in this period that prevents us from making perfect diachronic comparisons featuring every constituency. However, unlike previous scholarship, we also guard against this inbuilt shortcoming in our data by testing for statistical significance (using t-tests) allowing us to ascribe confidence thresholds to trends we uncover.Footnote 45
II
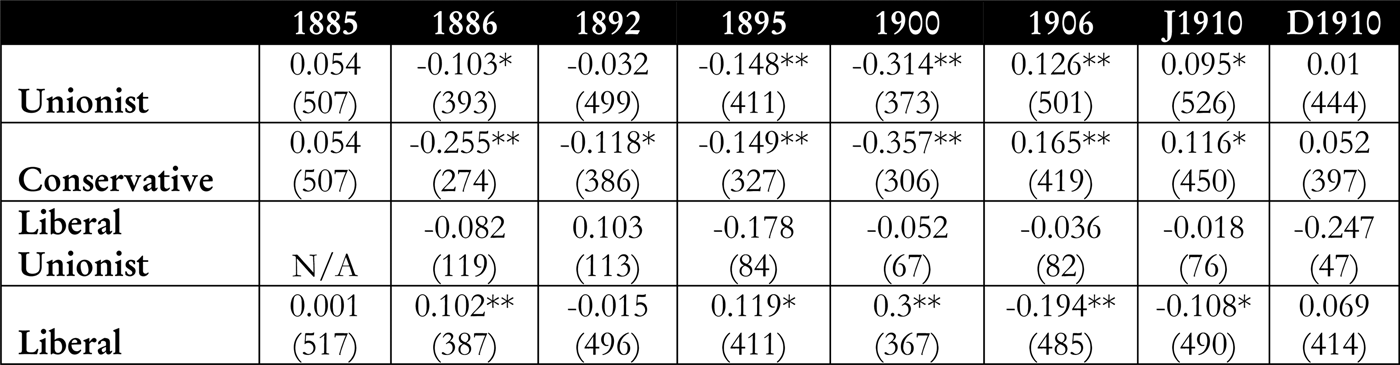
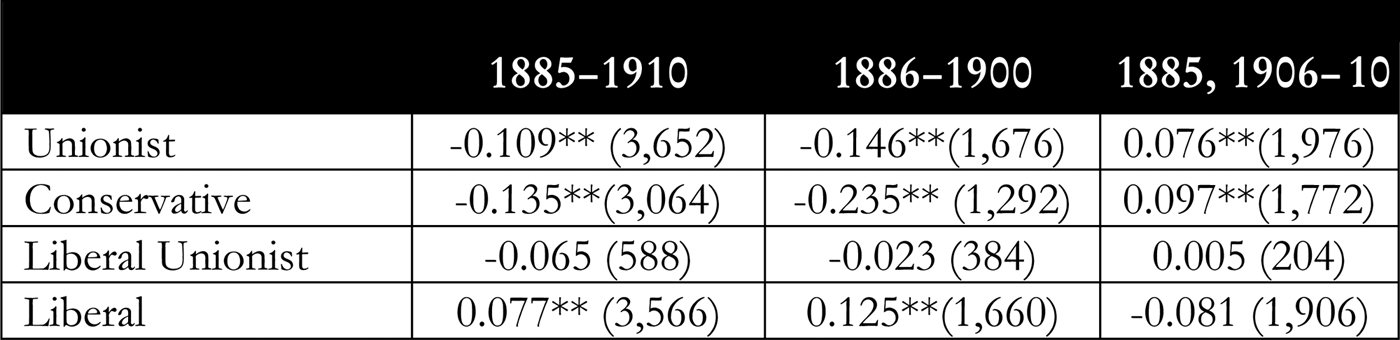
This article's first major analysis concerns the relationship between Unionist vote share and turnout. We begin at the aggregate level, and Figure 1 shows the average correlations for each election, and Figure 2 for groups of elections. Each contested constituency is included (the number is shown in brackets after the coefficient) and significance denoted as described in n. 45.Footnote 46 The correlations in Figure 1 show that the general trends established by Cornford and Lawrence and Elliot for boroughs hold remarkably steady when the analysis is extended to all constituencies. The four elections between 1886 and 1900 remain the core period where the negative correlation between Unionist vote and turnout was most marked, with 1900 the peak. The four elections outside this period by contrast show positive coefficients, the strongest being 1906. When we exclude the Liberal Unionist scores and look only at the Conservatives, the correlations for both periods strengthen, becoming more negative for the four Victorian contests, and more positive for the three Edwardian ones. The Liberals, who are included for comparative purposes, register – as one might expect – corresponding correlations in the opposite directions, with perhaps the most interesting being the negative correlation for 1906.
Correlation between Unionist vote share and turnout in all contested constituencies.

Correlation between Unionist vote share and turnout in all contested constituencies.
The obvious problem, of course, is that these correlations seem weak, with even the −0·357 registered by the Conservatives in 1900 short of what is often categorized as even a moderately strong relationship. Windscheffel and Roberts in particular have argued that weak aggregate correlations fatally undermine Cornford's theory, and both cite a general social science textbook that defines correlations under 0·69 as ‘modest’ and those under 0·4 as ‘low’.Footnote 47 However, it should be pointed out that there is in fact ‘no commonly accepted standard’ for these thresholds.Footnote 48 For example, various books – from a range of disciplines – place the rule of thumb for a moderate correlation at 0·6, 0·5, 0·3, and even as low as 0·2.Footnote 49 Indeed, one popular textbook – Statistics in plain English – points out that even a ‘low’ 0·15 correlation could be meaningful for certain analyses, depending on the nature and amount of data.Footnote 50 In this case, we have a complete dataset, and insofar as there are uncertainties due to uncontested seats, the Unionist and Conservative trends established during the key 1886–1900 period are (with one exception) statistically significant or super-significant. This means we have proved conclusively that a weak negative relationship exists at the aggregate levels, which is then reversed in 1906 and January 1910.
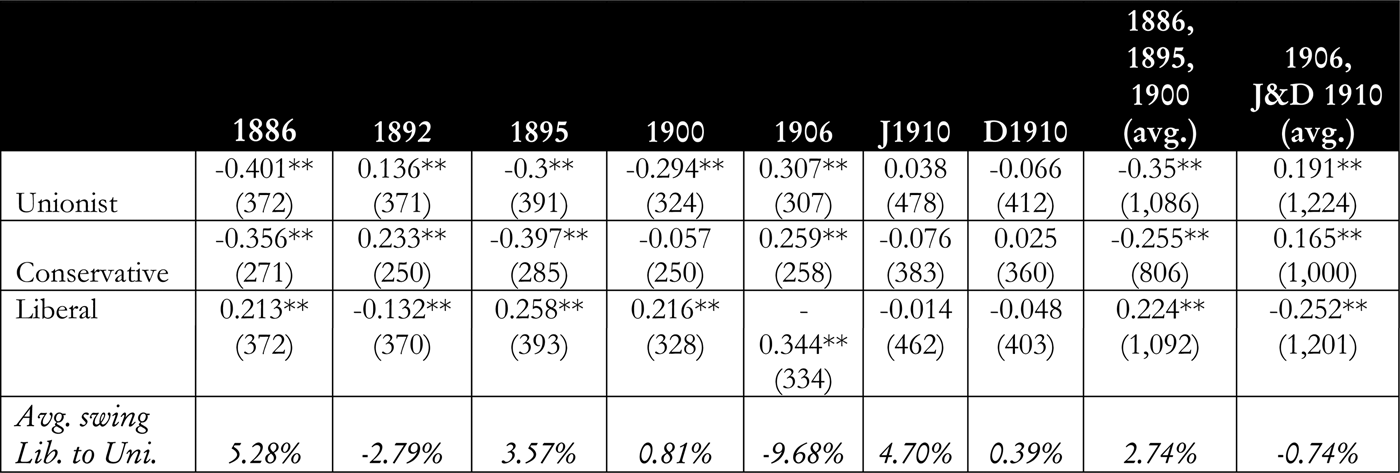
It is also worth examining swing in the same manner as vote share. Cornford's swing analysis for borough constituencies returns extremely weak correlations, leading him to drop them from his analysis. For Readman in particular, this is a grave flaw that considerably compromises his general case. Figure 3 shows a correlation analysis for swing (comparing each instance where a constituency was contested in both elections). Interestingly, rather than returning weaker correlations, the inclusion of all constituencies in our analysis in fact produces coefficients which are in many cases notably stronger than those for vote share. However, the problem with using swing is that it measures change in party support rather than the actual strength of that support. For example, the swing to the Unionists in a landslide like 1900 was just 0·58 per cent nationally, because it was preceded by another landslide in 1895. Because we are interested in measuring the underlying strength of a relationship, rather than its election-by-election fluctuations, vote share remains clearly the preferable measure.
Correlation between swing to Unionists and turnout, in all constituencies contested in both the indicated general election and the previous one.
Overall, it is difficult to argue that these aggregate national analyses show anything more than a tentative relationship between low turnout and Unionist success in the crucial 1886–1900 period. On the face of it, it thus seems entirely fair to side with the revisionists. However, as Lawrence and Elliot have pointed out, such generalized top-down calculations conceal innumerable regional and local trends which may be stronger, or run entirely counter, to the aggregate picture. We will thus now examine negative Unionism from the bottom up.
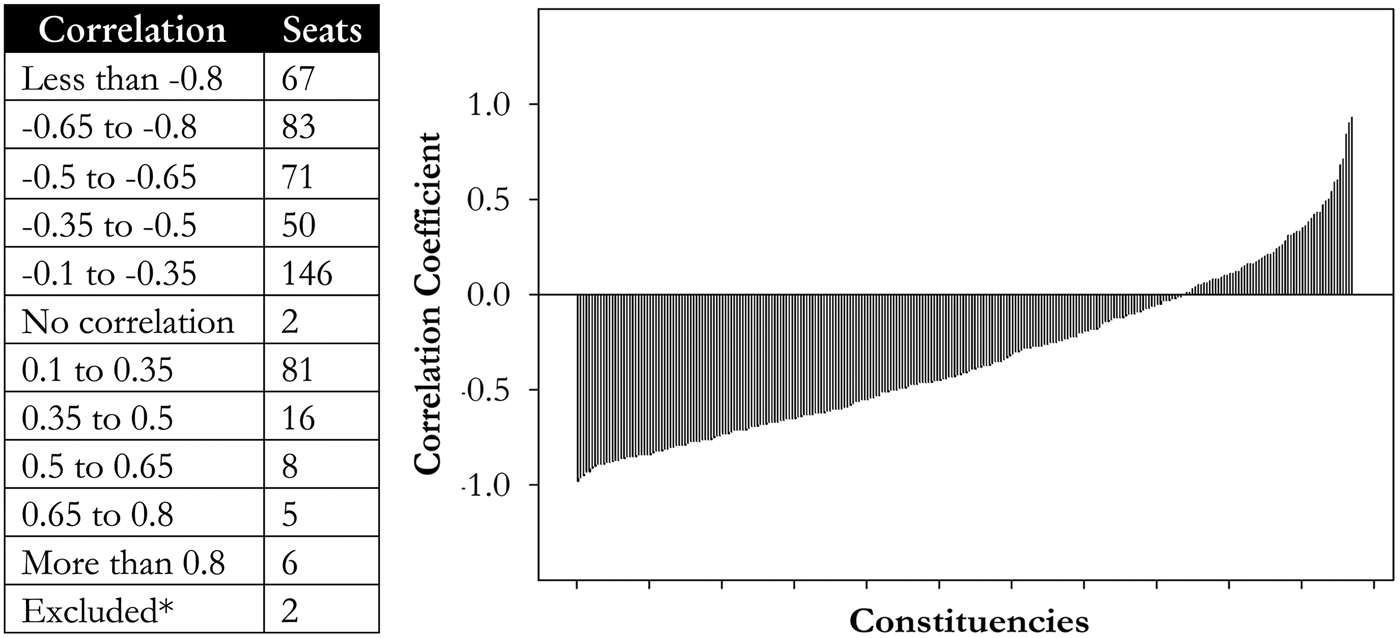
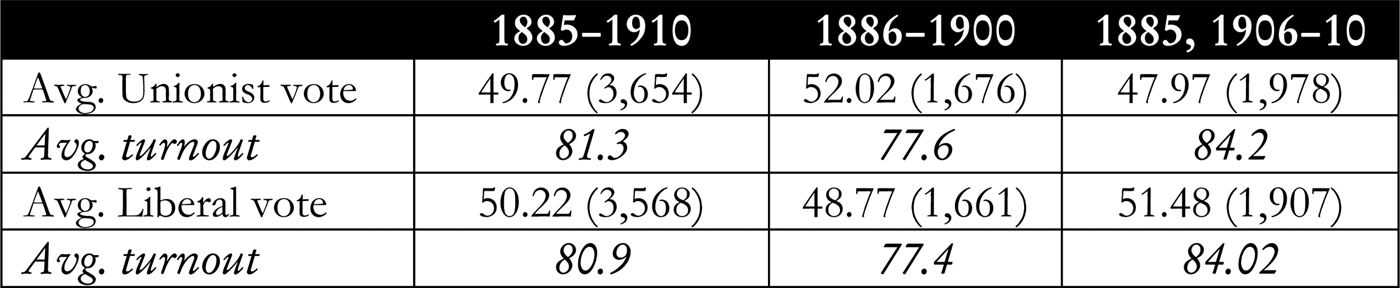
Cornford's correlation analysis by individual constituencies appears to provide much stronger evidence of negative Unionism than his national aggregate analyses. He finds that more than half of English borough constituencies between 1885 and 1906 show correlations of less than −0·5, and a quarter of less than −0·8.Footnote 51 The obvious next step is thus to extend this analysis to every individual constituency, and also across the whole 1885–1910 period. This gives us up to eight data-points for each seat depending on how many times it was contested. Figures 4.1 and 4.2 show that the vast majority of constituencies (78 per cent) register a negative correlation over the 1885–1910 period. Many of these were strong, with 150 at −0·65 or less, and 221 at less than −0·5. This compares to just nineteen constituencies with positive coefficients of more than 0·5. If we run t-tests, we find that 103 register statistical significance.Footnote 52 In these constituencies, we thus have a high level of confidence that our observed trend is robust, and would have also been repeated in other elections (had they happened). Of the 103, 100 are negative (all at −0·65 or less) and just three positive. Interestingly, one of this trio is Leeds West, a constituency highlighted by Matthew Roberts as a counter-example in part of his case against negative Unionism.Footnote 53 However, this analysis suggests that this villa seat was one of just a handful of exceptions to a prevailing trend in the opposite direction. Overall, while Figure 4.1 confirms the unsurprising conclusion that Unionists did not uniformly benefit from low turnout in every constituency, it nevertheless demonstrates that they did so consistently in over 200, whereas the opposite was true in but a handful. Interestingly, the core group of 100 seats which pass the significance test for negative correlation is quite mixed, with all regions and social cleavages well represented.Footnote 54 The average Unionist vote share in this group is also very average: 49·57 per cent compared to 49·77 per cent for all constituencies across the period. This suggests that, while certain regions or categories of seat saw notably greater Unionist advantages gained by low turnout (as we shall see below), the phenomenon cannot be pigeonholed as something which occurred only in certain places, or in certain categories of constituency.
(left). Correlations between Unionist vote share and turnout, 1885–1910: number of constituencies sorted by bands. * City of London and Liverpool Scotland were excluded from this analysis, owing to an insufficient number of contests between Unionist and Liberal candidates. Fig. 4.2. (right). Graph showing all 537 constituencies by correlation, negative to positive.
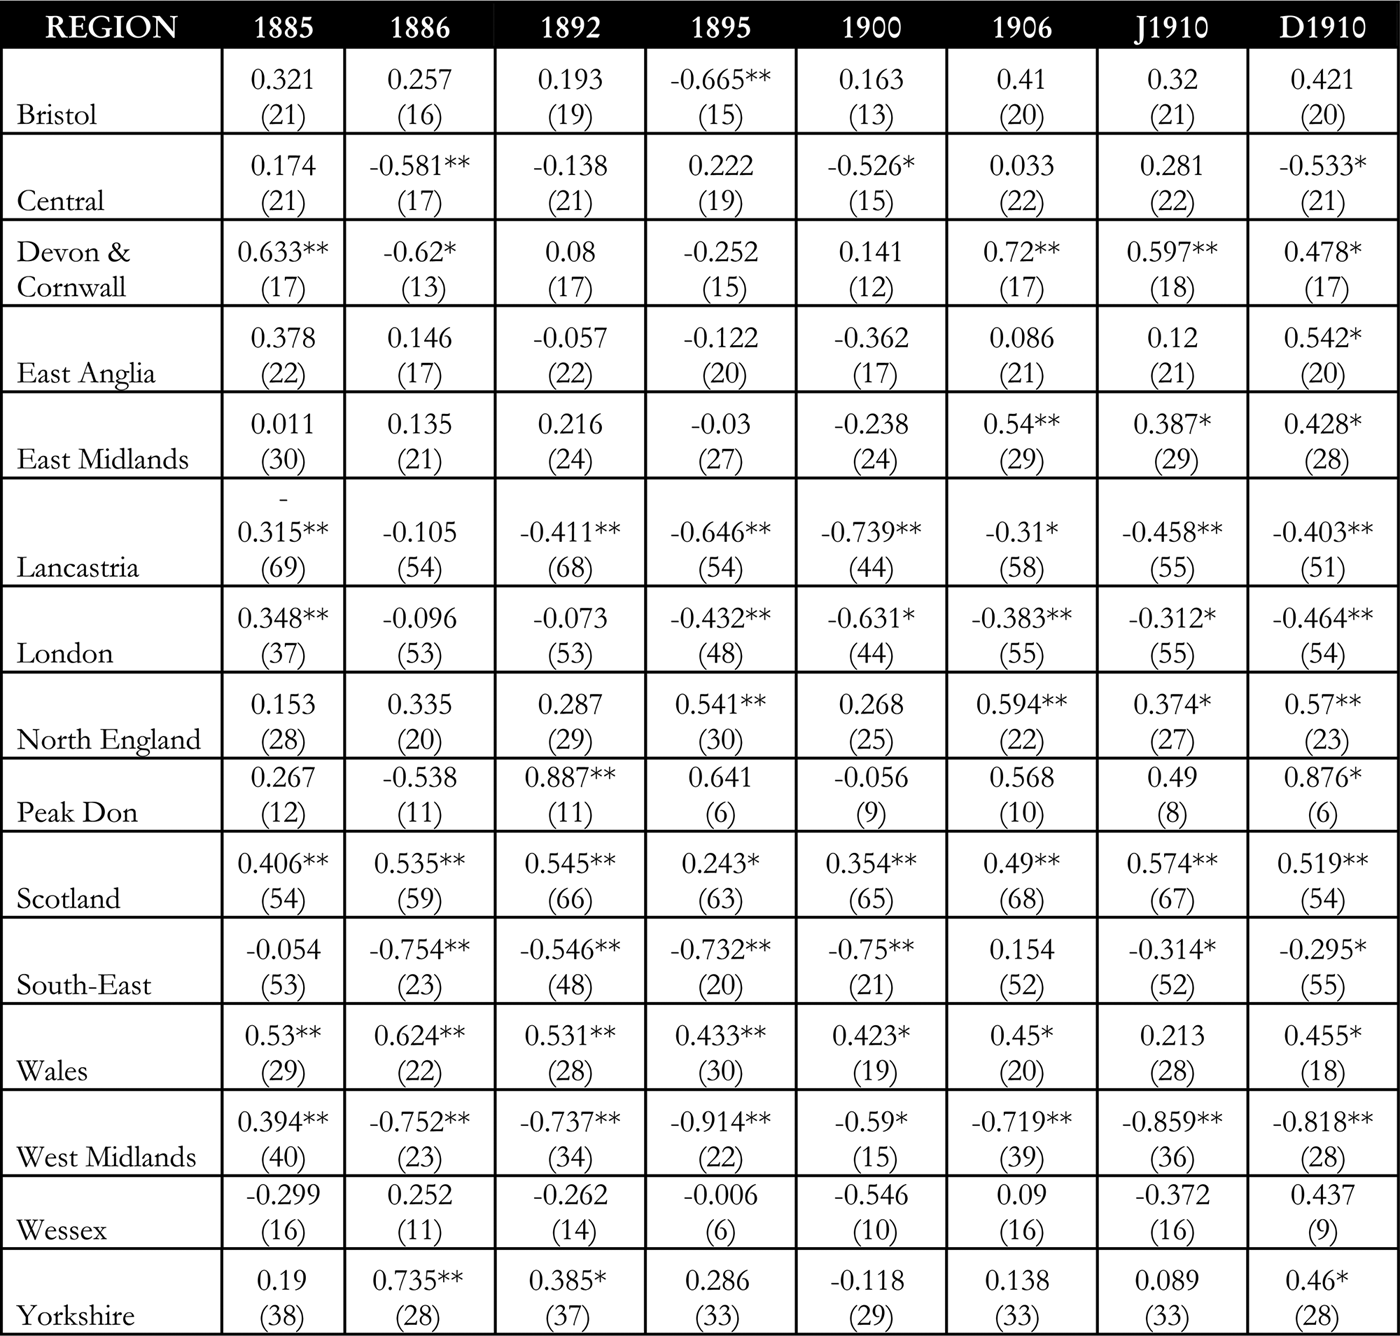
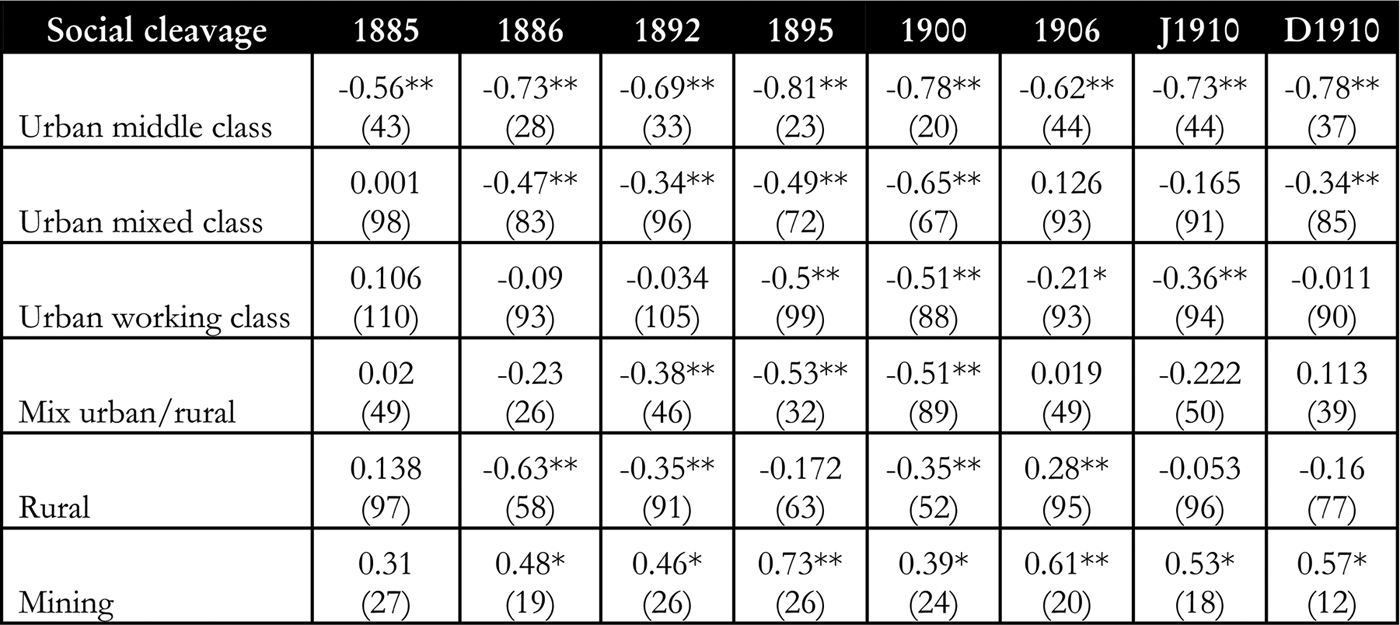
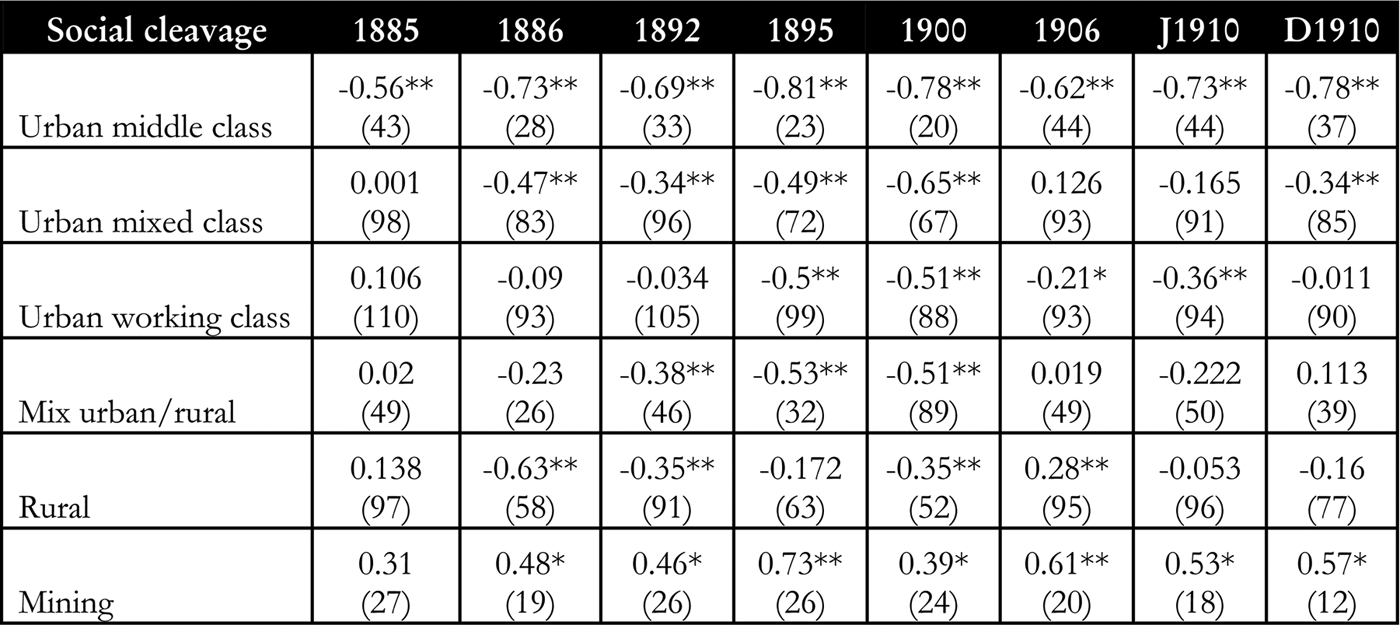
The data from constituencies clearly paints a very different picture from the national aggregates. The logical final step in this analysis is to investigate the mid-point between the national and the local, and examine correlations by region and social cleavage, in this case by using Henry Pelling's and Neal Blewett's constituency categories. While we have observed that the core 100 significantly negatively correlated seats throughout the period are quite mixed, there is still considerable scope for trends in region and social cleavage to exist at individual elections or groups of elections, making this analysis worthwhile. Figures 5.1 and 5.2 show the correlations for region and social cleavage at each election in the period respectively.Footnote 55
Correlation between Unionist vote share and region in all contested constituencies.
Correlation between Unionist vote share and social cleavage in all contested English constituencies.
Turning first to regions, Figure 5.1 shows, unsurprisingly, that the vast majority register negative correlations during 1886–1900. However, the West Midlands and South-East regions are the two standouts, returning consistently high negative coefficients, with Lancastria (from 1892) and London (from 1895) not far behind. In the Edwardian period, this trend continues in the West Midlands and to a lesser extent London, but reverses in the two other aforementioned regions. Most interestingly, Scotland and Wales return consistently positive correlations throughout the whole period, suggesting that negative Unionism was overwhelmingly an English phenomenon, especially outside of the north. Overall, Figure 5.1 confirms that for 1886–1900 (and especially for 1895 and 1900), in a core four regions, comprising around 200 seats, the correlation between low turnouts and Unionist success was consistently very strong.
Figure 5.2, which uses Blewett's admittedly somewhat debatable constituency classifications (for England only) also reveals some interesting trends. The most striking observation is how far middle-class urban seats return consistently high and super-significant negative correlations through all eight elections. A similar – if less pronounced – picture can be seen in urban mixed-class constituencies between 1886 and 1900. Of course, the fact that many of these divisions were predisposed to be safer Unionist seats made it less likely that increases in turnout would have resulted in the scale of losses that would have occurred in a ‘typical’ cross-section of constituencies. However, the consistently telling correlations in seats in these two groups – many of which might reasonably be classified as ‘villa’ – certainly suggest that Unionists benefited from low polls in these localities to a much greater extent than in others, seemingly those which lacked an urban middle-class electorate.Footnote 56 While Cornford's theory of ‘Villa Toryism’ might be simplistic and based on sociological presumptions, this statistical evidence suggests it was perhaps less mistaken than revisionist historians have argued. Finally, as with Figure 5.1 above, this analysis also flags up an interesting counter-trend – namely the consistent positive coefficients registered in mining seats throughout the whole period.
The final part of this regional analysis is to factor the strongest trends flagged by Figures 5.1 and 5.2 (Scotland and Wales, and urban middle-class and mining seats in England) into the aggregate analysis of all constituencies (Figure 1) and see how this changes the bigger picture. Figure 6.1 shows scatterplots for 1886, 1892, 1895, and 1900 with interesting groups of constituencies marked out. Figure 6.2, meanwhile, shows similar scatterplots for constituencies divided by country. On each of Figure 6.1's scatterplots, the overall lines of best fit for all seats show modest negative inclines, as we would naturally expect given the data in Figure 1. However, when Scotland, Wales, mining seats, and urban middle-class constituencies are grouped and highlighted, it becomes immediately obvious that aggregate national correlations conceal strong (and often countervailing) trends that exist beneath the surface. This is illustrated still more strikingly by Figure 6.2, which shows how much steeper the trendline becomes when Scotland and Wales are excluded, and we isolate England (the black line) alone. Indeed, for 1895, the weak correlation of −0·148** we saw in Figure 1 for Britain is boosted to −0·374** for England. And for 1892, a negligible correlation of −0·032 for Britain becomes −0·229** for England. For 1886 and 1900 meanwhile, the coefficients rise from −0·103* and −0·314** respectively in Britain to −0·309** and −0·507** respectively in England.Footnote 57 Also excluding English mining seats has a substantial impact on the correlations as (in most cases) does removing Liberal Unionists and focusing only on Conservatives.Footnote 58
Scatterplots showing relationship between Unionist vote and turnout for all constituencies at elections, 1886–1900, subdivided by constituency categories, with trendlines for best fit.
Scatterplots showing relationship between Unionist vote and turnout for all constituencies in 1892 and 1895, subdivided by country, with trendlines for best fit.
Having established that negative Unionism is rendered much more plausible when we move away from national analyses, we can now investigate how these trends might have played out electorally had turnout been different in 1886, 1892, 1895, and 1900. We can use a simple regression analysis model based on the scatterplot trendlines to help us predict for each election how far changes in the independent variable (turnout) might have affected the dependent variable (Unionist vote share). To increase our confidence in these regression models – indicated by their R-Squared values – we have made two important refinements.Footnote 59 The first, as prefaced above, is to exclude Scotland and Wales and focus only on England. The second is to replace the linear trendlines with curved polynomial trendlines which better fit the scatterplots for each election, and both modifications substantially increase our R-Squared coefficients.Footnote 60
Using the regression formula Y = ax 2 + bx + c, we can thus begin to make predictions. In 1895, if the turnout of 79·6 per cent in England was raised to what it had been in 1885 (82·4 per cent), we can predict that the Unionist's average vote share would have declined by 0·55 percentage points, whereas if it had been 84·3 per cent (the average English turnout outside of the four ‘negative Unionist elections’ – i.e. in 1885, 1906, January and December 1910), it would have declined by 0·85 percentage points. On a uniform swing across England, this would have unseated thirteen MPs in the former scenario and nineteen in the latter. If we repeat these regressions for 1900 (where the English turnout was 76·7 per cent), we find the Unionists decline by an extra 1·14 percentage points on a hypothetical turnout of 82·4 per cent, and 1·53 percentage points for 84·3 per cent, leading to losses of eighteen and twenty-two English seats respectively. While these predicted losses are in themselves notable, their parliamentary impact would of course simply have been to reduce the landslide Unionist victories. Indeed, a similar scenario applies with a regression for 1886.Footnote 61 In 1892, however, despite the correlation being the weakest of our four ‘negative Unionist’ elections, a combination of a close contest and a particularly large number of marginal seats contribute to a much larger potential impact if its English turnout (79·6 per cent) is altered. While we can predict that similar rises would have also led to modest Unionist losses, the picture becomes more interesting when we instead decrease the turnout.Footnote 62 In this case, if the 1892 English turnout was 2·7 percentage points lower at 76·9 per cent (its 1900 level), we can forecast a 1·2 percentage point increase in the Unionist vote, resulting in thirty-two English gains on a uniform swing, and a Commons majority of twenty. While these hypothetical models should naturally not be overplayed, they do predict, in terms of the hard political currency of Commons seats rather than correlation coefficients, that relatively small fluctuations in turnout in England could have a very tangible impact, and in close elections like 1892, potentially even alter the ultimate result.
Overall, our four analyses – of the national aggregates, individual constituencies, regions and social cleavages, and finally regression – demonstrate consistent, although by no means uniform, statistical evidence of an important negative relationship between Unionist vote and turnout during 1886–1900, especially for England. While revisionist historians – and the analyses above – have highlighted important counter-trends relating to the politics of place, it seems hard to argue that the wider statistical picture fails to corroborate Cornford's general thesis that Unionists generally did better when polls were lower in this period. It should be stressed that this is a conclusion of correlation and not of causation, and in itself provides no evidence that Conservative organizers attempted to manipulate registers, keep electorates low, or otherwise suppress turnout. It equally provides no evidence to support the assumption that Unionist rhetoric and appeals in campaigns must have been geared towards these ends, and could not be positive and populist. What it does suggest, however, is a consistent underlying structural bias that suggests that late Victorian Unionist electioneering, regardless of its content or tone, was underpinned by negative psephological foundations.
III
This article's second major analysis concerns the under-researched topic of uncontested seats in this period.Footnote 63 Despite their high number (especially in 1886, 1895, 1900, and December 1910) historians’ psephological analyses have scarcely been more sophisticated than counting them. Clearly, the fact that the Unionists benefited from three times more unopposed returns than the Liberals had in these eight elections (four times more during 1886–1900) is self-evidently a central pillar of the ‘negative’ interpretation.Footnote 64 What we do not know, however, is what kind of constituency was left uncontested. If, as the contemporary commentator Lawrence Lowell supposed, seats were usually not fought because they were considered ‘hopeless’, then the Unionists gained little additional advantage by their opponents’ willingness to stand aside.Footnote 65 If, on the other hand, poor Liberal organization was chiefly responsible, then the Conservatives would only benefit electorally if their opponents were – counter-intuitively – badly organized in constituencies where the Liberal vote was strong. An analysis of the dynamics of the 750 uncontested elections in this period in Great Britain can shed considerable light on how much the parties really conceded when they did not stand, and whether the Liberals bequeathed the Unionists a few crumbs, or something closer to a banquet.
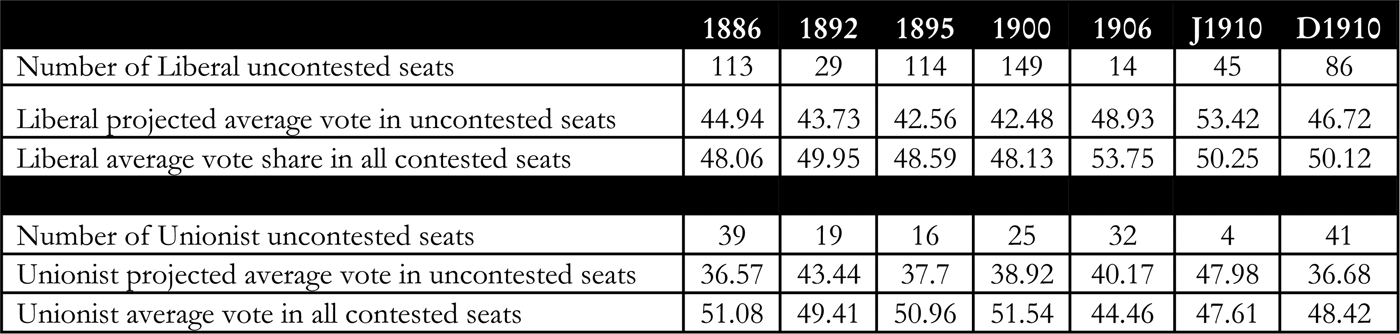
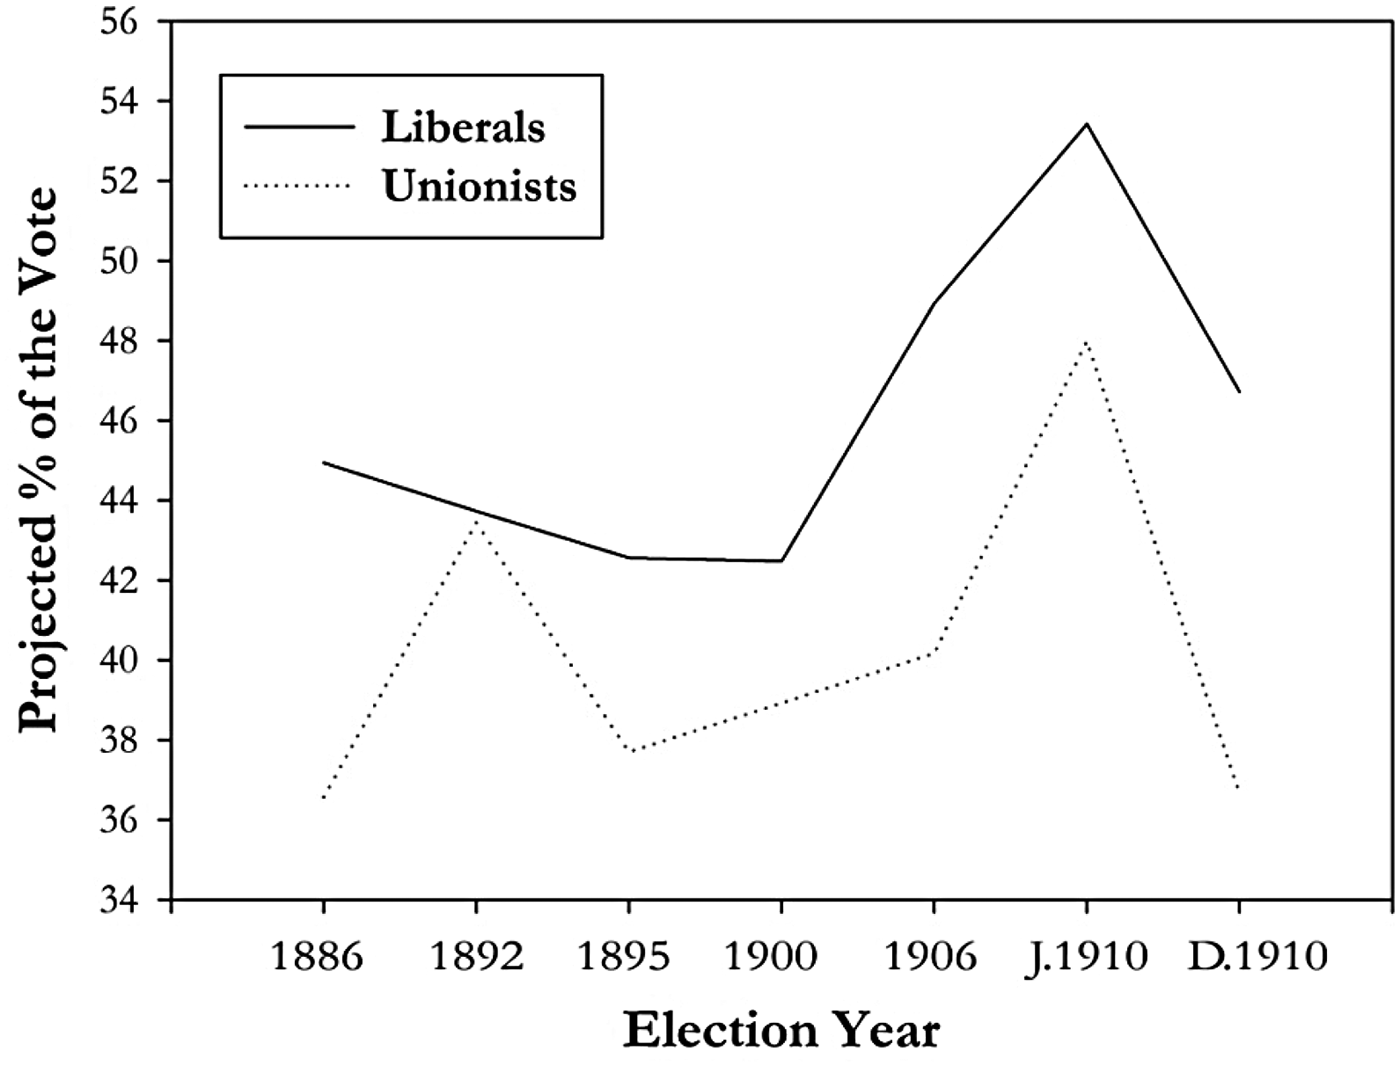
The implicit difficulty in this analysis lies in establishing a method for estimating how well a party would have done in an uncontested seat, had it actually been fought. Our approach was to average the party's vote share across all the instances that the constituency in question was contested in the period (excluding by-elections) giving us an estimate of the general level of support for the party in the division.Footnote 66 There are obvious problems with this method: each uncontested election was a unique event with its own idiosyncrasies, and past and future results inevitably provide only an imperfect indicator of what might have happened. We must thus interpret the aggregate trends which emerge below with due caution. Figures 7.1 and 7.2 below show the average Liberal and Unionist projected vote shares in uncontested seats for each election from 1886, alongside the actual share in contested seats for reference.Footnote 67 This analysis paints a clear picture. With the exception of 1892, Liberal strength in seats that they did not challenge was considerably greater than was Unionist strength in their equivalents. If we take the 550 constituencies left uncontested by the Liberals across these seven elections, their average vote share was 44·8 per cent when they did fight them. If we take the 176 Unionist uncontested seats, their equivalent average vote was just 38·69 per cent: 6·11 percentage points lower. For the 1886–1900 period, there is a slightly smaller gap of 4·6 percentage points (43·28 per cent for the Liberals, 38·69 per cent for the Unionists), but we must take into account the background factor that the average Unionist vote share across the country was 2·25 percentage points higher than their opponents in these four elections. Relative to what we would expect to see, the Liberals are thus a full 6·85 percentage points ahead. Indeed, if we also adjust our forecasts to take into account national party performance in each election, our forecasts remain extremely similar.Footnote 68 In short, the average Liberal uncontested seat wasted considerably more electoral potential than did the average Unionist.
Uncontested seats analysis, Liberals and Unionists, 1886–Dec. 1910.
Projected vote share in uncontested seats by election, 1886–Dec. 1910.

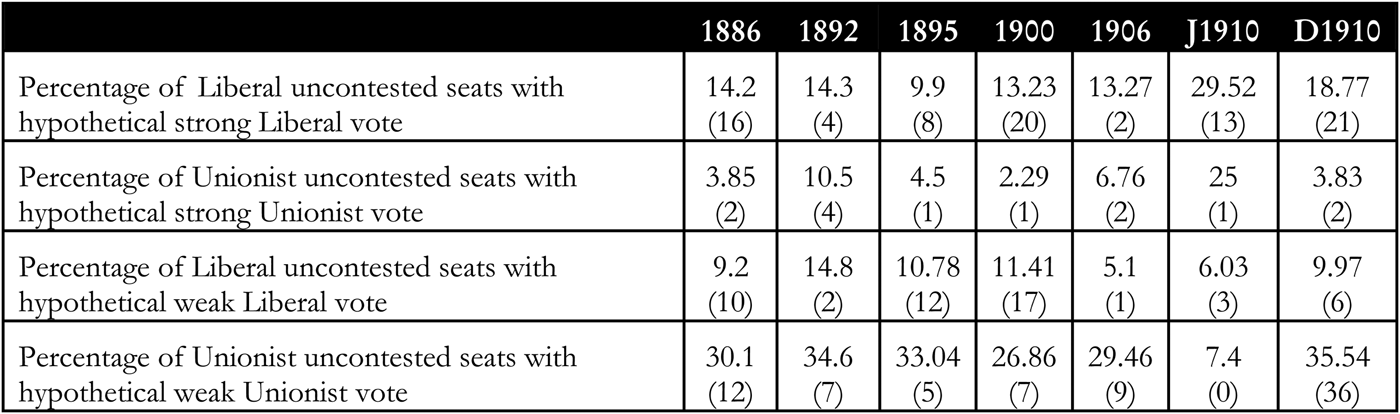
While these averages are enlightening, further analysis is required to estimate how many seats this might have cost the Liberals. To do this, we have counted how many times the uncontested seats saw (at the seven other elections) a ‘strong poll’ (50 per cent + of the vote) versus a ‘weak poll’ (35 per cent or less). The results are displayed in Figure 8 above.Footnote 69 Once again, these results are striking. Liberal uncontested seats were consistently more likely to be ones where party support was stronger, and Unionist uncontested seats ones where they were weaker. In 1886 – where Liberal organization could easily be thrown into a state of confusion by the sudden emergence of Liberal Unionists – an unfought Liberal seat was four times more likely to be strong, and an unfought Unionist seat more than three times as likely to be weak. While the average across the whole period is slightly more favourable than this for the Liberals, the discrepancy is still considerable, with their uncontested seats twice as likely to be strong, and Unionist seats thrice as likely to be weak.Footnote 70 In 1886, 1895, and 1900, the Liberals conceded an estimated forty-four strong seats they most likely would have won, whereas the Unionists relinquished a meagre four. While these figures are not high enough to change the results of any of these elections, the Liberals’ failure to contest constituencies where they were strong inflated the size of the Unionist landslides. However, in the elections of January and December 1910, Figure 8 suggests that the Liberals might well have been considerably closer to a parliamentary majority if they had managed to contest as many seats as they had in 1906.
The clear Unionist advantage – not only in fighting more seats, but in tactically choosing which to fight – can be explained by poor Liberal organization, or a less keenly developed strategic awareness of where to concentrate resources. One of the chief problems for party organizations (both local and national) was the selection of candidates in as many places as possible, something Lord Salisbury described as their ‘paramount duty’.Footnote 71 In 1895, the Annual Register noted that Liberals struggled with ‘want of funds’ and in securing the services of ‘local candidates of sufficient weight or position’ who would support the radical Newcastle Programme.Footnote 72 Manpower was again a problem for Herbert Gladstone in 1900, who wrote that ‘[No] Whip ever ransacked the country for possible candidates as I did. I interviewed hundreds of men. It was a hopeless business.’Footnote 73 However, he also questioned the wisdom of fielding candidates everywhere, asking a party official rhetorically: ‘What profit is there in urging lagging constituencies to expose their mostly unsaleable articles to people who don't want to buy?’Footnote 74 The Liberal failures to contest what seemed winnable seats may thus also have been on account of Gladstone's (and other whips’) defective intelligence on which seats were winnable and which were not, as evidenced by his seemingly inaccurate forecasts of constituency results in 1906.Footnote 75
Percentages of the uncontested seats likely to have been strong (50 per cent + of the vote) and weak (35 per cent or less) by party, 1886–Dec. 1910.
Liberals in the country also voiced opinions on their party's frequent decisions to stand aside. On 15 July 1895, the loyal Liverpool Mercury sought to console readers disturbed by the volume of uncontested Unionist returns by telling them that it was a fact ‘which ought not to be taken too seriously’ because these seats were ‘extremely pronounced in their adherence to Toryism and Liberal Unionism’.Footnote 76 However, such optimism was not typical, and to many Liberals, their party's inability to field candidates was a matter of grave concern. One radical newspaper, also from 1895, lamented that ‘in the opinion of every sturdy Liberal, the enemy were allowed a walk-over in many a borough or division where an apostle of progress would have rendered an excellent account of himself’.Footnote 77 In a by-election of January 1899 – held during a period where the Unionists were deeply unpopular – an exasperated Mid-Buckinghamshire Liberal Association passed a resolution ‘deploring’ the failure to find a candidate and ‘declaring that the unopposed election of a supporter of the worst Administration of modern times and of the weakest Minister ever responsible for the foreign affairs of this country is a great misfortune’.Footnote 78
The way in which Liberal organizers could miss out on winnable prospects is exemplified by the East division of Dorset. The party won it in 1885, lost it narrowly in 1886, and failed to regain it in a November 1891 by-election by just 347 votes. Come the general election in the summer of the following year, no replacement could be found after the established candidate, Pascoe Glyn, announced he was contesting a different seat in January 1892.Footnote 79 Despite six months’ warning, a constituency that would easily have been gained on uniform national swing was left vacant, leaving the Conservative agent to boast that ‘the Unionist organisation in East Dorset was so perfect that no-one dared to come against them’.Footnote 80 Nor was there a contest in 1895, after the man the Liberals had lined up pulled out.Footnote 81 When in 1900 they did manage to fight, they lost by just ninety-six votes against a dire national backdrop – an indication of what could have been achieved in the preceding elections. This story was by no means an aberration. In Nuneaton in 1900, for example, a local newspaper informed its readers that ‘while the constituency is a ripe for a contest, no champion is forthcoming for the Liberal cause’.Footnote 82
That this was often happening in seats that were far from hopeless was much remarked upon. A resident of Chester (a constituency which was comfortably Liberal in 1885 and was lost in 1886 by just sixty-six votes) complained in 1895 that ‘this once great Radical party possessed next to nothing in the shape of organisation, and were also…unable to find a candidate to champion their cause…so much for the Radicalism of Chester!’Footnote 83 In 1900, the Liberals of York faced similar difficulties, leading even the friendly Leeds Mercury to remark: ‘That a party which could once elect two Members for the city should be unable to find a candidate at the present juncture can only be accounted for by excessive timidity or by dissension in its ranks.’Footnote 84 Liberals in such difficulties could not always look to London for assistance, as the secretary of the Liverpool Kirkdale Association discovered in 1900:
He had communicated with Mr Herbert Gladstone…but his reply was not very encouraging. The gist of it was that there must be a number of wealthy residents in a large population like that of Liverpool, and, surely, it was possible to secure a gentleman sufficiently public-spirited to come forward in the interests of the party.Footnote 85
Conservatives, by contrast, had fewer such troubles. The seats that they left unchallenged were likelier to resemble the Morley division of Yorkshire, a ‘hotbed of radicalism’ deemed unsuitable for a contest in 1886.Footnote 86 Writing more generally about the same election, an article in the Westminster Review described Conservative decisions to allow Gladstonians a ‘walkover’ as ‘wise…for the chance of a Tory or Unionist Liberal candidate winning any of these seats was of the remotest type’.Footnote 87 One great strategic advantage possessed by the Conservatives, moreover, was their relationship with the Liberal Unionists. Often there were in effect two party organizations, one waiting to bail out the other should the need arise. So in Bradford Central in 1895, where the Liberal Unionist Association had ‘so far been unable to find a candidate…the duty of securing a candidate has largely devolved upon the Conservative wing of the party’.Footnote 88 The same switch happened in West Aberdeenshire in 1886, where ‘every effort had been made…to get a Liberal Unionist to contest the division…the Unionist Liberal Committee were unable to find a candidate, and advised their friends to support any Unionist candidate’.Footnote 89 When a Conservative was chosen, he took care to emphasize the fact that ‘it was not till the Liberals had failed to secure a Unionist candidate that he consented to come forward’.Footnote 90 The benefits of this relationship were not merely organizational; they enabled Unionist candidates to disassociate themselves from Conservatism where it was unpopular.Footnote 91 For example, in the Spen Valley division in 1886, ‘it was recognized…that a bona fide Conservative's chance of success would be utterly hopeless’. When a Liberal Unionist was found, ‘the Conservatives treated their nominee shamefully. Anxious to disassociate this candidature from their principles…they carried their duplicity to an extremity.’ But despite the deprecation of this Gladstonian newspaper, the sitting Liberal saw his majority reduced by a third.Footnote 92
Of course, in the Edwardian period, the Progressive Alliance between the Liberal and Labour parties presented the opportunity to achieve a similar strategic advantage, and its operation can be seen in an early form in Sunderland in 1900. The Liberals in the city had tried and failed to secure their own champion, and so approached a candidate representing the Labour interest to accept a Liberal nomination.Footnote 93 But the crucial difference was that on the Unionist side, the long-established party organization intervened to mitigate the shortcomings of the younger, weaker partner. But on the progressive side, it seems that the reverse could easily occur. Indeed, even where Liberalism was strong, Labour were often more of a hindrance than a help, and Herbert Gladstone recalled in retrospect that ‘some perfectly safe Liberal seats had to be given to Labour’ to maintain the cordiality of the Progressive Alliance, a fact that helps to explain the large number of strong Liberal constituencies vacated in the Edwardian period.Footnote 94 Indeed, where the alliance broke down – as in Middlesbrough in 1906 – Labour and Liberal candidates and speakers quickly found themselves at loggerheads.Footnote 95 While the Conservatives and Liberal Unionists had their differences, their alliance was clearly the more strategically advantageous.
Overall, this analysis strongly suggests that the Liberals gave away considerably more through leaving seats uncontested than the headline figure of 550 – bad as this was – implies. As well as being plagued by poor organization, especially in the aftermath of the Home Rule schism, they were also hampered by it often being poor in the wrong places, thus surrendering strong seats when they continued to fight hosts of weaker ones. The reverse was true for the Unionists, whose 172 unchallenged constituencies were in fact worth still less to their opponents, as they were much more likely to be in safe Liberal territory. As Rix has argued, a substantial contributor to the transformation of Liberal fortunes in 1906 from 1900 lay simply in being able to field more candidates.Footnote 96 Ironically, the Conservative Saturday Review in October 1891 praised the Gladstonians’ electoral ambition in lining up candidates in the unpromising South Molton and Strand divisions, arguing that ‘they have set an example which Unionists will do well to follow’ and criticized the Tories for ‘too often making the indolent excuse’ of not attacking strong Liberal seats.Footnote 97 Just three years later in 1895, however, things had deteriorated so much that Lord Rosebery remarked that ‘In time of real Liberal enthusiasm, the very stones of the street breed candidates, and when we find 150 Tory seats uncontested we may say, that there is “something rotten in the State of Denmark”.’Footnote 98 Herbert Gladstone felt similarly, recalling in 1928 that ‘if good candidates offer to stand in sufficient numbers to fight all constituencies worth attack, a decisive victory can be anticipated. Only twice have I known…[such] high Liberal expectations – in 1880 and in 1906.’Footnote 99 While these Liberal statesmen probably flattered themselves by overestimating the size of their natural support base, the Conservatives were well aware how much potential their opponents were wasting. In 1895, Balfour's private secretary told him that ‘The Skipper [Captain Middleton] attributes much of our success to the utter unpreparedness of the other side, whose organization, for lack of candidates, had been very much neglected.’Footnote 100
IV
This article has sought to qualify the recent positive Unionism consensus by arguing that important aspects of the success of Unionism and especially Conservatism were built on negative electoral foundations in the 1886–1900 period. This conclusion should not be taken as a challenge to the recent revisionism which has demonstrated that Tory campaigns could be vibrant, populist, and appeal to the working man's independence, patriotism, and masculinity. It also does not support the interpretation that Conservative organizers made any deliberate attempt to ‘avoid rather than confront the mass electorate’.Footnote 101 Indeed, John France has argued persuasively that the development of a ‘liberal-Conservative’ party which could win over whigs and moderates was planned by Salisbury and Northcote since the early 1880s, suggesting that the Tories were ready to fight the democratic battles of post-reform politics as best they could, even though many (especially Salisbury himself) believed they were doomed to lose.Footnote 102 That the party ended up benefiting so markedly from low turnouts, their opponents’ organizational weakness (not least their highly damaging mismanagement of uncontested constituencies) and a reliable nucleus of middle-class seats (often in villadom) was a testimony to the unfolding of events rather than any deliberate plan.
Demonstrating that the Unionists fought positive campaigns, and were no more likely to employ anti-democratic stratagems than their opponents, does not, however, fatally undermine the original structural argument of J. P. Cornford. More a political scientist than a historian, Cornford sought to demonstrate the systemic advantages possessed by Unionists which underpinned their late Victorian hegemony. It was later historians who inferred that Salisburyian and Balfourian Conservatism consciously sought to exploit those advantages through electioneering, and by confounding Liberal attempts to mobilize the supposed progressive majority innate to a predominantly working-class electorate. It is this interpretation of negative Unionism which has rightly been rejected. The other – which emphasizes that Unionist success in late Victorian Britain was often built on negative electoral foundations – should not be.
In recognizing the invaluable contributions to this long-running debate – of one of the foremost electoral sociologists on one hand, and the revisionism of ‘new political histories’ on the other – this article further contends that psephological or other structural analyses need not be viewed as the necessary methodological enemy of even the most avowedly postmodernist study. As Jon Lawrence has argued, both can provide valuable insights from different perspectives, providing they are mindful of their limitations.Footnote 103 In this case, this largely top-down account of the electoral dynamics of Unionism advocates a qualification which should be taken as abetting, not undermining, bottom-up accounts of the language of Unionism.
STATISTICAL APPENDIX
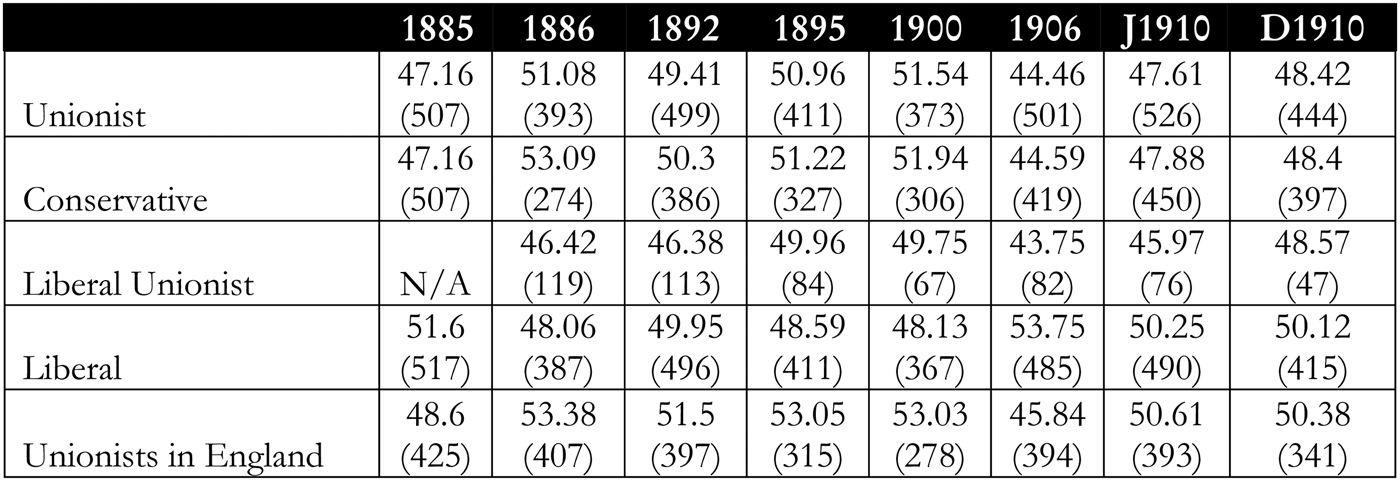
Average party percentage vote share at general elections, 1885–1910. Note : These figures are slightly different from the ‘national’ vote shares presented in F. W. S. Craig or elsewhere.Footnote 104 They are the average percentage poll in constituencies contested by these parties, excluding Ireland and universities. The number of constituencies contested appears in brackets after the percentage. For simplicity, double-member boroughs are counted as one constituency rather than two.
Average party turnout at general elections, 1885–1910. Note : As with Figure 9 above, these are the average turnouts in constituencies contested by these parties.
Average party percentage vote share and turnout, in groups of general elections, 1885–1910. Note : The first column displays the average for all eight elections in this period, and the second two columns are groups of four contests each. The first, the 1886–1900 period, is the supposedly ‘negative’ period of Unionism.