





Impact statement
Opto-chromogenesis (OC) is a scalable strategy to program and design photosynthetic living materials through controlling biological functions such as cell growth and photopigmentation through light projection mapping. We demonstrate that OC allows designing photosynthetic living materials for optimal biomass growth and thereby CO2 capture and oxygen production with heterogeneous graded properties.
It also enables time-efficient studies of the response of living organisms to different lighting conditions in bioprinted microenvironments via its ability to screen many lighting conditions in parallel under closely matched environmental parameters (e.g., shared temperature, cell state, etc). This reduces experimental time, while improving comparability across different lighting conditions.
Introduction
The ability to design and manufacture cell-laden hydrogel constructs with complex geometries via 3D bioprinting techniques has undergone rapid development, especially in biodesign, synthetic biology and tissue engineering (Rodrigo-Navarro et al. Reference Rodrigo-Navarro, Sankaran, Dalby, Del Campo and Salmeron-Sanchez2021). These advances have impacted innovative methodologies and approaches such as optogenetics (Deisseroth Reference Deisseroth2011; Toettcher et al. Reference Toettcher, Voigt, Weiner and Lim2011), morphogenesis (Hogan Reference Hogan1999) and pattern formation (Goryachev and Mallo Reference Goryachev and Mallo2020). While, the applications have been restricted to microenvironments to study different living organisms with chemical and optical stimuli (Finny Reference Finny2024), recent advances showcase the potential application of bioprinting at architectural scale, where novel building skins transform building envelopes to carbon capturing surfaces through embedding photosynthetic living organisms (Cervera et al. Reference Cervera, Villalba and Sánchez2024; Jakubovskis Reference Jakubovskis2025) see e.g. recent work by the start-up company Respyre in integrating moss on building façades (“Respyre” 2026). The present study, undertaken within the European Research Council (ERC) project “Eco-metabolistic architecture,” further contributes to the advancement of designing with living organisms in architecture. Here, materials and building skins become active elements of the building and can capture CO2, produce oxygen and adapt to changing environmental conditions such as light. Among various external stimuli, light stands out as the main driver in photosynthetic living organisms (Ho et al. Reference Ho, Soulier, Canniffe, Shen and Bryant2017; Liu et al. Reference Liu, Gaul, Shu, Vitenson and Wu2022; Ooms et al. Reference Ooms, Dinh, Sargent and Sinton2016). Due to its unparalleled precision, it offers spatial, temporal and quantitative control over biological functions such as photosynthesis or photoinhibition through optically defined stimulation.
One of the major contributors to global CO2 fixation in both marine and freshwater aquatic ecosystems is cyanobacteria (Esteves-Ferreira et al. Reference Esteves-Ferreira, Cavalcanti, Vaz, Alvarenga, Nunes-Nesi and Araújo2017; Field et al. Reference Field, Behrenfeld, Randerson and Falkowski1998). This positions cyanobacteria-laden bioprints as candidates for architectural skins that adapt to changing lighting conditions and act as active agents in CO2 capture. For this study, we select the cyanobacteria F. diplosiphon due to its capacity for CO2 capture and oxygen production, resilience and rapid growth in hydrogel matrices, as well as its ability to acclimate its pigment composition to ambient light spectral quality via a process known as complementary chromatic acclimation (CCA) (Kumar et al. Reference Kumar, Maurya, Mondal, Sinha, Singh, Mishra, Tiwari and Rai2019). The term “complementary” refers to two color states, where the cells adapt their pigment composition to optimize their photosynthetic efficiency. In CCA, the cell adjusts the relative abundance of two phycobiliprotein pigments in its phycobilisomes, phycocyanin (PC, blue-green appearance) and phycoerythrin (PE, red appearance) to maximize absorption of light. Under red-enriched light (e.g. close to the water surface), the cells build PC to absorb red light and appear blue-green and under green-enriched light (e.g. in deeper waters), they accumulate PE to absorb green light and appear red.
Growth of photosynthetic living organisms in natural settings is triggered by a combination of exogenous and endogenous stimuli and spontaneous stochastic events. In the lab environment and architectural applications, it is possible to control and design the spatial distribution of nutrients, cells and light as the main driver of growth of photosynthetic organisms. However, controlling growth and color change in vitro in photosynthetic cell constructs demands specialized toolkits.
In this paper, we develop a projection mapping framework to investigate the relation between light parameters, cell growth and color of F. diplosiphon beyond explorative lighting setups with lower precision. This establishes fundamental knowledge about the relation among light, growth and color, which enables us to control and design complex growth and pigmentation patterns by modulation of light distribution and spectral composition. Projection mapping is a process, in which digital light projectors are used to cast computer generated images directly onto 3D physical surfaces (Iwai Reference Iwai2024). The method allows us to create a tool for spatio-temporal modulation of light intensity and spectral composition, controlling biological growth, migration, proliferation, differentiation and death of photosynthetic living organisms in bioprinted constructs. It enables an initial step in the creation of architectural skins that have heterogeneous properties such as graded translucency, photosynthetic activity and color.
Context and background
In the current state of the art, the use of uniform lighting conditions of varying intensity has offered some control over cell growth and death in bioprinted hydrogels; however, these approaches often lack spatial and temporal definition (Zhang et al. Reference Zhang, Wernig, Duncan, Brüstle and Thomson2001). Further works showcase different techniques for controlling light distribution to regulate biological activity, ranging from 2D to 3D regimes and from microscopic to macroscopic scales.
At microscale, microscope-coupled projector-based platforms are used for e.g. optogenetic studies. Individual cells are typically stimulated locally. Since bacteria within a colony interact with each other and the environment differently to produce population-level patterns, investigating light-driven behavior in detail therefore requires measuring and controlling populations at single-cell resolution. Prior work has, e.g., used light stimuli to probe the bacterium Escherichia coli at both single-cell and population levels (Chait et al. Reference Chait, Ruess, Bergmiller, Tkačik and Guet2017). Local light stimulation has also been applied to studies of single-cell transcriptional dynamics under optical perturbations in Saccharomyces cerevisiae (Rullan et al. Reference Rullan, Benzinger, Schmidt, Milias-Argeitis and Khammash2018). While most studies use localized single wavelength exposure, few studies have enabled more advanced control over light exposure by integrating a Digital Micromirror Device (DMD) (Chakrabarty et al. Reference Chakrabarty, Ono, Kohno, Okamoto, Shibata, Santra and Nagai2025; Zhu et al. Reference Zhu, Fajardo, Shum, Zhang Schärer and Friedrich2012), which is typically used in Digital Light Processing (DLP) projectors (Dudley et al. Reference Dudley, Duncan, Slaughter and Urey2003), in the optical setup. Some of the developed methods based on this technology include: (i) adaptive tracking illumination (ATI) for precise manipulation of the bacterial behavior of Pseudomonas aeruginosa (Xia et al. Reference Xia, Zhang, Huang, Ni, Pu, Li, Yang and Jin2022) and (ii) microlithographic formation of an E. coli, by turning a lawn of bacteria to function as a biological film, such that the projection of a pattern of light on the bacteria produces a high definition two-dimensional chemical image (Levskaya et al. Reference Levskaya, Chevalier, Tabor, Simpson, Lavery, Levy, Davidson, Scouras, Ellington, Marcotte and Voigt2005). Light intervention was also used for local photoactivation and photobleaching in myocytes, i.e., contractile muscle cells (Shkryl et al. Reference Shkryl, Maxwell and Blatter2012), and for creating light intensity gradients for growth in a 96-well plate for soft bone tissue (Liu et al. Reference Liu, Gaul, Shu, Vitenson and Wu2022). A light intensity gradient was also used to study the role of phototaxis in photoprotection of epipelic diatom (Morelle et al. Reference Morelle, Bastos, Frankenbach, Frommlet, Campbell, Lavaud and Serôdio2024).
At macroscale, projection mapping of light is rarely applied for modulating biological growth. Projection mapping itself is a mature technique with well-established application in interactive displays (Iwai Reference Iwai2024) and image guided surgery, where overlays of projected computed tomography (CT) scans and magnetic resonance imaging (MRI) support precise surgery (Nishino et al. Reference Nishino, Hatano, Seo, Nitta, Saito, Nakamura, Hattori, Takatani, Fuji, Taura and Uemoto2018). Recent advances include dynamic projection onto deforming objects (Ibrahim et al. Reference Ibrahim, Gopi, Majumder, Bruder, Olivier, Cunningham, Peng, Grubert and Williams2023) and multi projector setups for shadow removal (Kurth et al. Reference Kurth, Lange, Siegl, Stamminger and Bauer2018). Despite this maturity in visualization contexts, biological applications remain rare. A notable example is using fluctuating light frequencies on 384 microplates to study the growth responses of Synechococcus elongatus and Chlamydomonas reinhardtii to changing environmental lighting conditions (Graham et al. Reference Graham, Nguyen, Burdyny and Sinton2017). This enabled screening of many light conditions at once, which would be impossible with traditional uniform illumination. Arnardottir et al in 2022 also tested optogenetics on their microbial 3D printer using genetically engineered E. coli in combination with microlithography to control its pigment, albeit at a larger scale.
In this study, we demonstrate how 3D bioprinting can be used in combination with projection mapping to design and construct living materials with different growth and color patterns, an area which remains largely unexplored in the state of the art.
Methods
Light is the central design tool in this study to regulate the growth and activity of the photosynthetic cyanobacterium F. diplosiphon via changes in light intensity and spectral composition. Here we use light as the main variable across all the experiments, not only because of its spatiotemporal precision, but also of its ability to quantitatively modulate biological functions through optical stimulation. It ties light parameters such as wavelength and intensity to the photosynthetic efficiency, growth and color as design parameters. Color, in other words, becomes a noninvasive indicator of the light received across a bioprinted construct’s geometry, while photosynthetic efficiency becomes an indicator of CO2 capture efficiency.
To investigate this, we first determined optimal growth conditions and how to trigger CCA in our cyanobacteria in our initial exploratory experiments. Subsequently, we explored design with light-driven biological functions, i.e., photoactivation, photoinhibition and CCA, using projection mapping.
Materials and fabrication
Cyanobacterial strains
Two strains of the cyanobacterium F. diplosiphon were used: UTEX B590 as the reference strain throughout, and UTEX B481 introduced in the projection mapping experiment to test whether the developed method generalizes across strains of the same species. Both strains exhibit CCA (Bennett and Bogorad, Reference Bennett and Bogorad1973; Gutu and Kehoe Reference Gutu and Kehoe2012; Pattanaik et al. Reference Pattanaik, Whitaker and Montgomery2012) but differ in their baseline pigment composition, providing two distinct chromatic responses because of their difference in the relative abundance of PC (Blue-green appearance) and PE (Red appearance) under specific wavelengths and intensity of light. Cultures were maintained in a 2L glass bioreactor in BG-11 medium (Sigma-Aldrich C3061, cyanobacteria freshwater solution) under a 12:12h light:dark cycle at photon irradiance (400–700 nm) of 20 µmol photons m−2 s−1 at 23°C (a full cultivation protocol is provided in supplementary section S1.1).
Bioink and bioprinting
The bioink was prepared from 1.5% weight/volume (w/v) sodium alginate and 18%(w/v) cellulose nanocrystals in Milli-Q water (supplementary section S1.2). F. diplosiphon cultures were harvested 48 hours after supplementation of the bioreactor medium with BG-11. Culture samples were centrifuged (5000 rpm, 2 min), resuspended in fresh 50x BG-11 to a starting OD750 = 1.5 (supplementary section 1.3 and Fig S1.1 and Fig S1.2), as measured on a spectrophotometer (Genesys 40), and were then mixed with the bioink at 25% (w/v). Constructs were printed on an extrusion bioprinter (Cellink Bio-X; supplementary section S1.4) via pneumatic printing and were then immersed in 2%(w/v) calcium chloride for 15 min to undergo ionic crosslinking. Subsequently, crosslinked constructs were immersed in autoclaved tap water inside a Petri dish to rinse off residual calcium chloride. The BG-11 nutrients required for cellular metabolism were supplied from within the hydrogel itself; while the surrounding water only serves to maintain hydration.
Common experimental conditions
All experiments were conducted at 23°C in a temperature-controlled room. All test samples were exposed to a 12:12 day:night cycle for growth, and each condition was run with a minimum of three biological replicates per geometry, across multiple geometries per experiment, to test reproducibility. The amount of nutrients in the bioink mixture was kept constant across all the experiments.
Illumination and projection mapping
Light sources
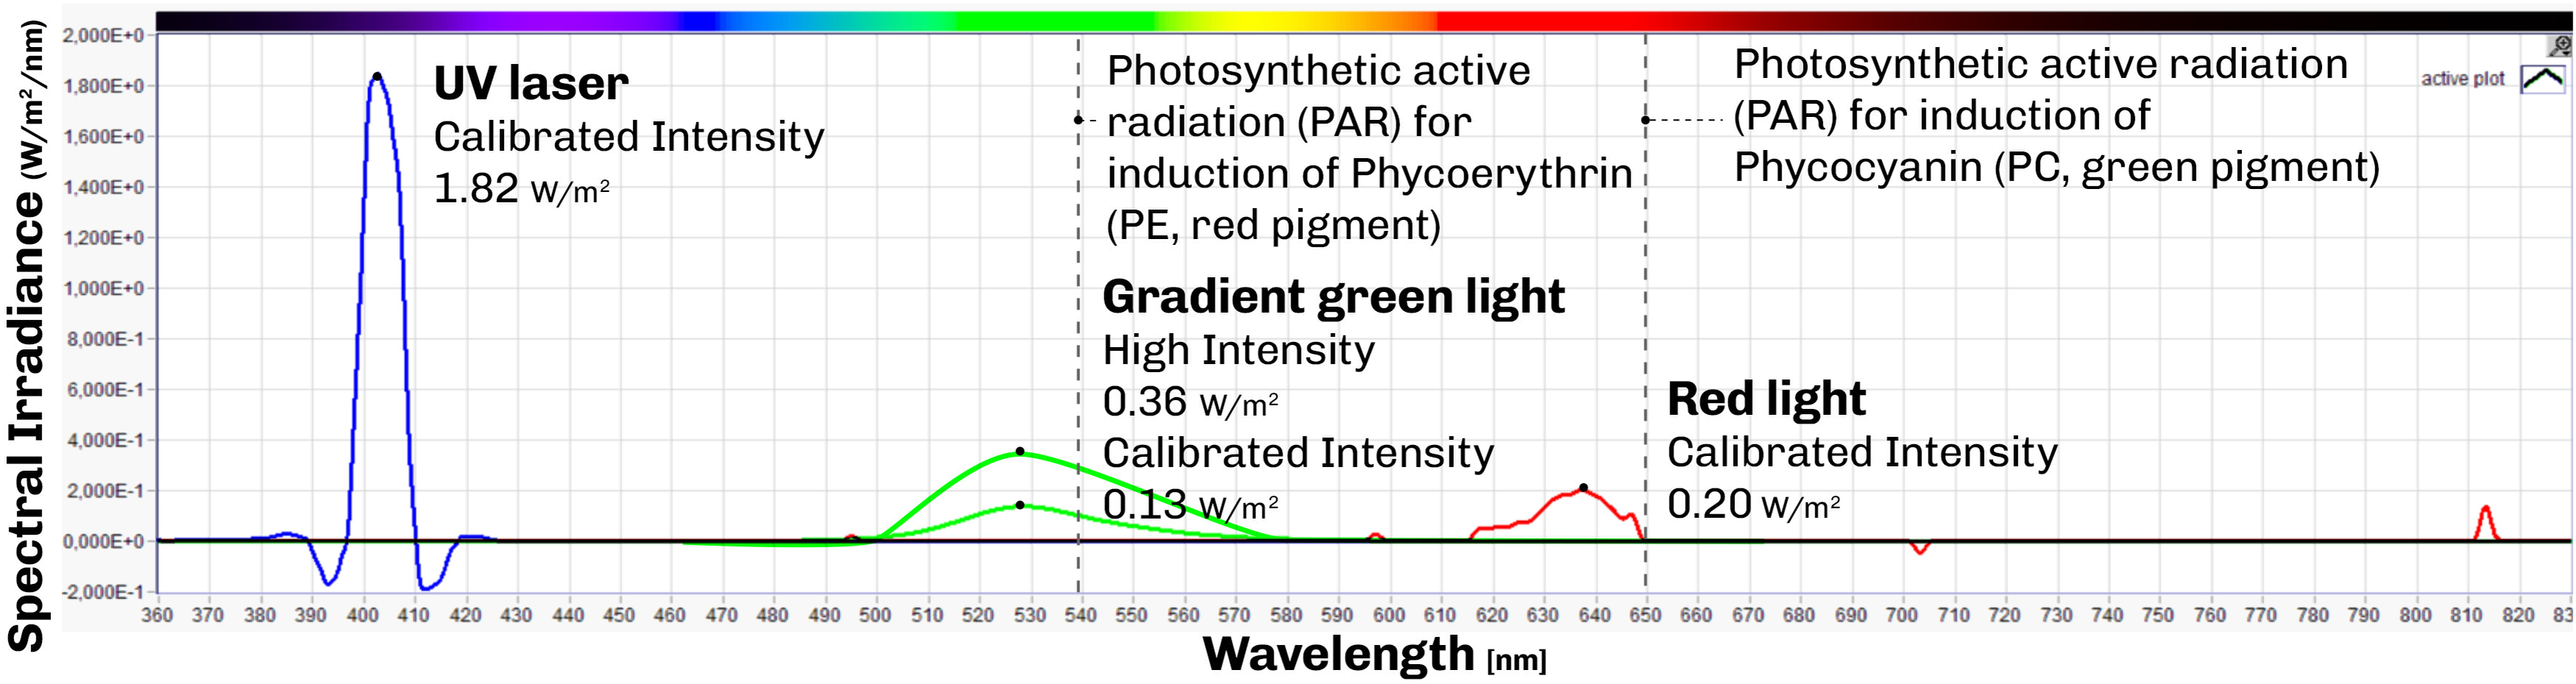
Four types of light source were used across experiments: 1. Uniform green (peak wavelength of 519.4 nm) and red (peak wavelength of 637.4 nm) LED light for baseline growth and CCA experiments with a green light calibrated irradiance of 0.13 W m−2 nm−1 (24.22 µmol photons m−2 s−1) and red light calibrated irradiance of 0.20 W m−2 nm−1 (20.00 µmol photons m−2 s−1) as shown in Figure 1 red and green lines; 2. Green LED light (peak wavelength of 519.4 nm) with gradient light intensity for photoactivation 0.13–0.36 W m−2 nm−1 (3–67 µmol photons m−2 s−1) as shown in Figure 1 green lines; 3. A 405 nm UV laser (peak wavelength of 402.1 nm) for localized photoinhibition with an irradiance of 1.82 W m−2 nm−1 (46.18 µmol photons m−2 s−1); 4. A DLP projector (Optoma HD28DSE) for spatially structured illumination in the projection mapping experiments, which is explained in more detail in the next section.
Spectral irradiance values of light sources in the first three explorative experiments: Green light (peak wavelength of 519.4 nm) with high irradiance of 0.36 W m−2 nm−1 and calibrated peak irradiance of 0.13 W m−2 nm−1, red light (peak wavelength of 637.4 nm) with a calibrated peak of 0.20 W m−2 nm−1, and a UV laser (peak wavelength of 402.1 nm) with a peak irradiance of 1.82 W m−2 nm−1.

Figure 1 Long description
Line plot of spectral irradiance (vertical axis, W m⁻² nm⁻¹) against wavelength (horizontal axis, nm) for the three light sources used in the first three exploratory experiments on the cyanobacterium Fremyella diplosiphon. Green light peaks at about 519 nm, with a high irradiance of 0.36 and a calibrated peak of 0.13; red light peaks at about 637 nm, with a calibrated peak of 0.20; and the UV laser peaks at about 402 nm, with a peak irradiance of 1.82. All values in W m⁻² nm⁻¹.
Projection mapping system setup
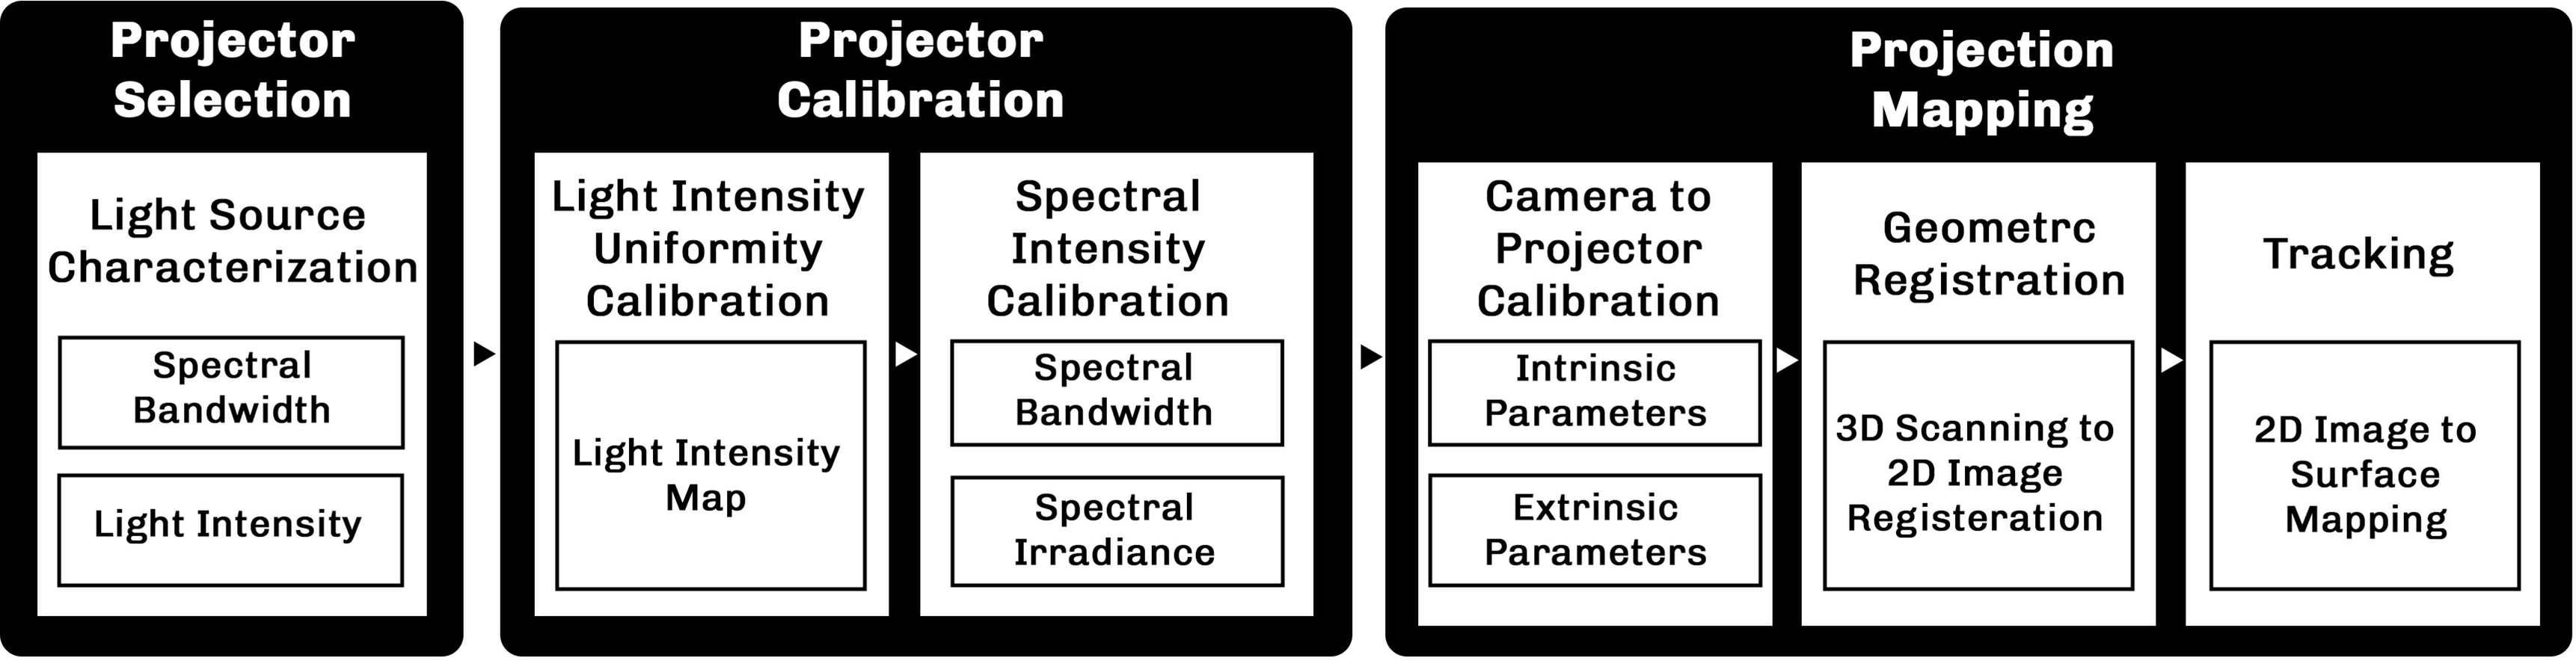
To implement projection mapping, the projector and calibration setup must meet specific requirements: high image resolution to illuminate specific areas of the 3D prints, frame-rate stability for continuous illumination and narrow spectral bandwidth in each color channel with precise spectral irradiance control in order to ensure targeted reaction of the cyanobacteria. The full projection mapping workflow used in this study, from projector characterization to calibration and mapping is shown in Figure 2.
The workflow of using a projector for biological applications through projection mapping. The workflow displays how initially the projector light source needs to be analyzed and calibrated to reach a uniform light within the spectral irradiance needed for biological applications and the projection mapping process to calibrate the camera system with projector to register the physical model with 2D image and track it.

Figure 2 Long description
Pipeline for projection mapping in biological applications. The workflow comprises three stages. (1) Light source characterization: the projector is selected based on light source intensity and the spectral bandwidth required to trigger the target biological functions. (2) Projector calibration: light intensity uniformity is first calibrated across the projected footprint, followed by calibration of the specific spectral bandwidth and intensity needed for the desired biological function. (3) Projection mapping: camera-to-projector calibration yields the intrinsic and extrinsic parameters for 3D scanning; the 3D model is then converted to a 2D image via geometric registration and projected onto the bioprint during tracking.
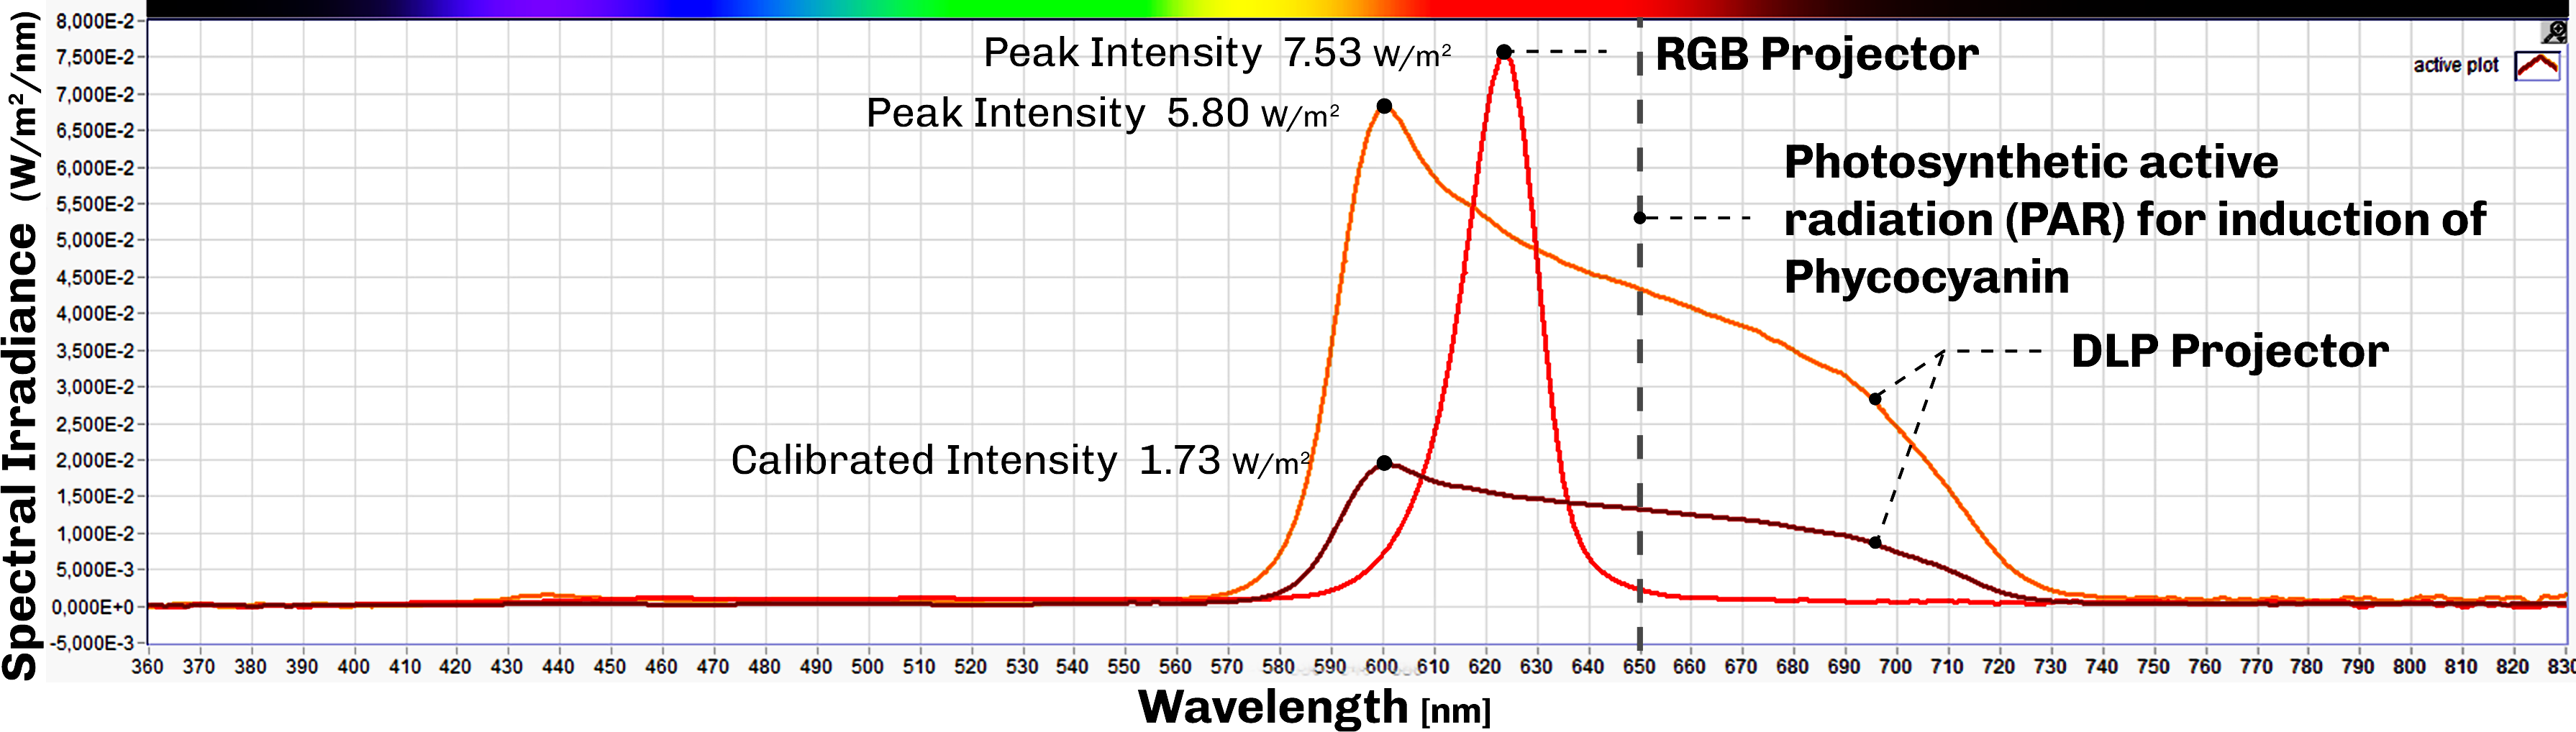
In general, projectors are divided into three main categories: digital light processing (DLP), RGB and 3LCD projectors, based on their light distribution mechanism. Given the nature of experiments, any of the three can be used for biological applications. We compared two projectors available in our facility using a calibrated spectrophotometer (BTS256-EF, Gigahertz-Optik): the RGB projector embedded in the Zivid M70 3D scanner and a standalone DLP projector (Optoma HD28DSE). The RGB projector showed a much narrower red channel bandwidth than the DLP projector (Figure 3), which would be advantageous for spectrally selective applications. However, we selected the DLP projector for the experiments, because it is equipped with active cooling, which supports the multi-day continuous exposures required for biological response, whereas the Zivid scanner is designed only for short, structured light captures during 3D scanning.
Spectral irradiance based on wavelength of light measured by spectrophotometer BTS256-EF of Gigahertz-Optik on RGB and DLP projector while projecting red color. The RGB projector shows a much narrower spectral bandwidth (peak wavelength of 623.7 nm) than the DLP projector (peak wavelength of 600.3 nm) in projecting red color. The irradiance of the red light is calibrated via controlling the exposure of the image.

Figure 3 Long description
Spectral irradiance of an RGB and a DLP projector projecting the same red colour. It shows that the DLP projector covers a wide spectrum while the RGB projector covers a much narrower spectral bandwidth (peak at about 624 nm for the RGB projector versus about 600 nm for the DLP projector).
Projection calibration
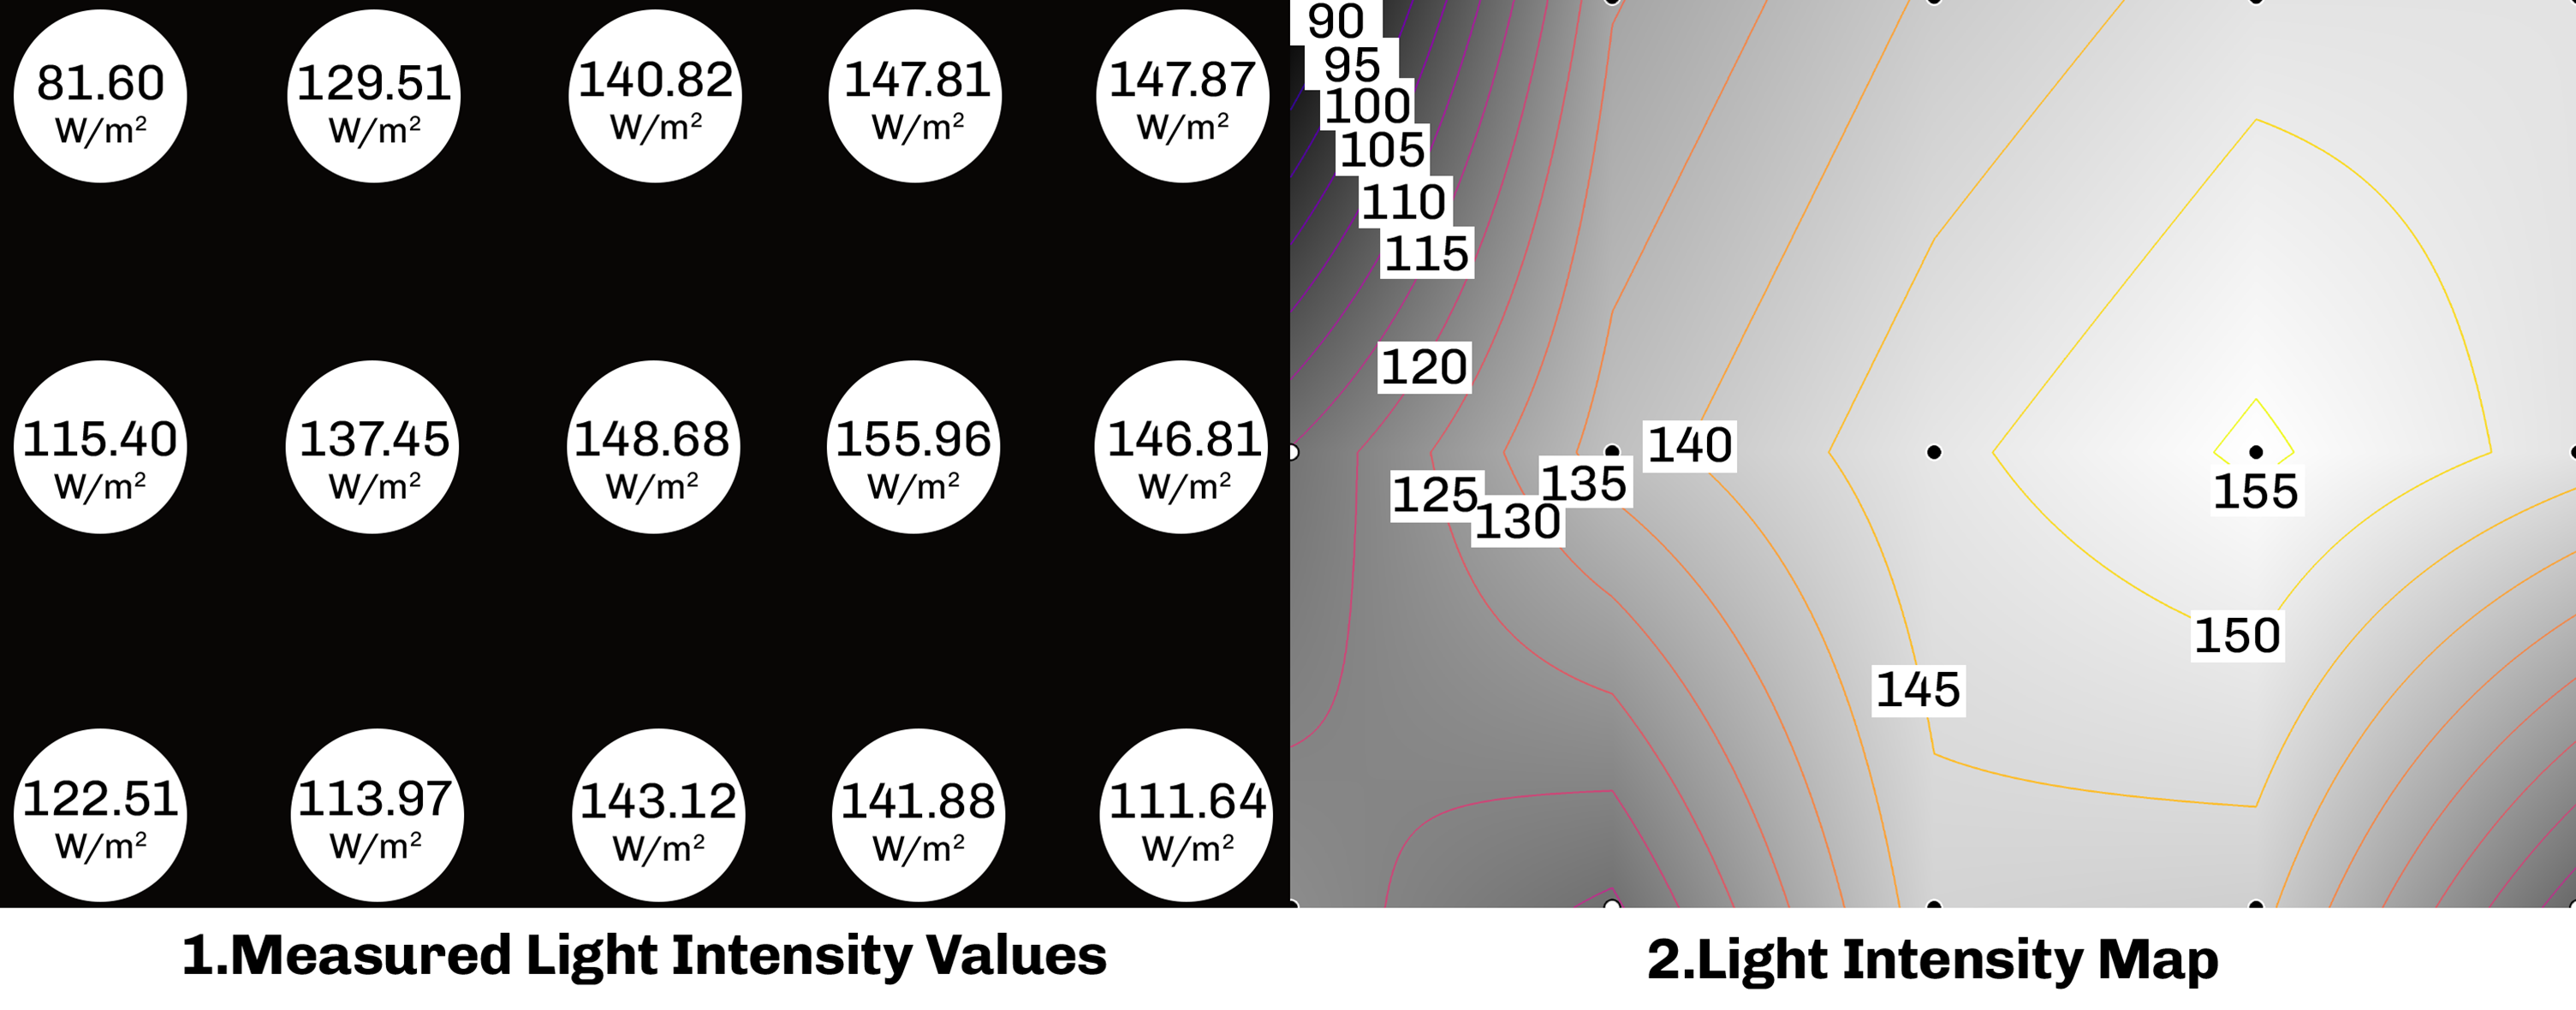
After projector selection, calibration is performed for both intensity uniformity and geometric alignment. The projector is held at a fixed position and distance to keep the intensity of light constant. To maximize the spatial resolution, we minimize the projected footprint (the area covered on the surface) using projector lens adjustment. Light intensity uniformity across the projection footprint is then assessed by measuring spectral irradiance at multiple locations across the field using a calibrated spectrophotometer (BTS256-EF, Gigahertz-Optik) (Figure 4.1). The resulting intensity map is used to correct intrinsic non-uniformities across the projection frame (Figure 4.2). Finally, the spectral intensity of projected light is tuned to the desired spectral irradiance values by adjusting the exposure of the projected image to darken or brighten specific spectral channels (Figure 3).
Light Uniformity calibration: 1. Irradiance measurements across projection footprint 2. Light intensity map displays the intrinsic irradiance changes across the projection footprint, the isolines separate the projection footprint into regions based on their irradiance values.

Figure 4 Long description
Light uniformity calibration for the DLP projector used in the experiments. (1) A grid of light intensity measurements across the projector footprint, taken with a spectrophotometer. (2) A light intensity map showing the intrinsic light intensity variation across the projection footprint; the inverse of this map is used to calibrate light intensity uniformity across the footprint. The isolines separate the projection footprint into regions based on their irradiance values
Projection mapping
Projection mapping can be applied to geometrically complex surfaces with varying light intensity and spectral composition; however, it requires accurate alignment of the projected image with the target surface geometry. While this alignment is often performed manually and thus requires human intervention, it can be automated by integrating a camera or a 3D scanner to transform the image so that it conforms to the target surface. In this study, we developed a low-latency automated projection mapping method for controlling growth and color change in the bioprinted constructs. The method includes a tracking approach that applies an automatic depth map color gradient to the bioprinted construct using the Zivid M70 3D scanner. The algorithm for projection mapping, tracking and controlling conventional projectors for day:night cycle can be found here: https://github.com/CITA-cph/ProjectionMapping.git https://github.com/CITA-cph/ProjectionMapping.git. We provide a video clip (see supplementary section 3) demonstrating the automated tracking and depth map projection mapping of a 3D printed sample. Although the proposed system relies on 3D scanning for automated alignment, projection can also be performed using conventional projectors, for projection of light patterns onto samples using manual image alignment.
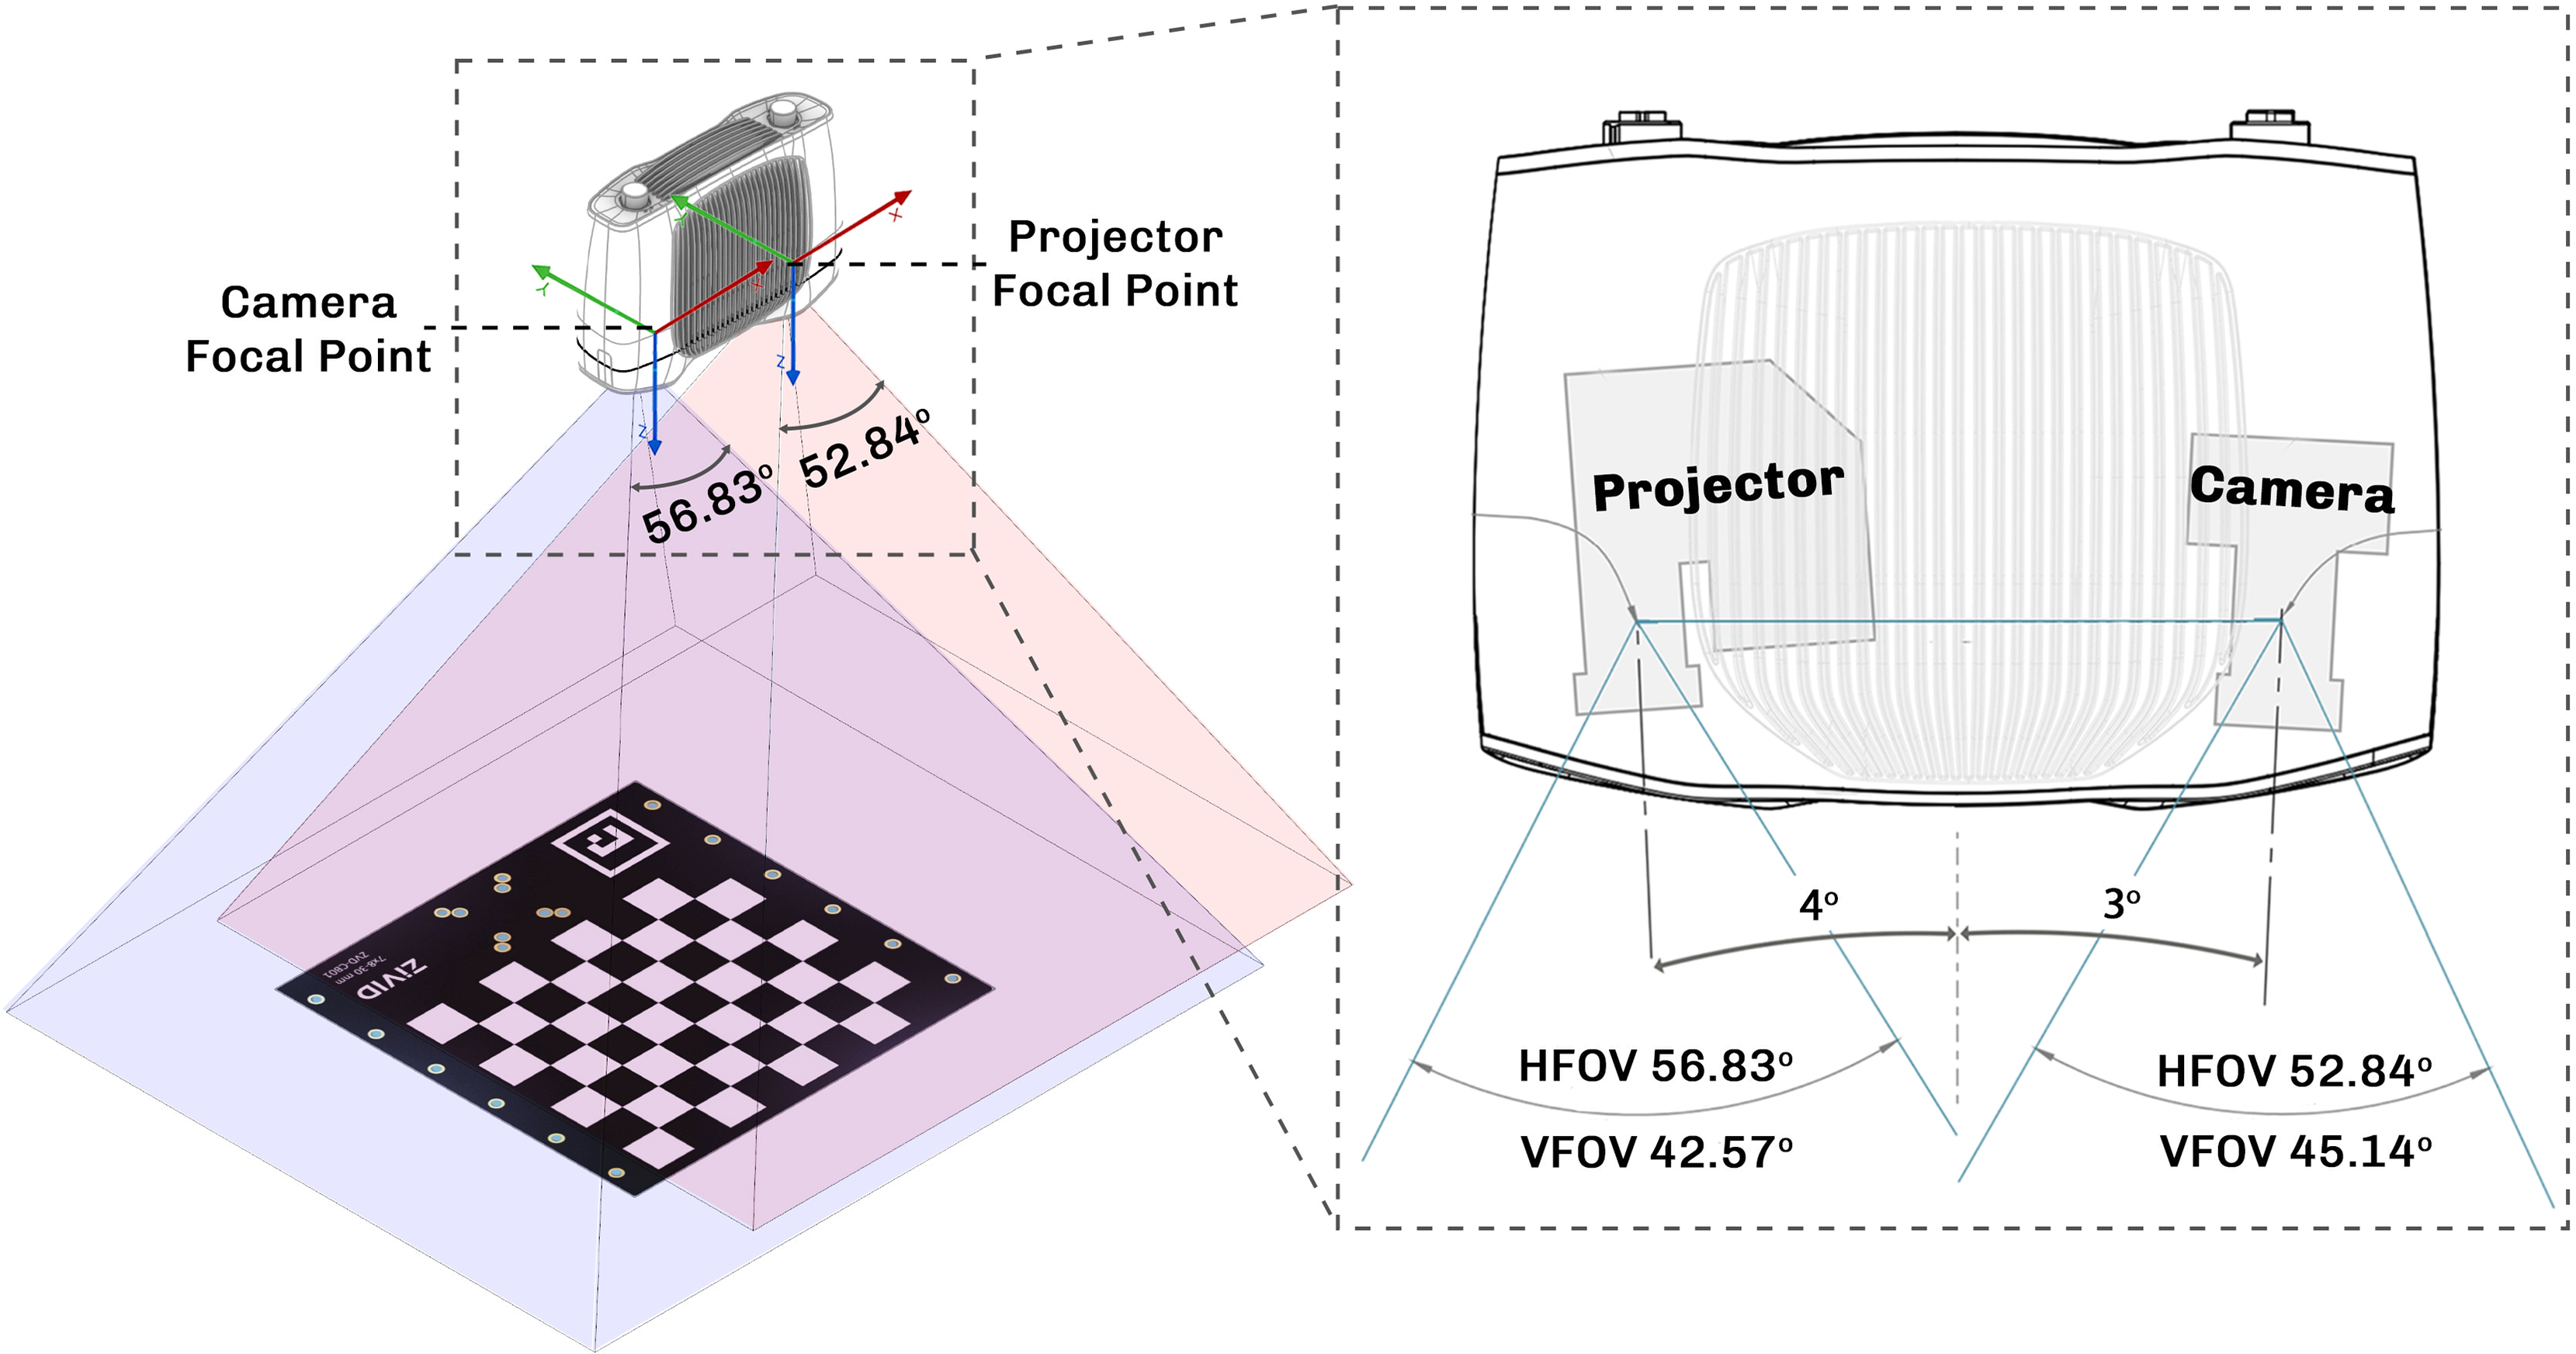
To implement projection mapping for controlling growth and CCA, we used a structured light-based 3Dscanner system (M70 Zivid 3Dscanner) consisting of a camera and a projector (Figure 5). Since the camera is mounted in a fixed bracket relative to the projector, once the camera to projector calibration is performed, the values can be reused to create fast 3Dscan to image projection mapping. After the 3Dscanner captures a 3Dscan and produces a colored point cloud from a physical sample, the data needs to be processed through different stages such as geometric registration and radiometric compensation. Geometric registration of the projector light field over the sample surface is required to enable projection mapping by determining which projector pixel illuminates which surface points. The geometric relationship between the two-dimensional (2D) coordinate value of a projector pixel (x,y) and three-dimensional (3D) coordinate value of corresponding surface points (x,y,z) is mathematically described using a pinhole camera model (Equation 1) as:
 $${\left[ {\matrix{ x \cr y \cr 1 \cr } } \right]^t} = PM{\left[ {\matrix{ x \cr y \cr z \cr 1 \cr } } \right]^t}$$
where P and M are 3 × 4 and 4 × 4 matrices, respectively. This model comprises the projector’s intrinsic parameters such as its focal length in P, and the extrinsic parameters that determine the pose of the projectors relative to the target surface in M. In static projection mapping setups, i.e., with a fixed camera to projector setup, the standard method involves using a camera to capture projected calibration patterns such as checkerboard patterns to calculate the calibration parameters P and M. In this study, we established a camera to projector calibration method using Python programming and OpenCV Python library. Radiometric compensation is not calculated in this study as the projected colors on the surface are not the real colors of the object but rather results of false color patterns designed for controlling growth and CCA.
Projection mapping calibration process. Left: the camera captures the projected pattern to compute calibration parameters for converting 3D values to images for projection. Right: Zivid M70 camera to projector angle and field of view.

Figure 5 Long description
Camera-to-projector calibration, in which the camera captures images of a pattern projected by the projector. The camera-to-projector position is fixed during calibration. The right-hand image shows the fixed position of the camera relative to the projector and their overlapping field of view in the Zivid 3D scanner.
The tracking method extends projection mapping to moving objects. This method can be used to increase the accuracy of projection mapping on bioprinted construct, as the overall geometry of the bioprinted sample slightly deforms and swells over time inside water. The tracking method works through projecting e.g., a depth map via defining a reference plane from the initial 3Dscan of a flat platform without any object in the field of view. This reference plane is then used to measure depth and project depth map color gradient over the bioprinted constructs.
Monitoring
Variable chlorophyll fluorescence imaging
Variable chlorophyll fluorometry was conducted using an imaging system (Imaging-PAM-M-series; Heinz Walz GmbH, Effeltrich, Germany), equipped with an IMAG-K6 camera and Cosmicar-Pentax objective (F1.4/25 mm) to capture a 24 × 32 mm sample area. The device was mounted with red LEDs (655 nm) for fluorescence excitation and actinic illumination. The measurements were performed with the following settings: Measuring intensity of 1, frequency 1, damping 2 and gain 2. After dark adaptation of at least 15 minutes, both minimal (F0) and maximal fluorescence yield (Fm) were measured for every sample. Images of the maximum quantum efficiency of photosystem II (PSII) were calculated from the ratio of fluorescence yield (Fm−F0)/Fm, using the system software (IMAGINGWIN, Heinz Walz GmbH, Effeltrich, Germany).
Experiments
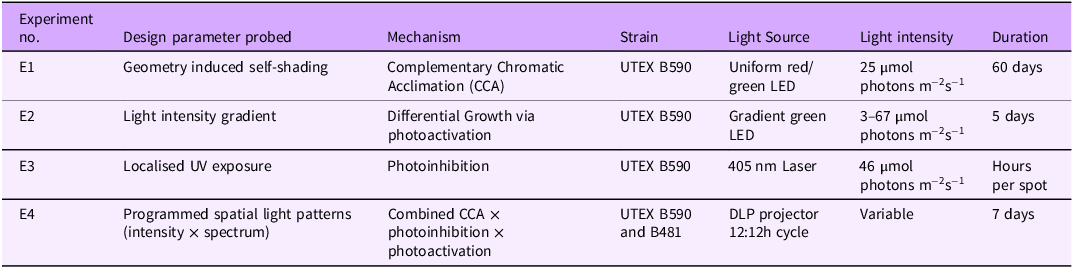
We conducted four experiments (with increasing complexity of the lighting conditions) to map how spatially structured light controls the growth and color of F. diplosiphon in bioprinted constructs (Table 1).
Summary of experiments performed. E1–E3 establish the response of F. diplosiphon to single light parameters under controlled conditions; E4 integrates these responses into the projection mapping framework and tests generalization across strains

Table 1 Long description
Table summarizing the four experiments. Columns: experiment number, design parameter probed, mechanism, cyanobacterial strain, light source, light intensity, and duration. E1 probes geometry-induced self-shading via Complementary Chromatic Acclimation (CCA) in strain UTEX B590 under uniform red/green LED light at 25 µmol photons m⁻² s⁻¹ for 60 days. E2 probes a light-intensity gradient driving differential growth via photoactivation in UTEX B590 under a gradient green LED at 3–67 µmol photons m⁻² s⁻¹ for 5 days. E3 probes localised UV exposure causing photoinhibition in UTEX B590 under a 405 nm laser at 46 µmol photons m⁻² s⁻¹ for hours per spot. E4 applies programmed spatial light patterns (intensity × spectrum) combining CCA, photoinhibition, and photoactivation in strains UTEX B590 and B481 under a DLP projector on a 12:12 h cycle at variable intensity for 7 days.
E1 - Complementary chromatic acclimation (CCA)
Light setup
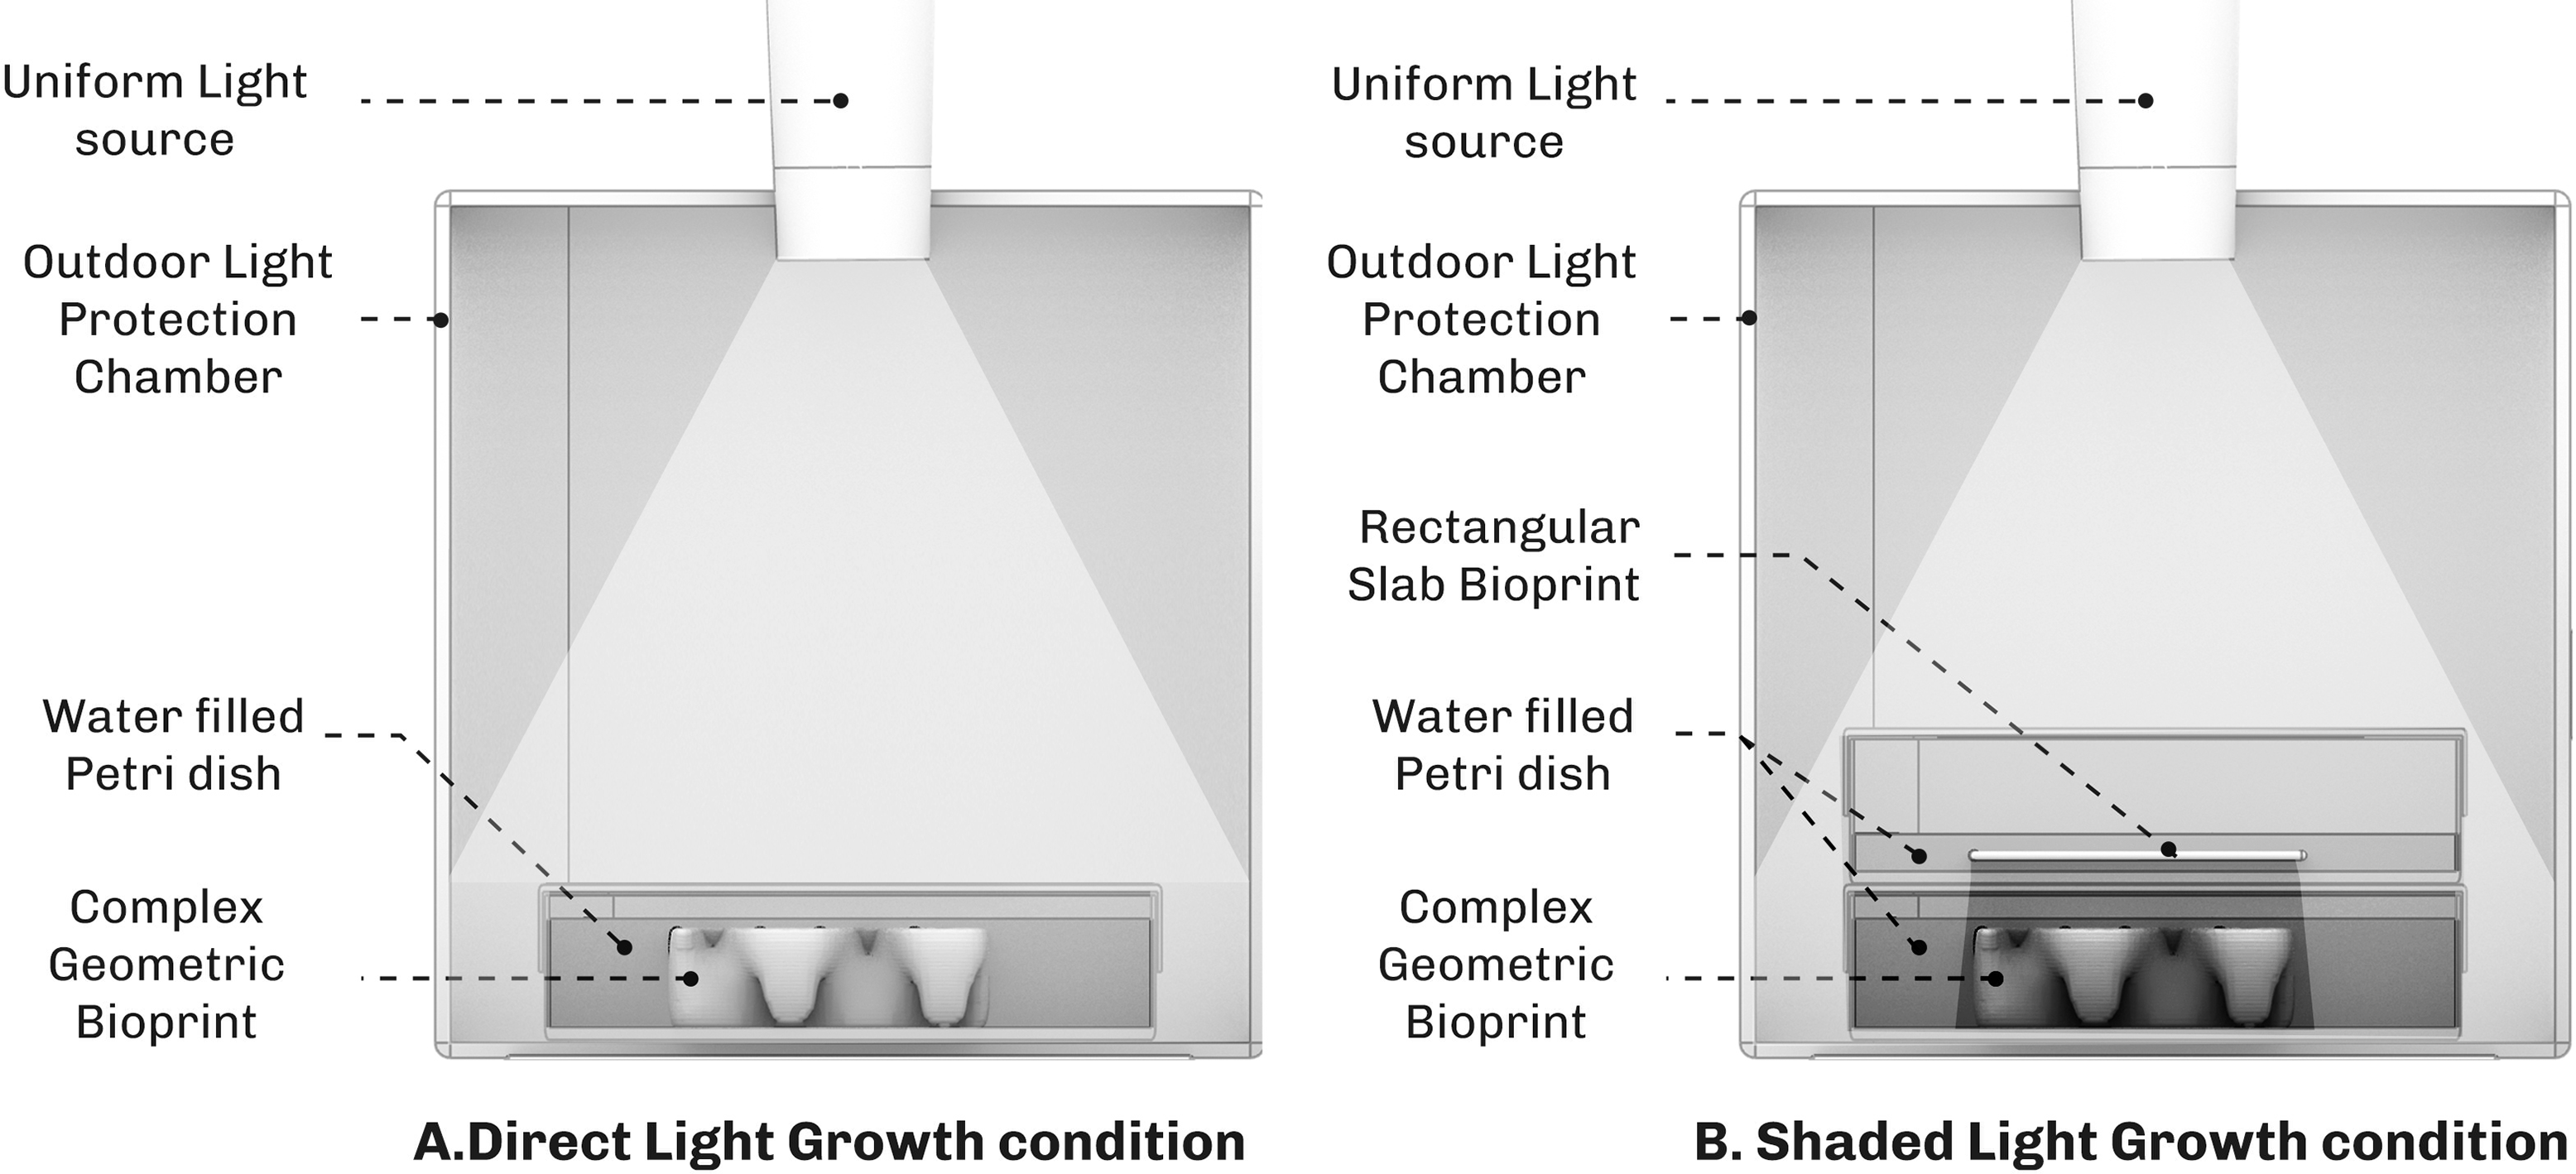
We investigated whether geometry-induced self-shading drives spatial CCA in F. diplosiphon (UTEX B590). Constructs were printed at OD750 = 1.5 and placed inside a 3D printed chamber that isolated samples from ambient room light and delivered controlled illumination (Figure 6A) for 60 days. Two illumination regimes were tested: 1. Uniform direct illumination on geometrically complex constructs that induce internal self-shading and 2. Uniform illumination through the shadow of a separate 1 mm bioprinted slab acting as a shading filter (Figure 6B). Each regime was run under red light in the initial test, followed by reproducibility testing under both red and green light conditions to explore whether light intensity (shade) or spectral composition (light color) triggers the response. Constructs were maintained at 23°C with hydration, nutrient composition, incubation chamber and sample preparation held constant; only the illumination regime varied between conditions. The experiment was repeated to test reproducibility (see Reproducibility section). Our experiments showed that nutrients inside the hydrogel are depleted after 7–9 days, where after cells started to turn whitish in the hydrogel. To keep the cells alive, 1x BG-11 solution was added on a weekly basis only in this experiment.
A. Direct lighting condition for growth of F. diplosiphon (UTEX B590) inside a 3D printed chamber that protects the bioprinted construct from ambient room light. B. Shaded light condition to trigger Complementary Chromatic Acclimation (CCA) in the bioprinted construct, by putting it under the shadow of a rectangular bioprinted slab. The bioprinted construct is placed inside the 3D printed chamber to protect it from ambient room light. The test was done under red light and repeated under green light with no filter; however, both light sources showed similar results with the F. diplosiphon changing color from green to red.

Results
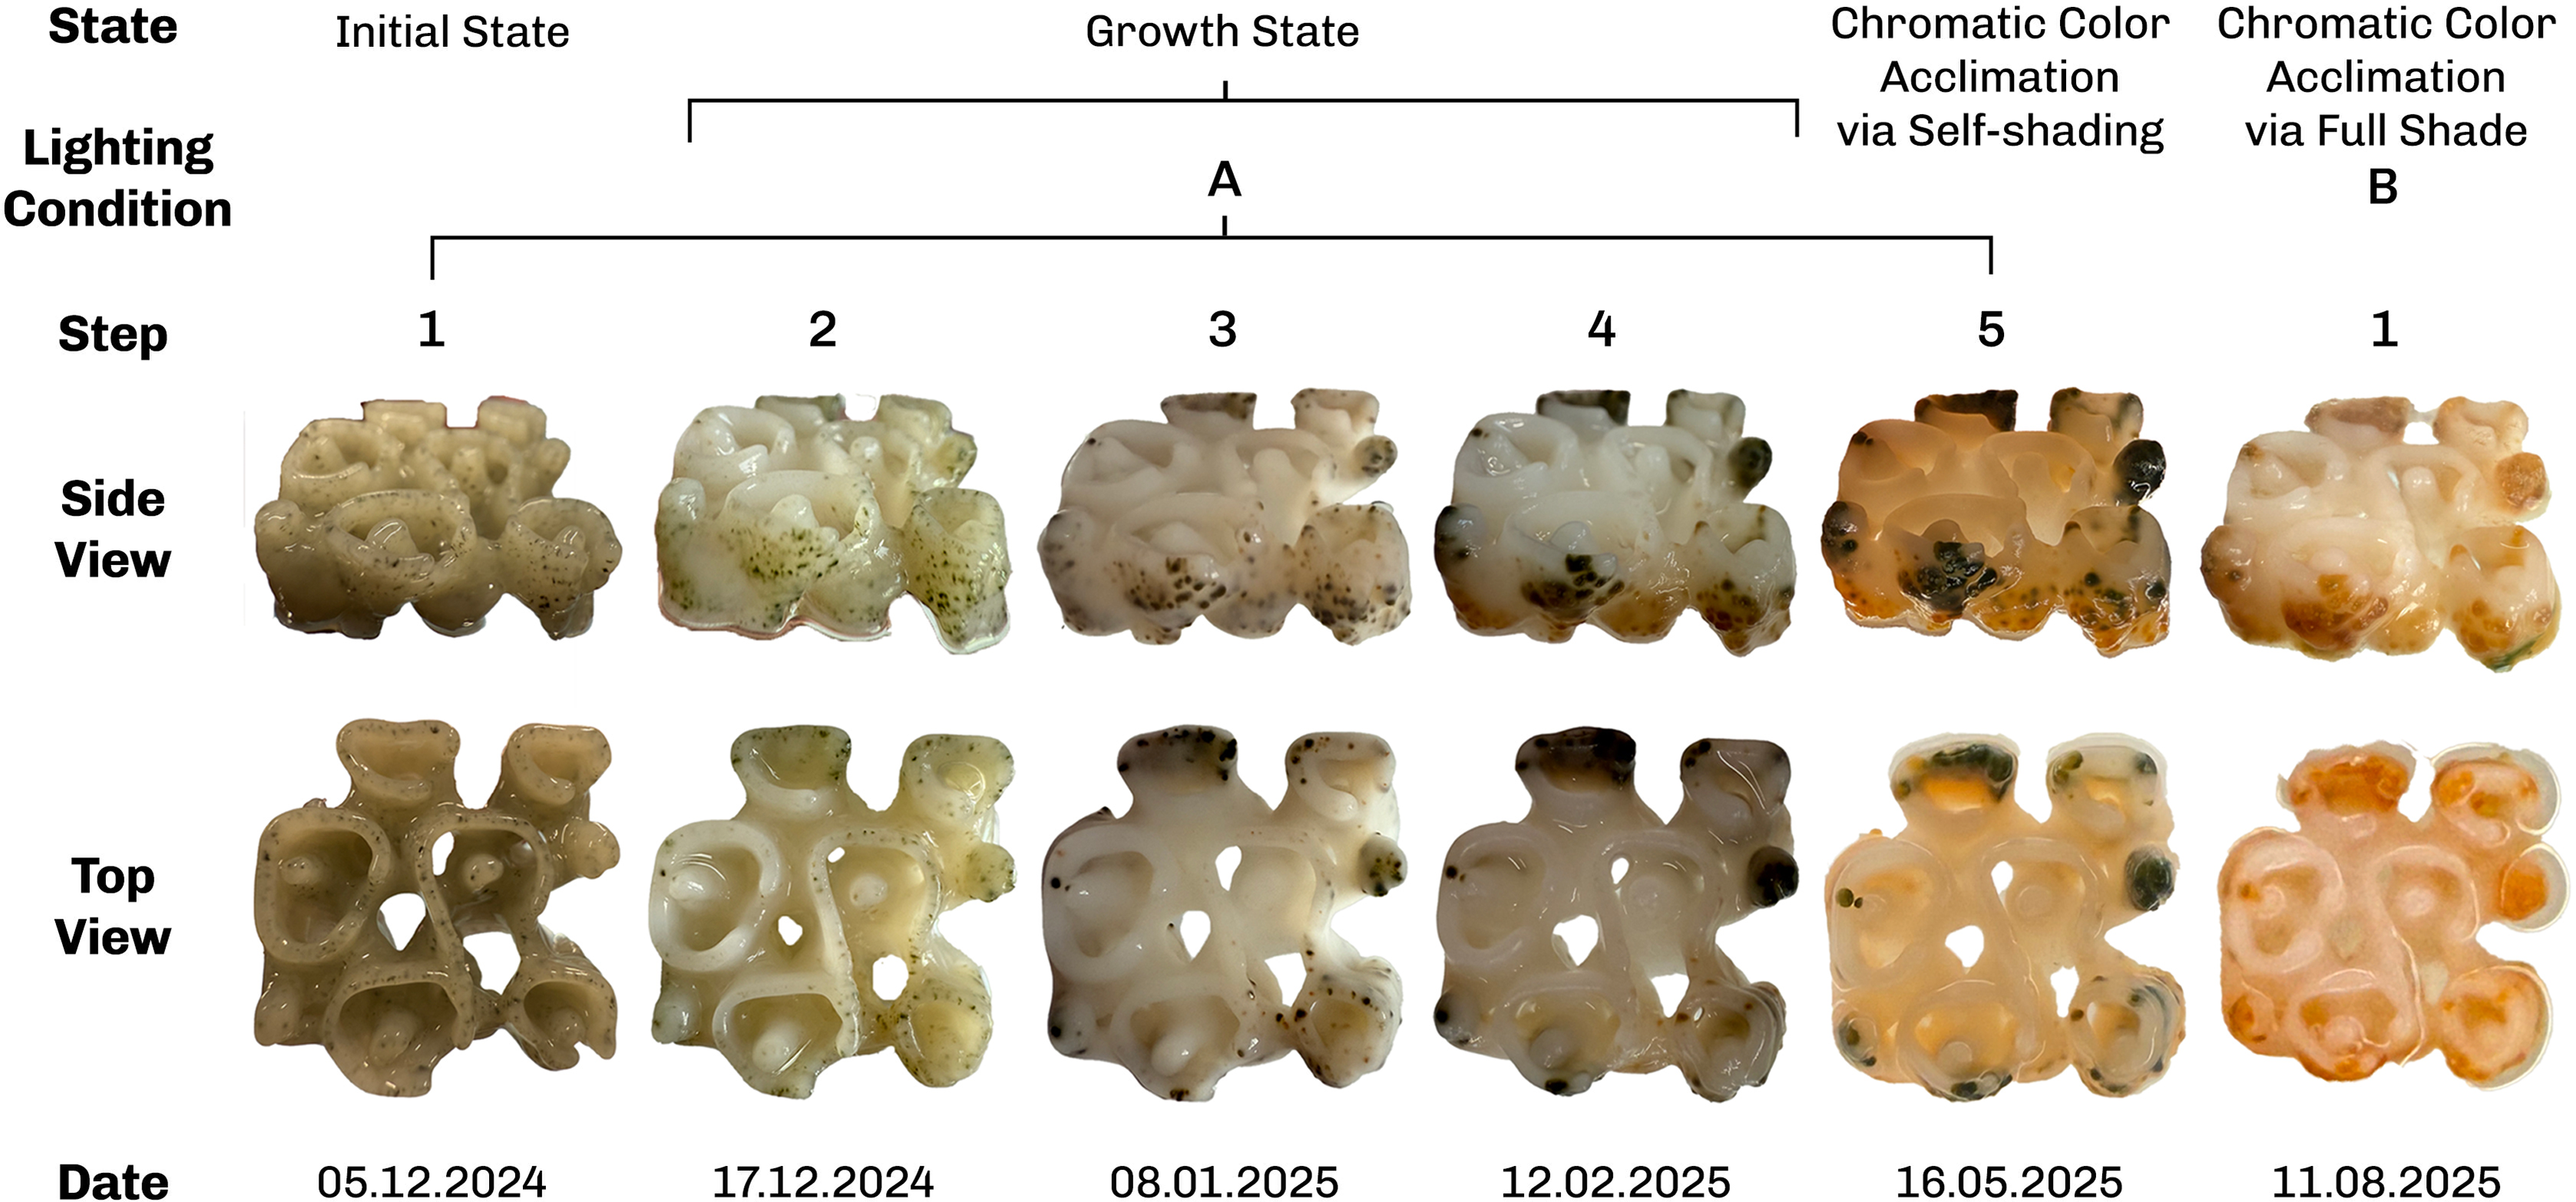
Under direct illumination of complex geometries, F. diplosiphon (UTEX B590) growth occurred preferentially at the construct periphery, while the construct interior remained whitish without visible cell growth (Figure 7, steps 1–5). At the construct periphery, self-shading produced by the upper layers’ growth and overhang geometry caused CCA in the lower, shaded layers, seen as a color shift across steps 4–5 in Figure 7. Under the bioprinted-slab shading (Figure 7B), cells across the construct underwent CCA in the shade regardless of whether the ambient light was red or green, with both conditions converging on a red-pigmented final state (Figure 7, step B-1).
Complementary Chromatic Acclimation (CCA) of F. diplosiphon (UTEX B590) grown in 3D-bioprinted constructs. Steps 1 to 5 display the growth of cyanobacteria in the periphery of the construct under direct light. Steps 4 to 5 display CCA in lower layers of the construct due to geometric self-shading and faster growth of top layers, while step B-1 displays color change across the bioprinted sample, due to growth in a shaded light condition.

E2 – photoactivation – differential growth
Light setup
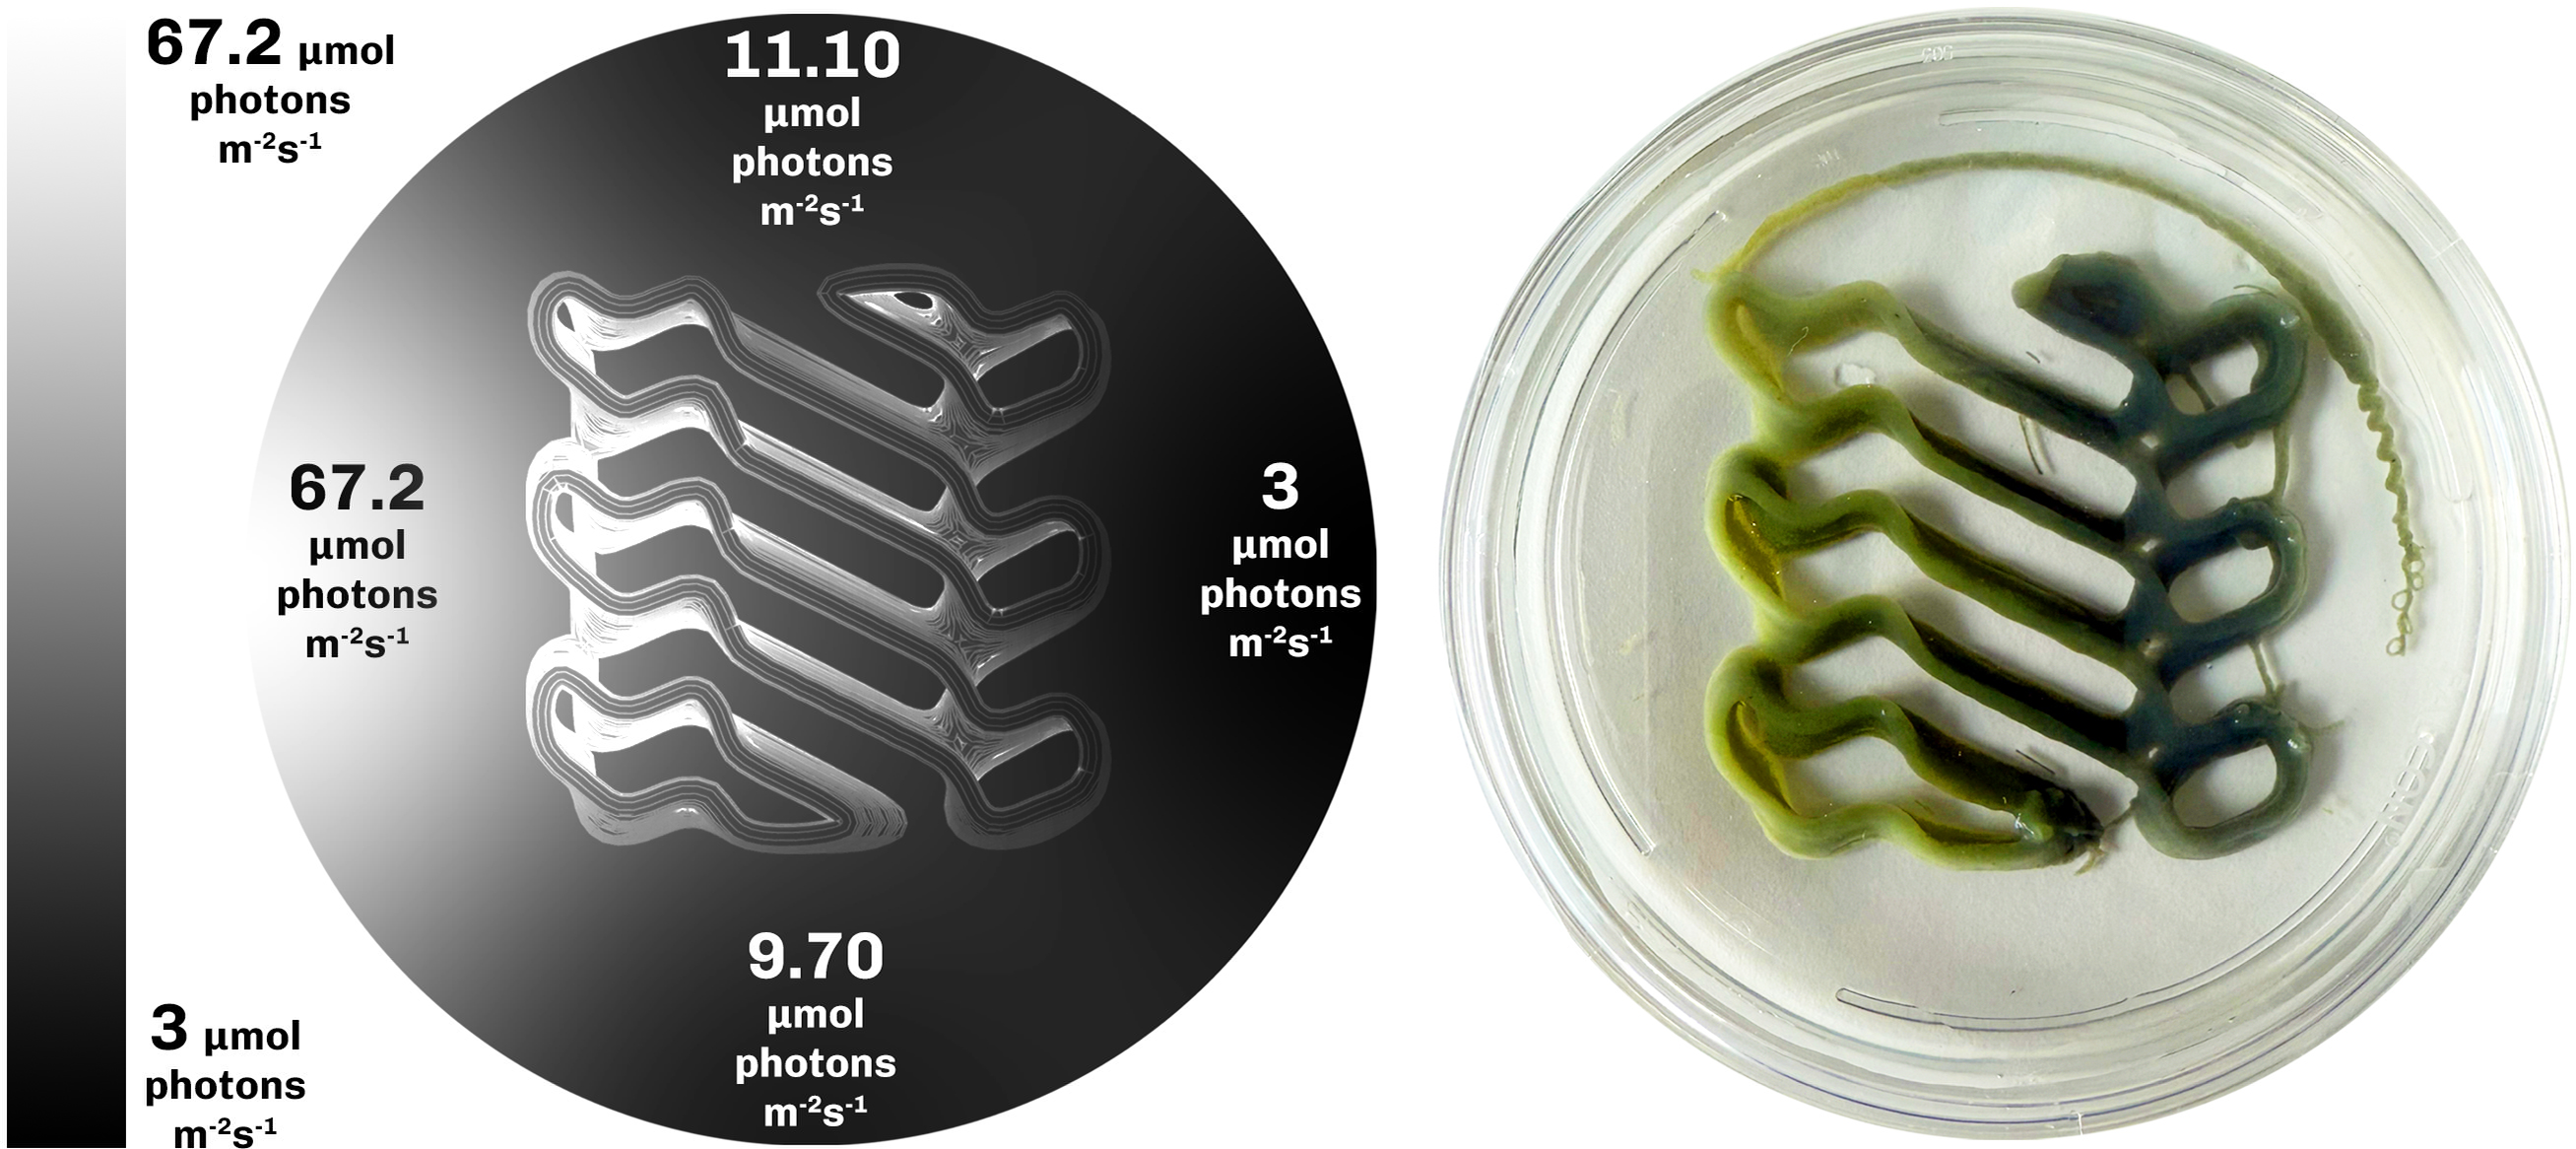
In the second experiment, we tested if a lateral light-intensity gradient produces spatially differentiated growth in a single bioprinted construct of F. diplosiphon (UTEX B590). The temperature was maintained at 23°C and constructs were printed at OD750 = 1.5 and incubated for 5 days under a green irradiance gradient ranging from 3 to 67 µmol photons m−2 s−1 across the construct, with a midpoint value of approximately 23 µmol photons m−2 s−1. Photon irradiance was measured along the gradient (Figure 8, left) using a small irradiance sensor connected to a calibrated light meter (ULM500, Walz GmbH). Because the light-intensity gradient extends along a 9 cm illumination path, the bioprinted construct was scaled up to 5 cm in lateral extent so that the resulting biomass distribution could be resolved across its length.
Left: Photon irradiance gradient in the setup, as measured by small irradiance sensor connected to a calibrated light meter (ULM500, Walz GmbH), Right: Differential growth of F. diplosiphon (UTEX B590) in the bioprinted construct under gradient light intensity illumination.

Results
The construct exhibited differential growth along the lateral light intensity gradient (Figure 8, right), with higher growth in the mid intensity region of the gradient and lower growth at both extremes. The mid intensity photon irradiance peak 23 µmol photons m−2 s−1 is consistent with the optimum range for F. diplosiphon (UTEX B590) under green light reported in the literature (Pérez-Gómez et al. Reference Pérez-Gómez, Mendoza-Hernández, Cabellos-Avelar, Leyva-Castillo, Gutiérrez-Cirlos and Gómez-Lojero2012). Cells exposed to high irradiances (∼67 µmol photons m−2 s−1) show reduced biomass relative to the midpoint, consistent with photoinhibition at supra-optimal irradiance and high biomass in the optimal light region in the middle displaying photoactivation.
E3 – photoinhibition
Light setup
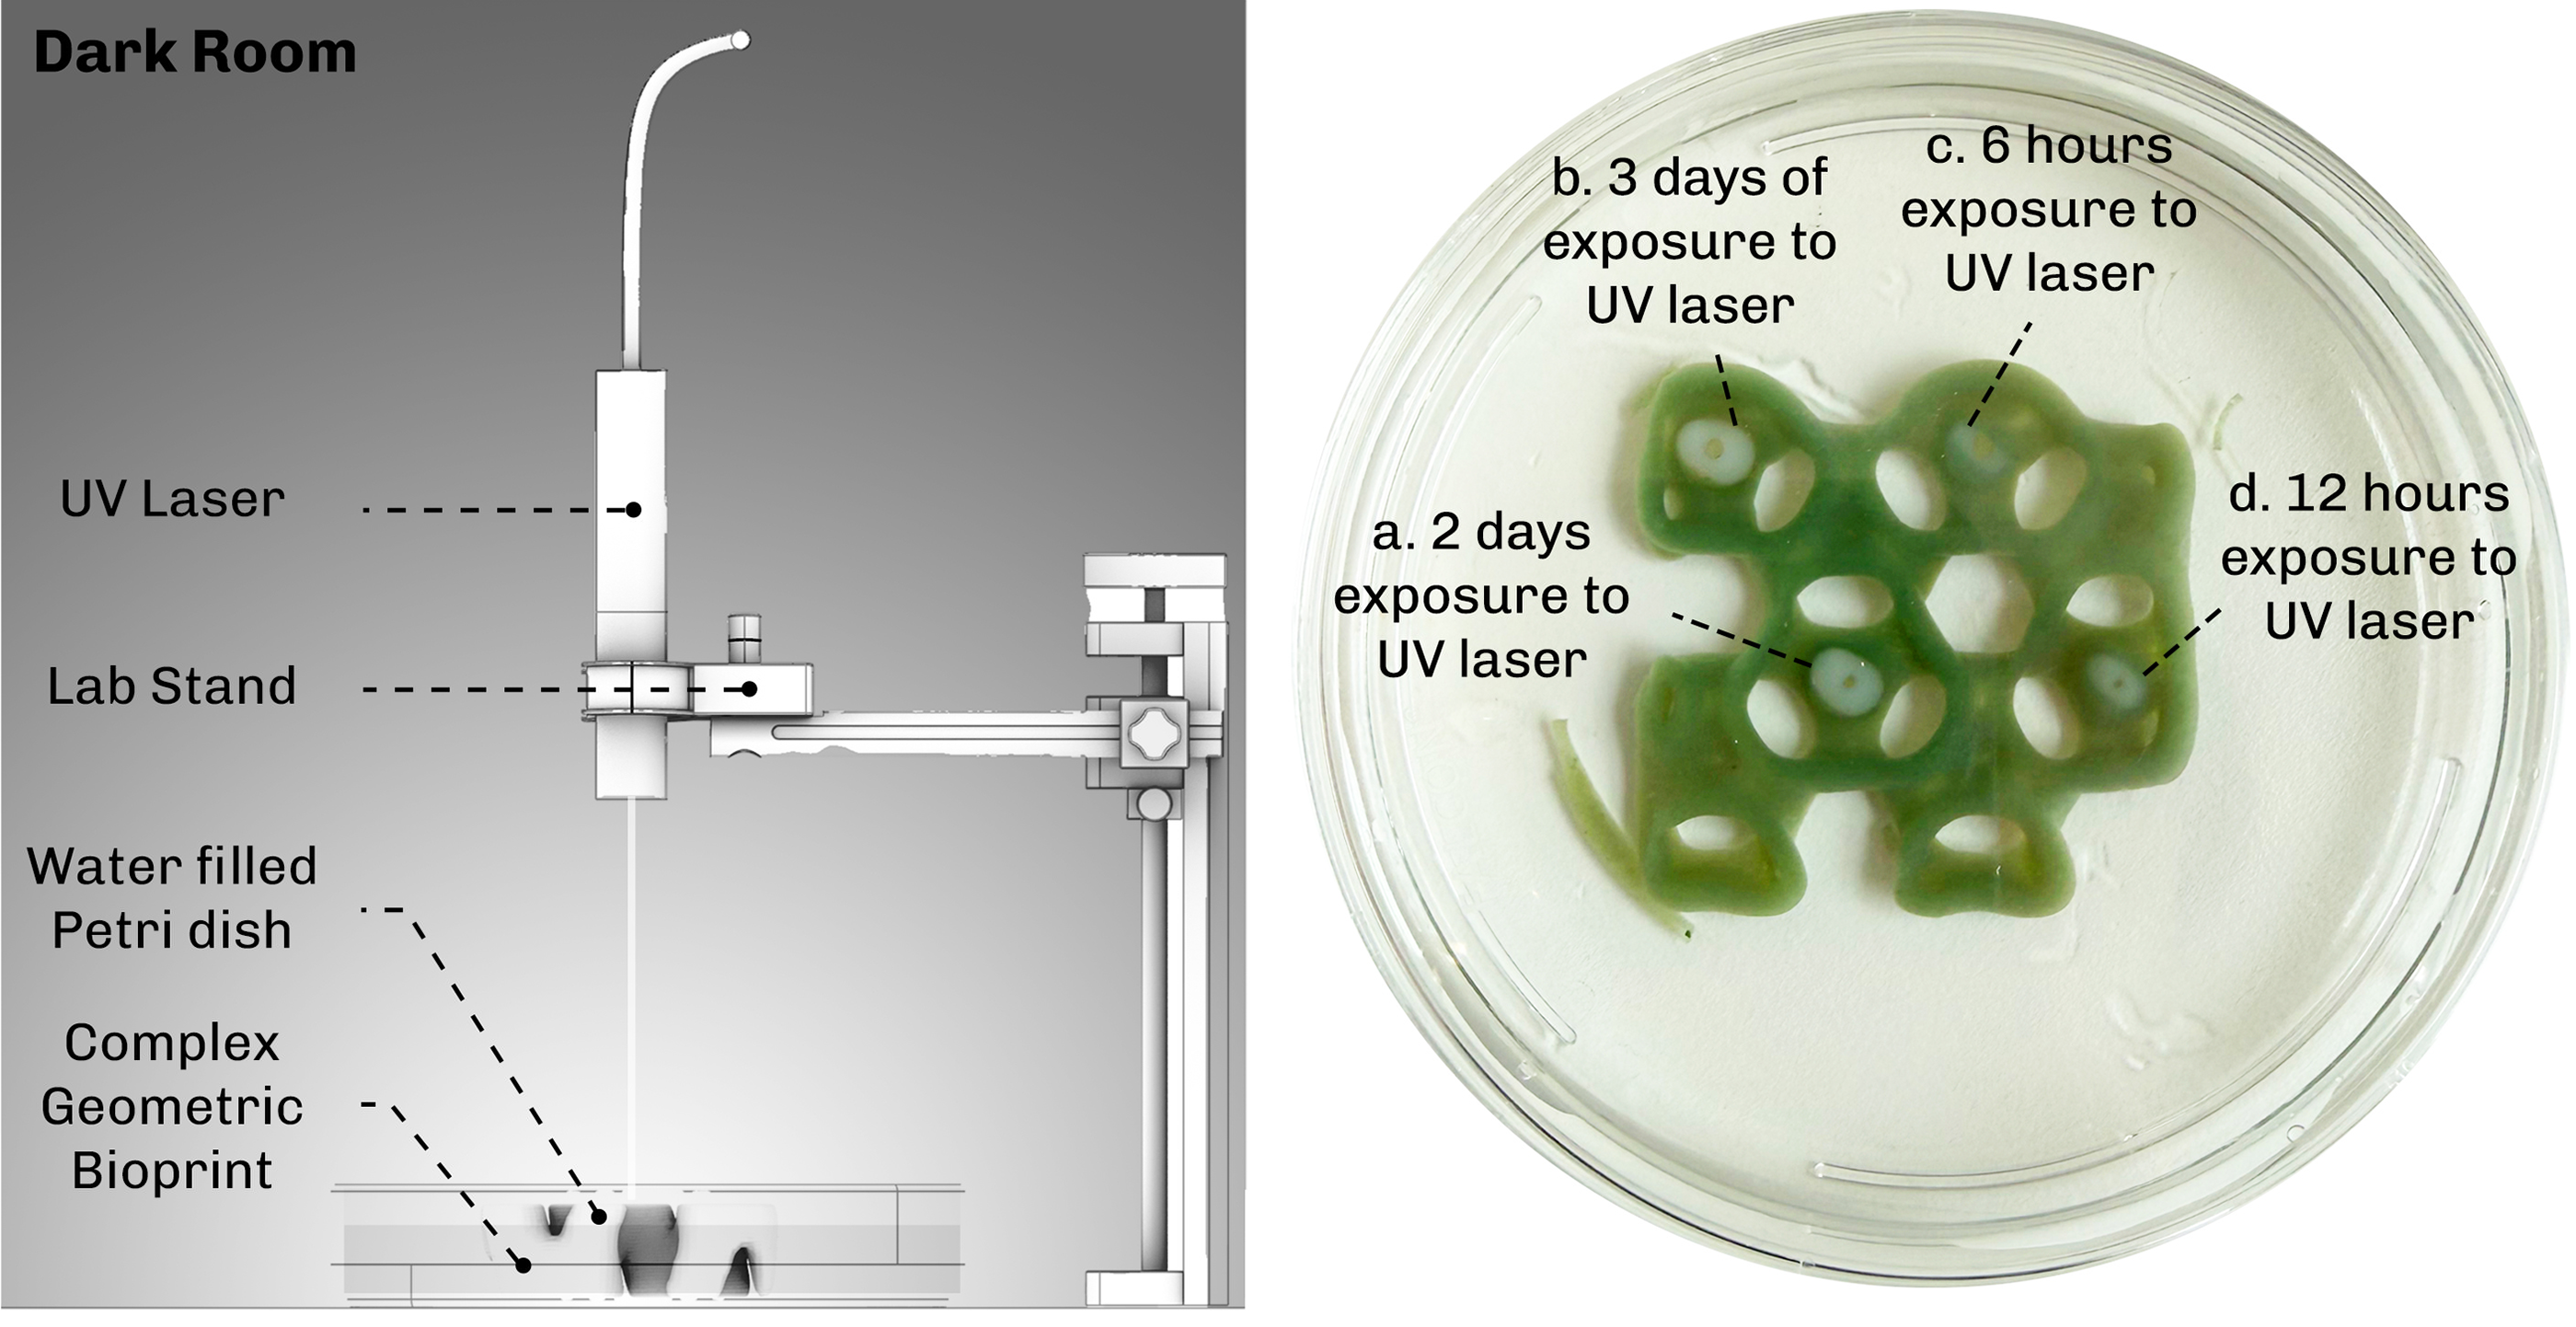
To investigate whether UV light can locally suppress growth, we conducted a photoinhibition experiment using a UV laser (405 nm) delivering a photon irradiance of 46 µmol photons m−2 s−1 to discrete spots on the bioprinted construct of F. diplosiphon (UTEX B590) (Figure 9 left). The constructs for this experiment were printed at OD750 = 2.1, higher than the OD750 = 1.5 used in E1 and E2, to make decolorization visually detectable against the hydrogel background. The UV laser was focused tightly on four spots labelled a, b, c, d (Figure 9 right), where exposure times varied to test the relationship between exposure duration and decolorization of the area. The choice of 405 nm UV is supported by absorbance spectra of F. diplosiphon prior to mixing with the bioink, which shows high light absorption at 405 nm (supplementary Section Figure S1.1). The bioprinted construct was kept in a dark room throughout the experiment to isolate the UV exposure as the only light input.
Left: Lighting setup for photoinhibition using 405 nm UV laser in the dark room. Right: Photoinhibition via UV laser on a bioprinted cyanobacterial construct. The longer the exposure to UV the more area is cleared from the cyanobacteria F. diplosiphon (UTEX B590) inside the hydrogel.

Results
The UV laser produced visible local decolorization at each exposed spot (Figure 9 right) and the decolorized area increased with increasing exposure duration, confirming that 405 nm UV can locally clear cells from the construct.
E4 - projection mapping
Light setup
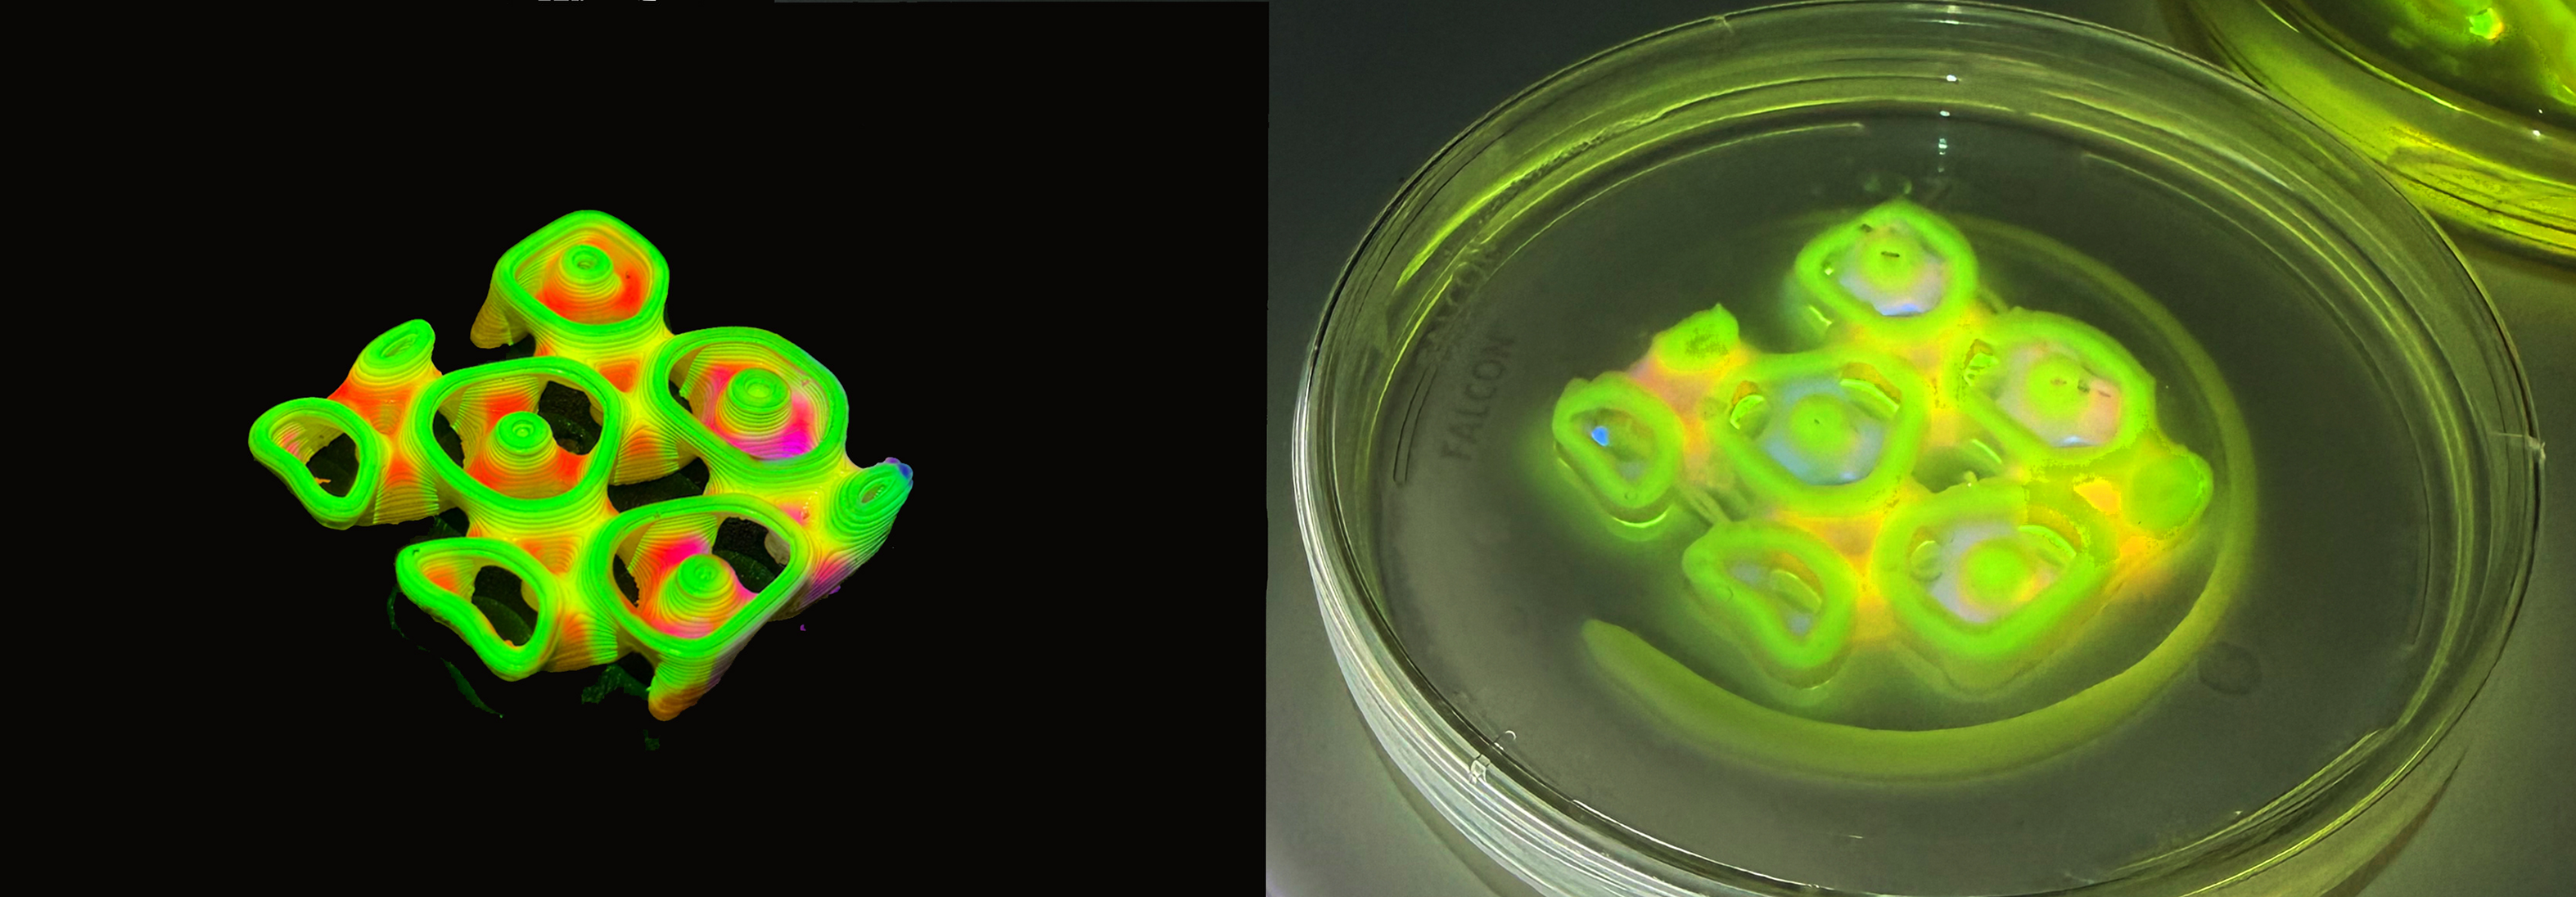
In the final experiment, we tested whether our projection mapping method can integrate the responses characterized in the previous experiments (Complementary Chromatic Acclimation, photoactivation, photoinhibition), by delivering spatially structured light patterns to bioprinted constructs. We also tested whether we could reproduce the experimental framework across two strains of F. diplosiphon: the UTEX B590 strain used in previous experiments and the UTEX B481 strain. Bioprinted constructs were printed at OD750 = 1.5 and exposed for 7 days. The DLP projector (Optoma HD28DSE) was set to a 12:12 hour day:night cycle resembling the diurnal cycle for cyanobacterial growth. Although the projector is switched off during nighttime, a weak residual emission of 0.03 µmol photon m−2 s−1 was observed (Genesys 40 spectrophotometer; supplementary section Fig S2.1.) which did not influence growth or pigmentation in the bioprinted constructs. The projection setup was placed in a temperature-controlled room with a thermometer next to the test samples confirming a stable temperature of 23°C. Initial pattern fidelity tests were performed by projecting onto 3D printed PLA samples and bioprinted hydrogel samples in parallel: PLA showed sharp surface resolution, while hydrogel samples showed slight scattering due to translucency, water content and the Petri dish cover, with light absorbed and scattered through the cell-laden matrix, producing reduced irradiance from upper to lower layers (Figure 10). Initially three projection patterns were tested on both strains (Figure 11), each designed to isolate or combine the parameters established in earlier experiments:
Left: Projection mapping on a 3D printed PLA sample. Right: Projection mapping on a bioprinted F. diplosiphon construct. The bioprinted sample displays light scattering and attenuation of spectral irradiance in the lower layers of the bioprint, due to translucency of the hydrogel.

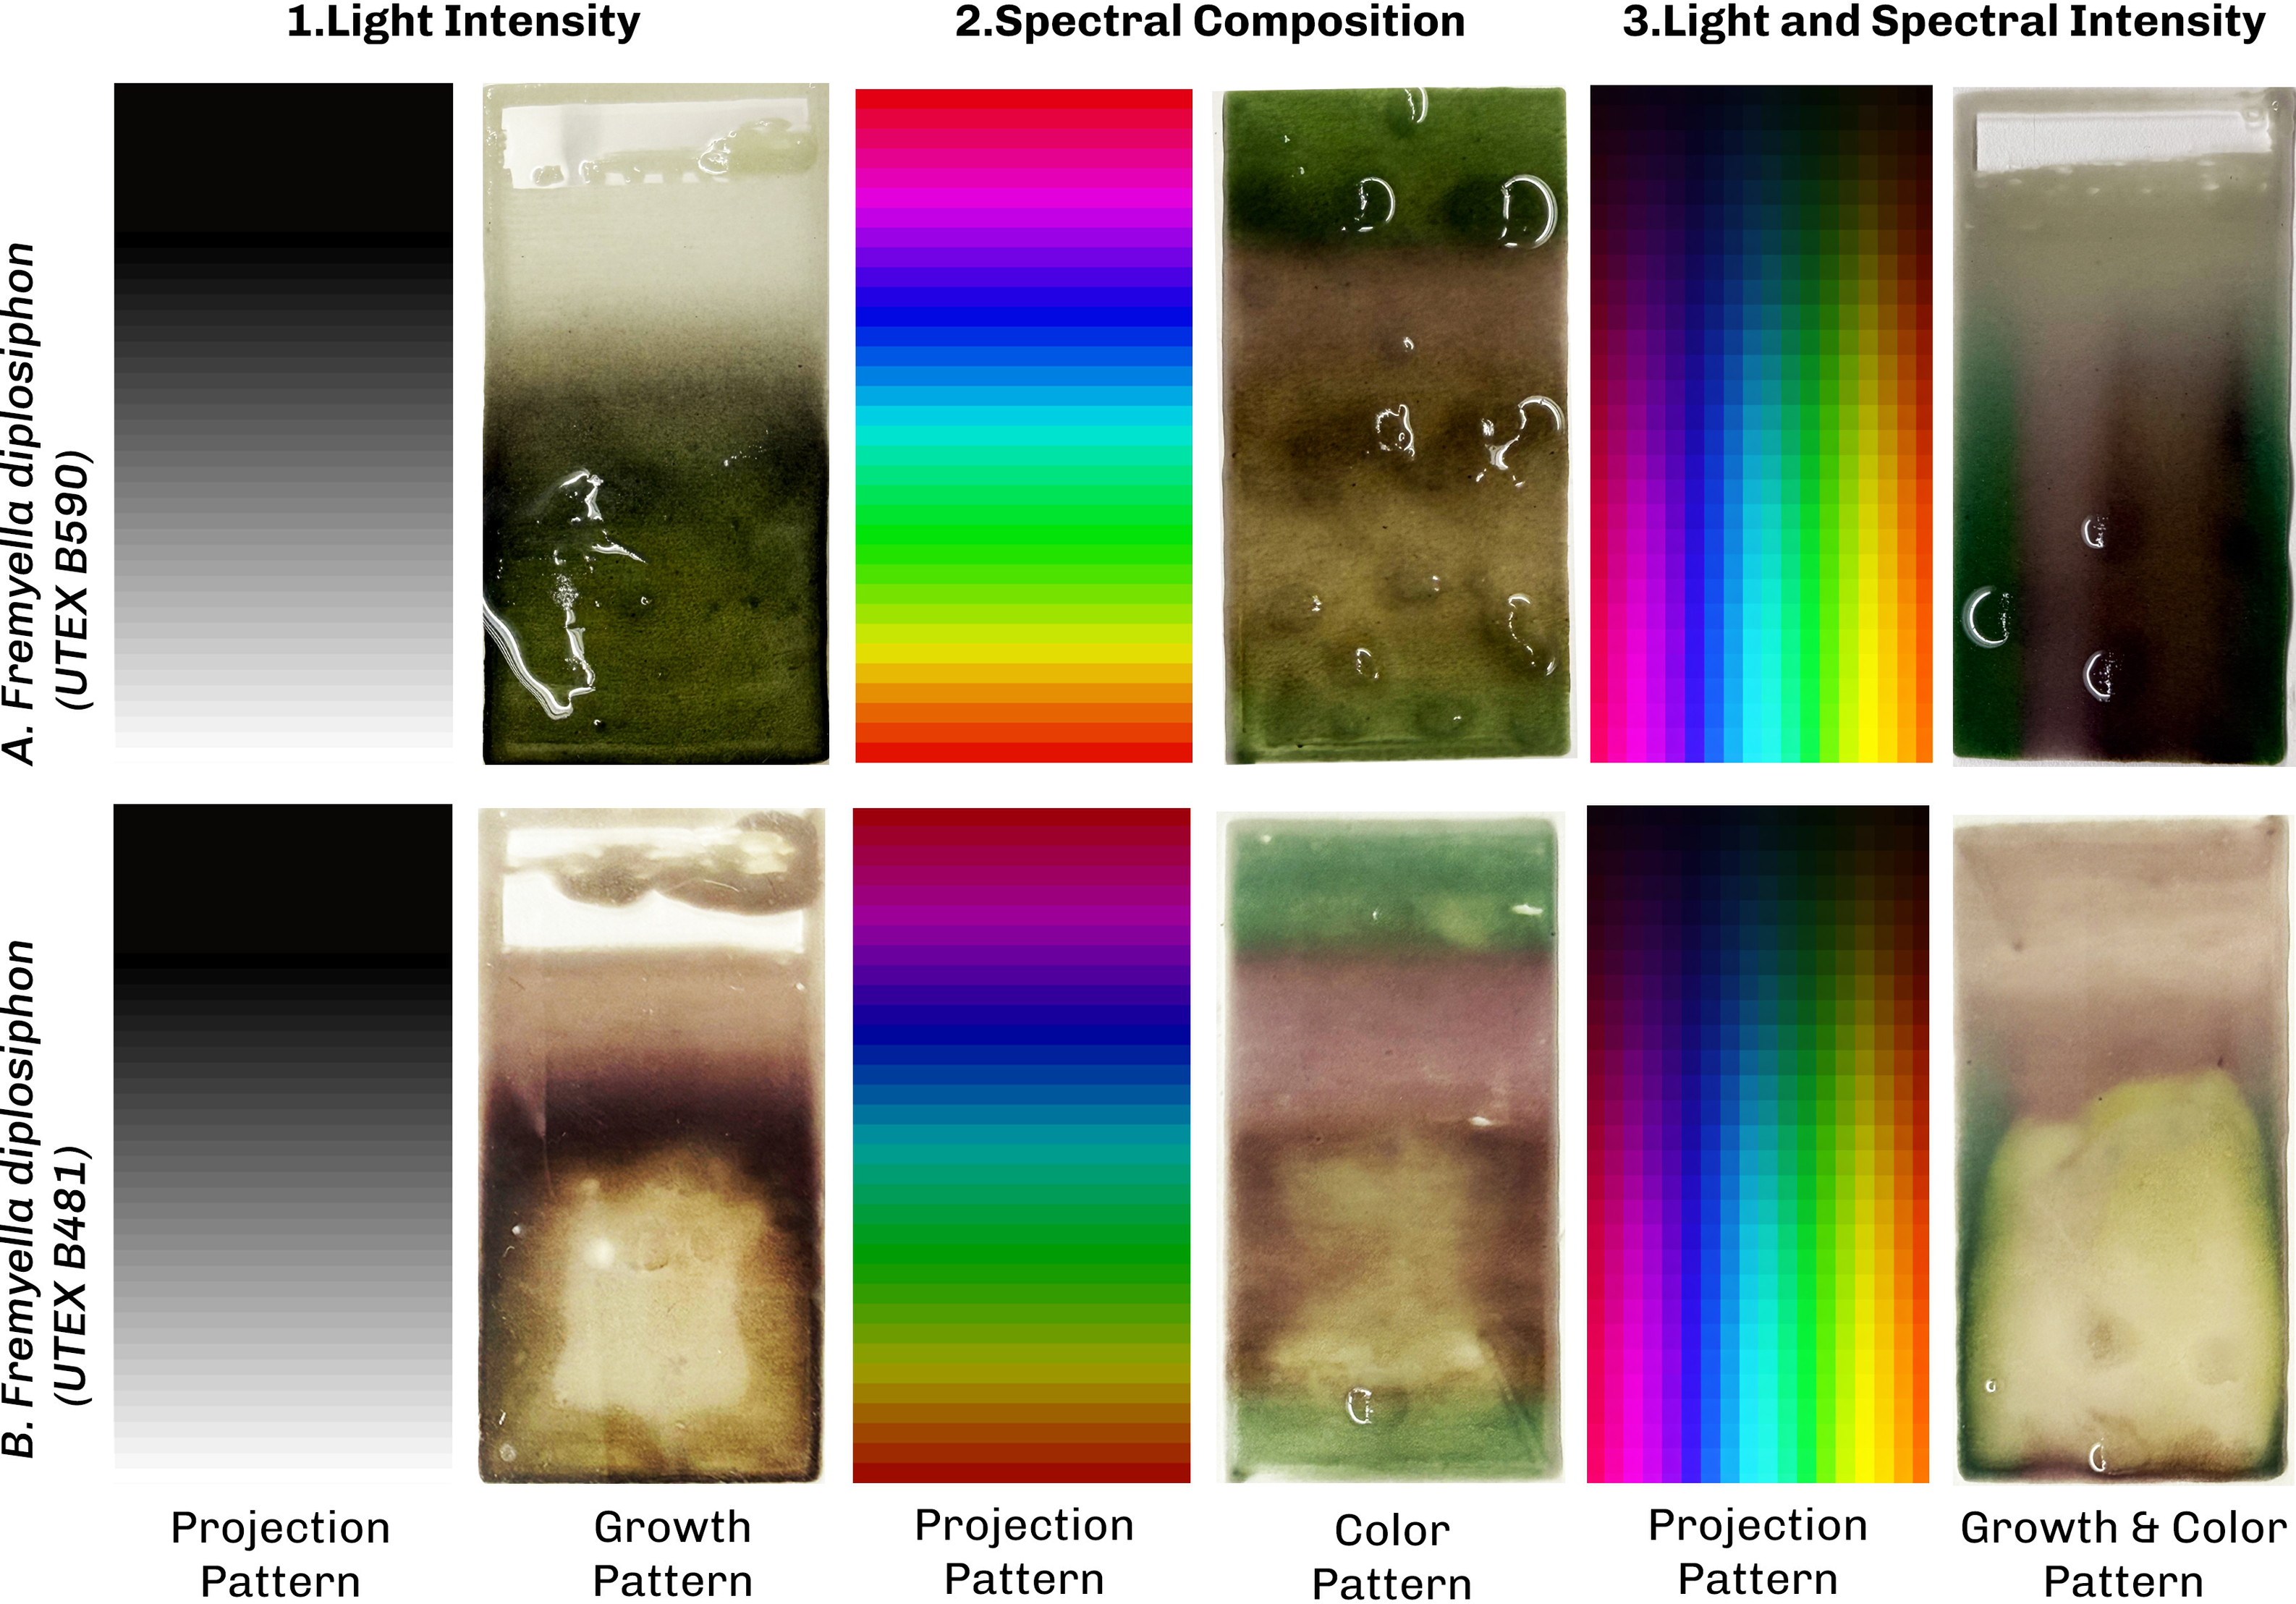
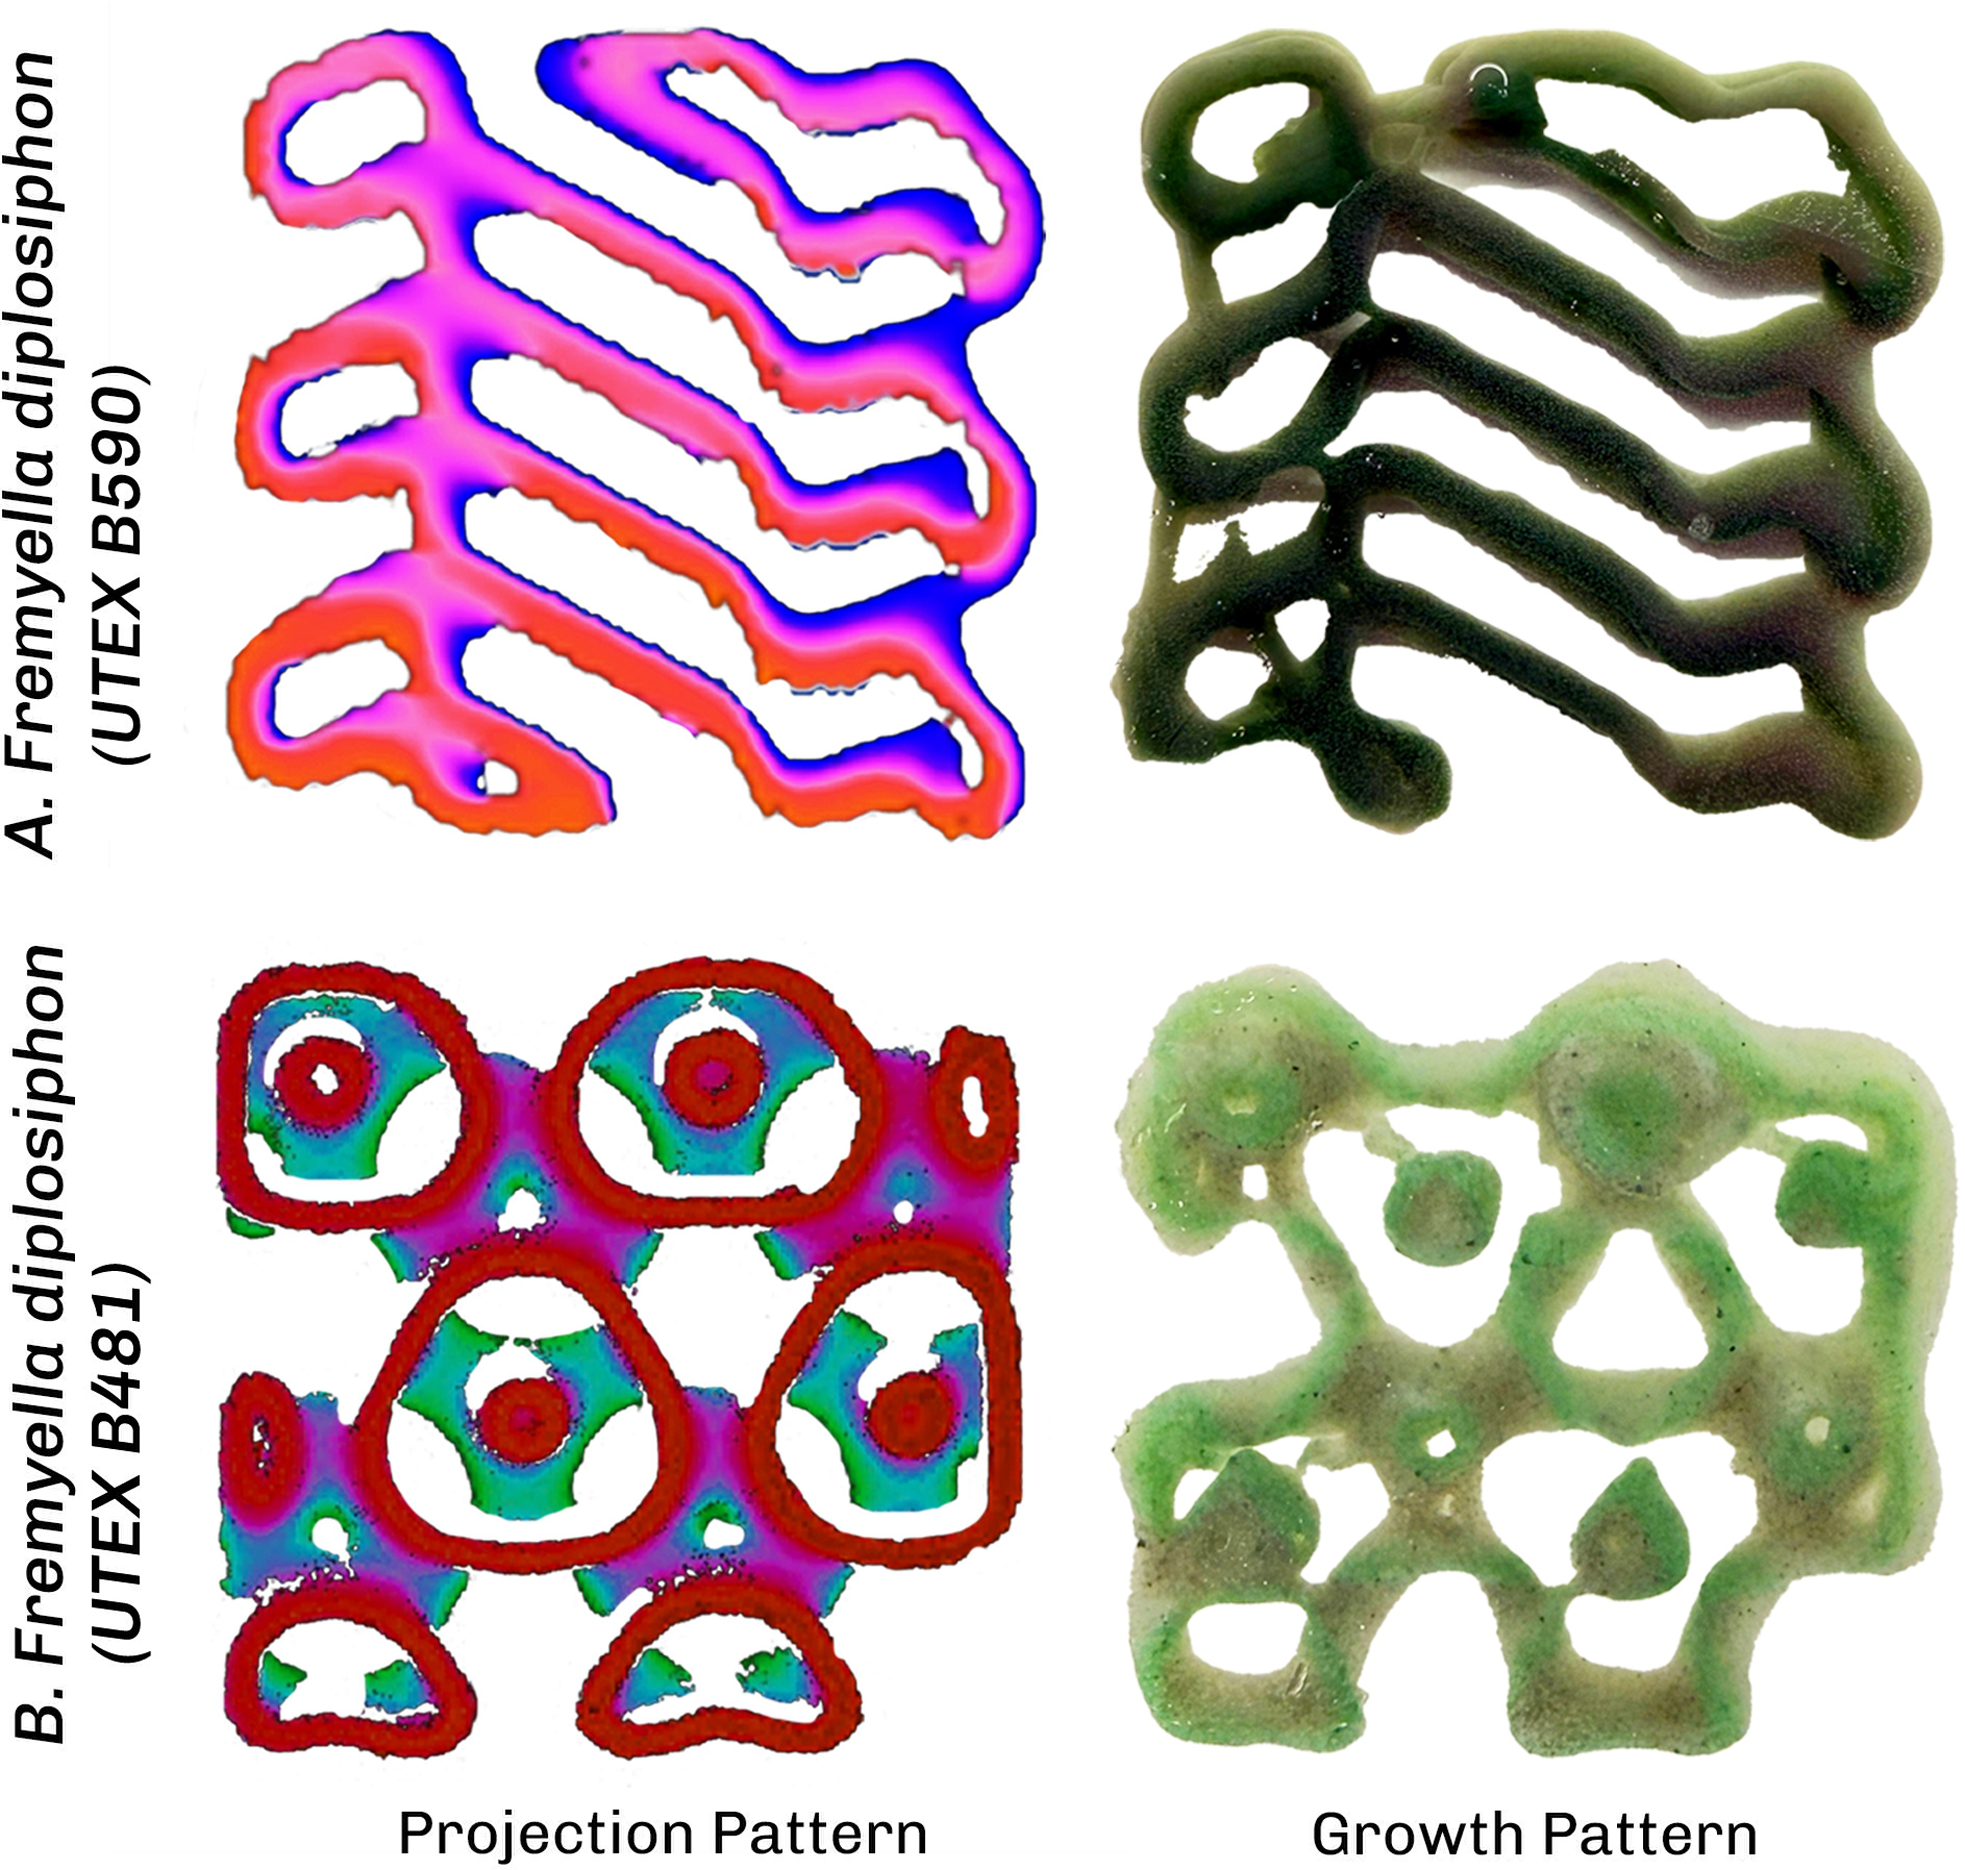
Projection mapping experiment to explore the response of bioprinted constructs of F. diplosiphon (UTEX B481 and B590) to different light patterns including: light intensity, spectral composition, and the combination of spectral and light intensity.

Figure 11 Long description
Projection mapping on two strains of F. diplosiphon (UTEX B481 and B590) under three light patterns. (1) A light-intensity gradient and its effect on growth: UTEX B481 shows chlorosis at high intensity and red pigmentation with better growth at lower intensity, while UTEX B590 is more resilient at high intensity and stays green. (2) Spectral-composition patterns at the optimal intensity from pattern 1, causing color change: both strains appear green under red light and red under blue light, but differ under green light, where UTEX B481 turns reddish-brown and UTEX B590 stays green. (3) The two patterns combined (light intensity and spectral composition), validating the first two experiments.
-
1. A light intensity gradient of white light from low to high irradiance, extending the second experiment to projection-based delivery.
-
2. A spectral-composition pattern at the optimal intensity identified in pattern 1, providing spatially structured spectral input that extends the CCA characterization of the first experiment.
-
3. A combined pattern mixing of a light intensity gradient with spectral composition, which was designed to test whether the two parameters can be modulated independently in the same construct and to cross-validate the single parameter results from patterns 1 and 2.
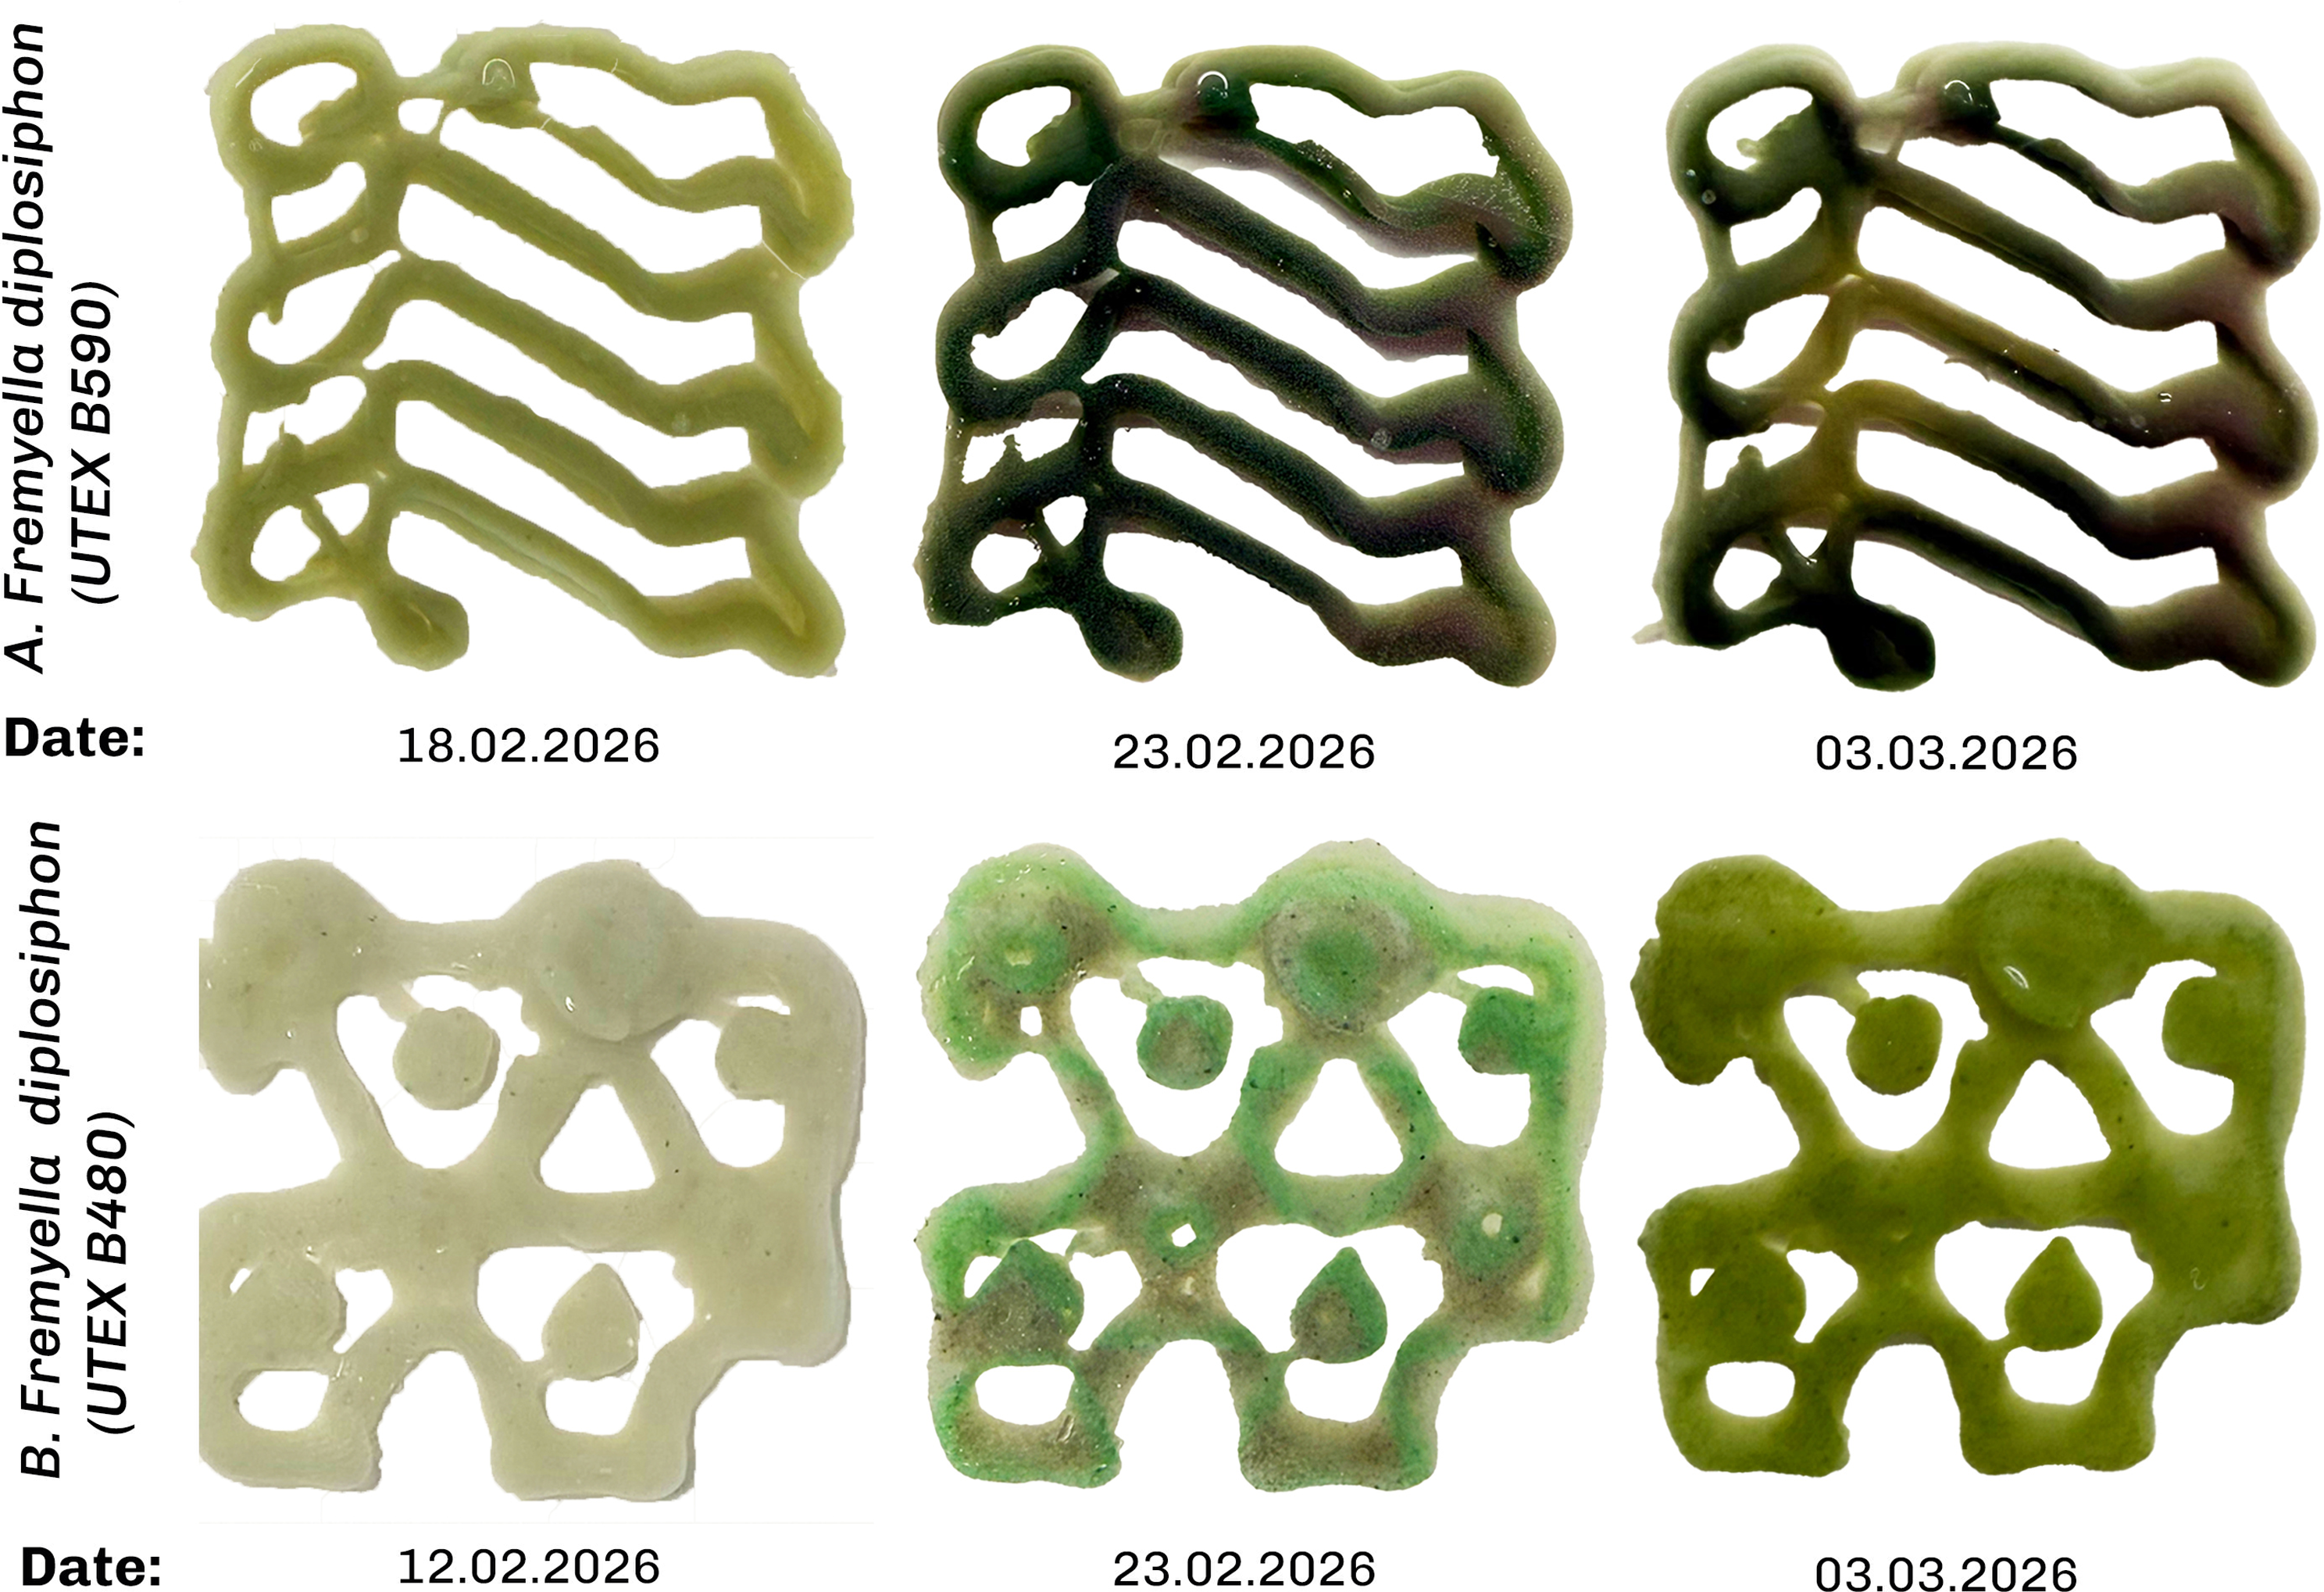
The combined pattern was then used in more complex bioprinted geometries generated by post-processing depth-map 3D scans into the designed intensity and color distribution, projected onto the constructs.
Results
1. Intensity-gradient pattern. Under the white light intensity gradient pattern, F. diplosiphon (UTEX B590) grew most strongly in the high irradiance region with dark green pigmentation (Fig 11.1), consistent with the light intensity gradient experiment (E2). Under the same intensity-gradient pattern, F. diplosiphon (UTEX B481) showed reddish-brown pigmentation and exhibited photoinhibition at high photon irradiance, with optimal growth observed at approximately 24 µmol photons m−2 s−1. These experimental results confirm the difference in baseline pigmentation of the two strains displaying differences in PC/PE composition under broadband white light exposure.
2. Spectral-composition pattern. Based on the optimal growth light intensity for each strain (determined in experiment 1), we designed the spectral-composition pattern. F. diplosiphon (UTEX B590) underwent CCA in patterns matching the projected color map: regions exposed to projected red light shifted to green pigmentation, regions exposed to projected blue light shifted to red pigmentation and regions exposed to projected green light retained a dark green color (Figure 11.2). Under the same spectral pattern, F. diplosiphon (UTEX B481) showed similar color change with the difference in green light where it produces brown pigmentation.
3. Combined pattern. The combined intensity and spectrum pattern reproduced the responses observed under each individual pattern 1 and 2. F. diplosiphon (UTEX B481) exhibited photoinhibition in high-intensity regions, while F. diplosiphon (UTEX B590) grew most strongly in the same region, mirroring the intensity pattern result. Both strains exhibited the spectrally driven CCA response in the spectral projection pattern.
The combined pattern shows similar results as in the first three patterns with spatial fidelity particularly visible at the construct’s 2 mm walls (Figure 12F. diplosiphon UTEX B590). The color gradient along the central axis tracked the projected pattern, with the wall divided into two pigmentation zones reflecting the local differences in wavelength and intensity. The gradient diminishes toward the lower part of the image (Figure 12F. diplosiphon UTEX B590) in line with the projection pattern transitioning from pink (top) to red (bottom).
Projection mapping experiment on complex bioprinted constructs of F. diplosiphon (UTEX B590 and B481) using a combined pattern of light intensity and spectral composition.

Figure 12 Long description
Projection mapping on two strains of F. diplosiphon (UTEX B481 and B590): the light pattern produces colour change and a growth gradient with high spatial accuracy on the 2 mm walls of the complex bioprinted grid in both strains, confirming the earlier projection mapping results.
Evaluation
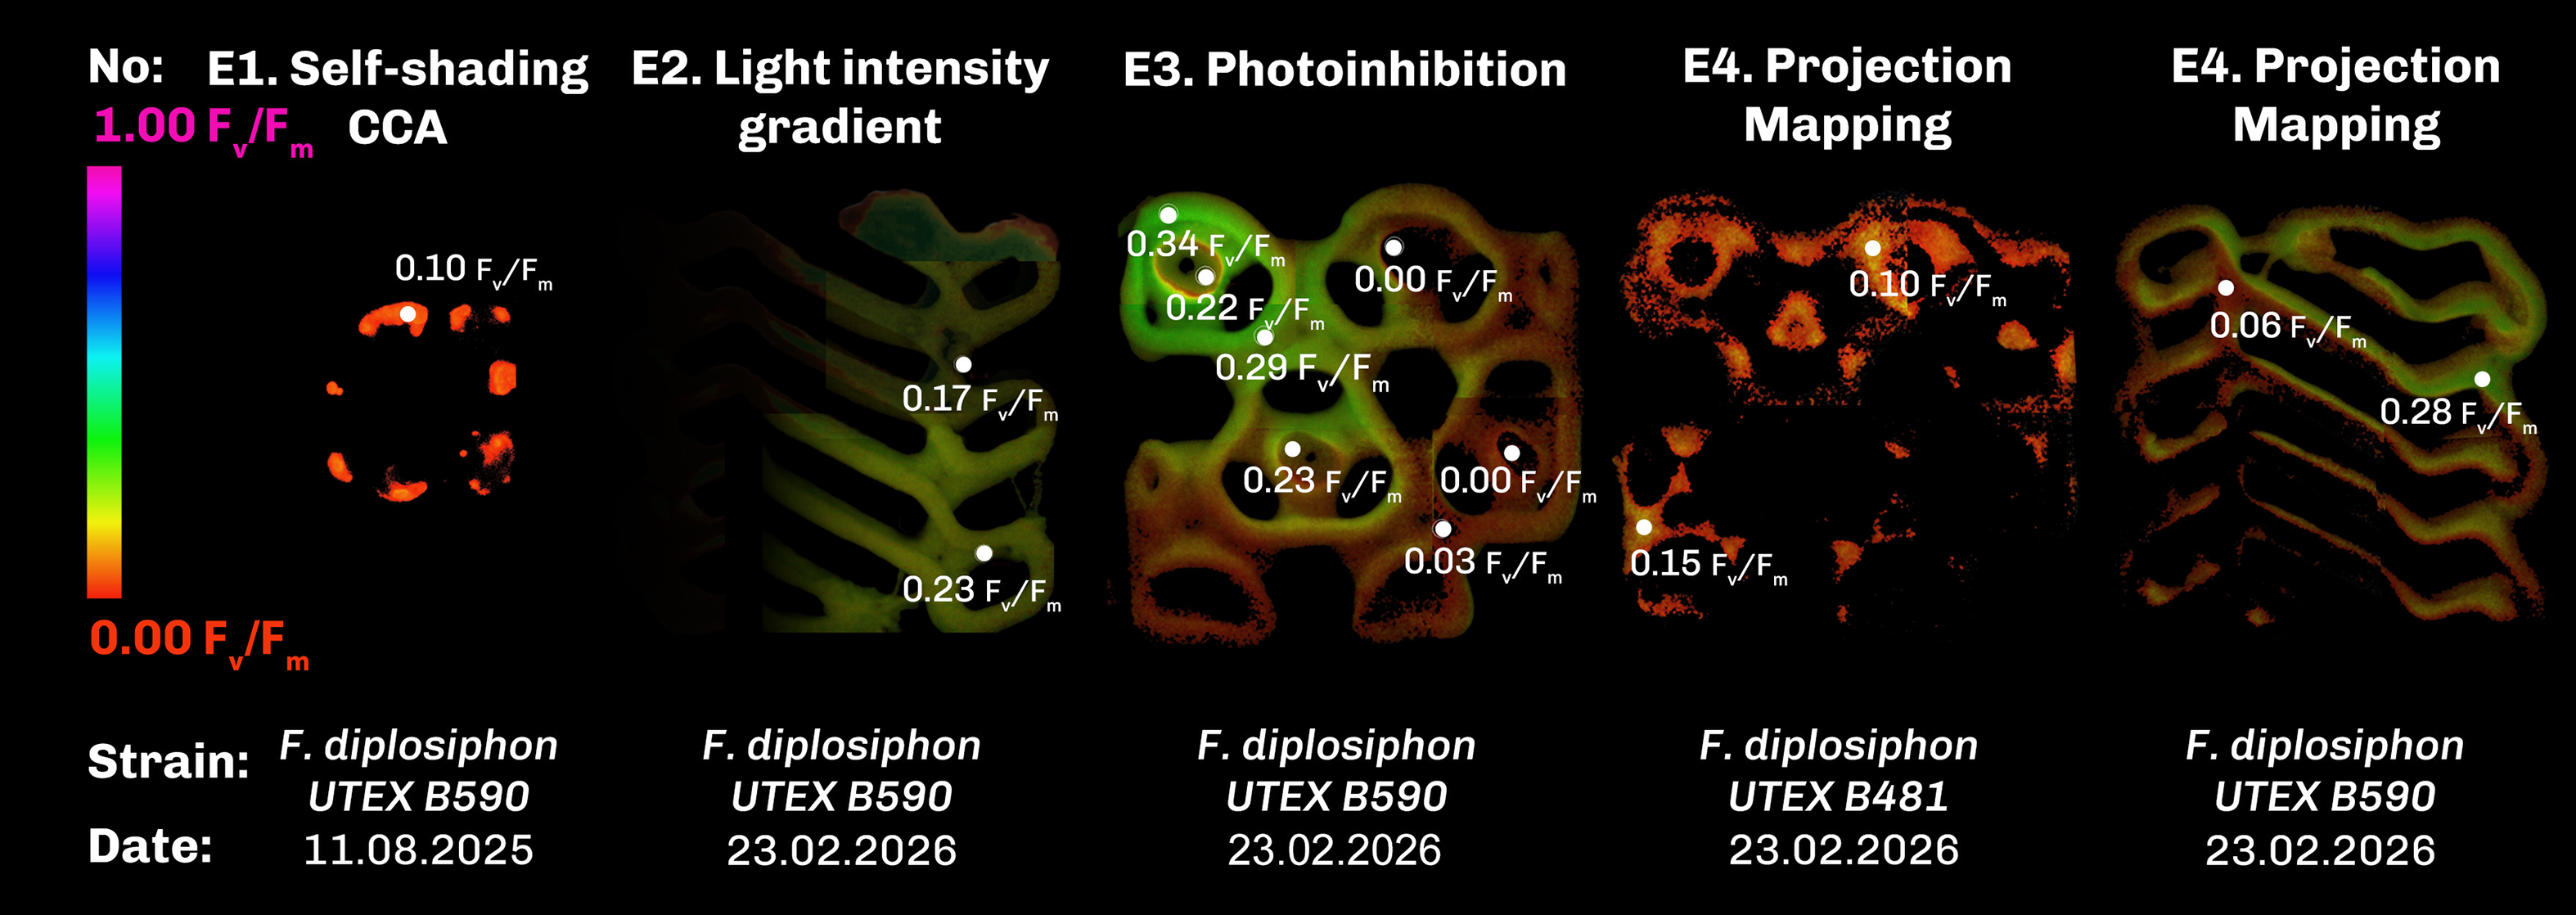
To evaluate the outcomes of the different light projection schemes, variable chlorophyll fluorescence imaging (CFI) was used to track photosynthetic activity, growth and viability of F. diplosiphon. Endpoint CFI imaging confirmed that cells remained photosynthetically active in all four experiments as shown in Figure 13. The apparently lower Fv/Fm values we observed in green pigmented regions across all three projection patterns should be interpreted with caution. While CFI is a well-established method for assessing photosynthetic activity in plants and algae, these measurements are more variable in cyanobacteria due to e.g. background fluorescence from phycobilisomes and PSI leading to an underestimation of Fv/Fm values in green light acclimated cells (Schuurmans et al. Reference Schuurmans, Van Alphen, Schuurmans, Matthijs and Hellingwerf2015). The directional trends we report here are therefore robust as relative comparisons within our experiment, but their absolute magnitudes should not be overinterpreted. Future work using complementary techniques such as oxygen evolution measurements would resolve this ambiguity.
Maximum PSII quantum efficiency (Fv/Fm) values determined from CFI of the final state of the four experiments on F. diplosiphon (UTEX B590 and B481).

Figure 13 Long description
Maximum PSII quantum efficiency (Fv/Fm) measured by variable chlorophyll fluorescence imaging at the end of each experiment, where color encodes Fv/Fm from low to high. E1 shows photosynthetic activity retained after 60 days, with a peak Fv/Fm of about 0.10. E2 shows differential activity matching the growth gradient, with a peak of about 0.23. E3 shows reduced activity at the UV-exposed spots c and d, confirming local photoinhibition. E4 shows the projection-mapping construct with Fv/Fm varying with the projected pattern, ranging from about 0.06 to 0.28 in UTEX B590.
The CFI values from the first experiment with peak Fv/Fm values of 0.10, confirm the photosynthetic capacity of the cells inside the hydrogel after 60 days (Figure 13.E1). In the second experiment (E2) CFI values confirm differential photosynthetic capacity due to differential growth (Figure 13.E2) with peak Fv/Fm values of 0.23. CFI values from the third experiment further testify the localised decolorization and loss of photosynthetic activity within spots c and d (Figure 13.E3), while CFI values from projection mapping experiment on complex bioprinted constructs exhibited different Fv/Fm values ranging from 0.28 to 0.06 caused by the projection pattern in F. diplosiphon (UTEX B590).
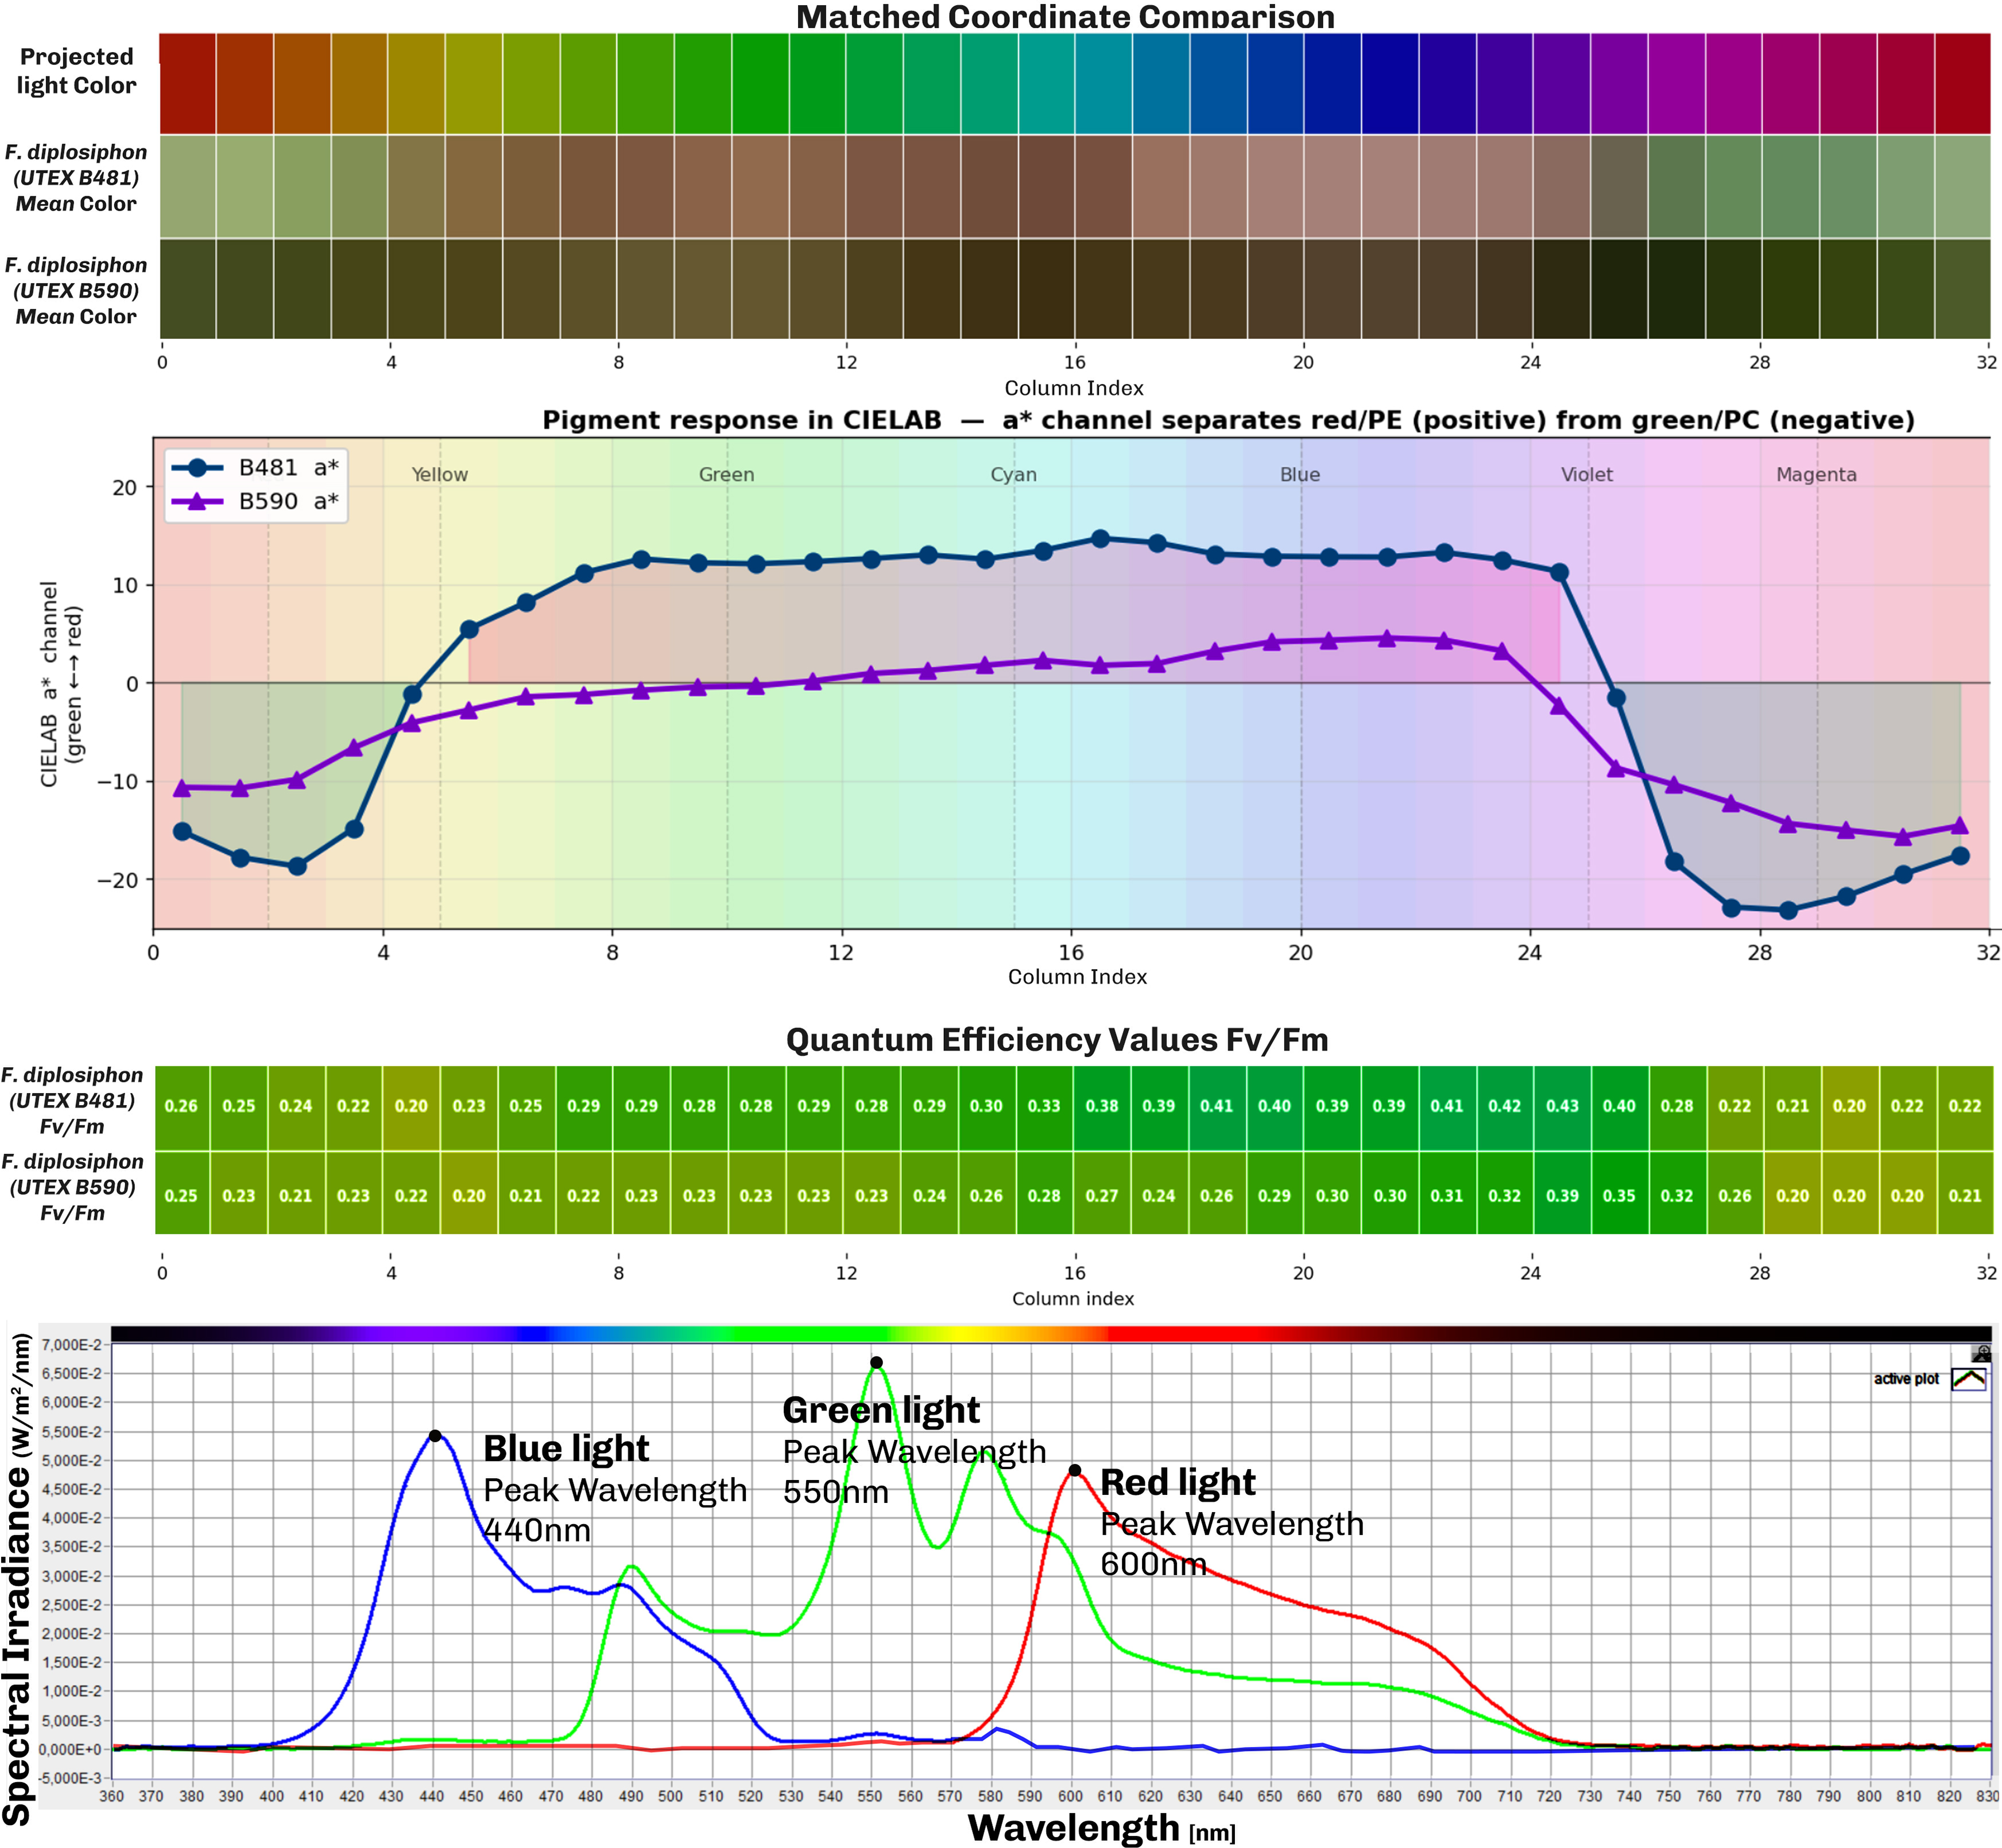
We further evaluated patterns of F. diplosiphon photosynthetic activity and pigmentation in the bioprinted constructs in comparison to projected light colors in our comparative study in Figure 14. Analyses of RGB images converted to LAB color space for green and red color comparison show that F. diplosiphon (UTEX B590) produce more green color across the visible spectrum of light and that F. diplosiphon (UTEX B481) produce more red color (Figure 14 Pigment response diagram and Matched Coordinate Comparison). Comparing CFI images from the projection mapping experiment shows that the peak of photosynthetic activity in F. diplosiphon (UTEX B590) was achieved under violet color (column 25), whereas in UTEX B481 it was under the light blue color (column 15), both with Fv/Fm values of approximately 0.40.
Comparative study between projected light spectrum and CCA in the two strains of F. diplosiphon (UTEX B590 and B481) and the resulting maximum PSII quantum efficiency values in the projection mapping experiment.

Figure 14 Long description
Comparison of projected light spectrum and color change (Complementary Chromatic Acclimation) in the two strains of F. diplosiphon (UTEX B590 and B481), based on the projection mapping experiment. The matched-coordinate comparison shows each strain's color response to the projected light color; color values are averaged per coordinate from RGB images of both bioprinted constructs. The pigment-response diagram compares red versus green by converting each image to CIELAB colour space, where the a* channel measures the green-to-red shift; it shows that UTEX B481 is more red while UTEX B590 is more green. The average quantum efficiency across the bioprints shows the highest photosynthetic efficiency in the blue region, with the peak at violet light. The spectral-irradiance diagram shows the wavelength range of the three main colours.
Reproducibility
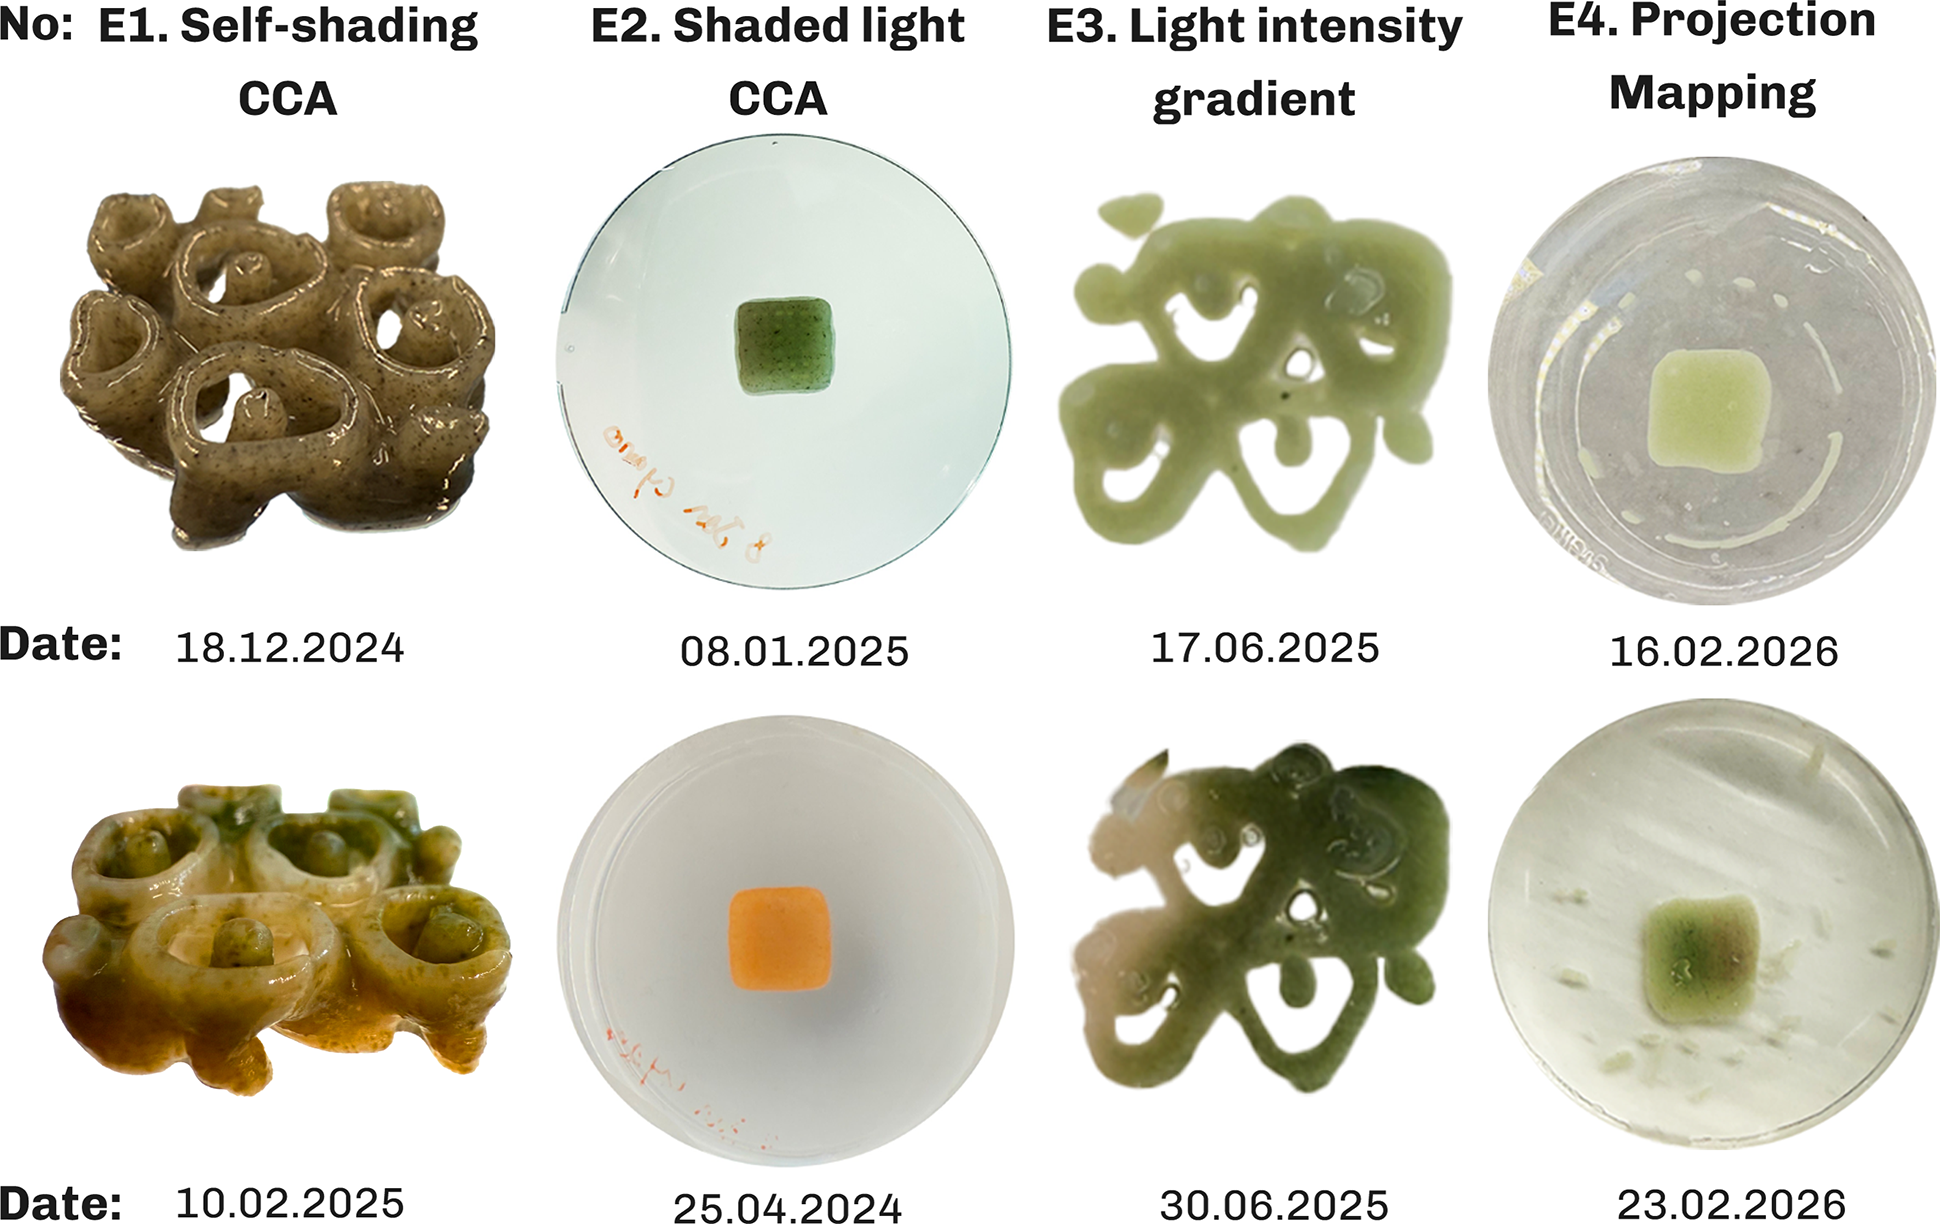
Each experiment was performed at least three times with biological replicate constructs per condition, prepared from a single bioink batch per experiment, to eliminate composition related variability and with all constructs printed on the same Cellink Bio-X bioprinter. Depending on the experiment, different geometries from simple rectangular slabs to complex geometric shapes were tested. Figure 15 shows some of the outcomes from repeated experiments.
Repeated experiments demonstrating reproducibility of the results in the four experiments with F. diplosiphon (UTEX B590).

Figure 15 Long description
Reproducibility experiments, each performed at least three times, validating the outcomes of all four experiments. E1 shows Complementary Chromatic Acclimation (CCA) caused by geometry-induced self-shading; E2 shows CCA produced with a shaded-light setup; E3 shows a growth gradient produced by a light-intensity gradient; and E4 shows green and red projected light producing red and green pigmentation, respectively, on simple slab bioprints.
For E1, the experiment was repeated independently to confirm that the observed CCA response under self-shading reproduced consistently (Figure 15.E1). Since the experiment required geometry-induced self-shading, it could not be performed on simple slab bioprinted construct. The shaded light CCA from E1 was repeated using simple slab bioprints and other geometries revealing similar color outcome as shown in Figure 15.E2. The light intensity gradient from the second experiment is repeated using projection mapping, with both outcomes showing similar results as shown in Figure 15.E3. The projection mapping experiment was similarly tested on multiple geometries from simple slab to complex geometries showing similar color behavior in all experiments. Figure 15.E4 shows the results of green and red projection on simple slab bioprinted constructs resulting in half red and green color in the bioprinted construct accordingly. The combined pattern experiment serves as an internal cross-validation for the intensity and spectrum experiment; as it reproduces both responses on a single construct. Overall, the variability between replicates was low and the reported qualitative observations were consistent across all replicates.
Reversibility
CCA is a reversible process in F. diplosiphon in response to changing ambient light (Gutu and Kehoe Reference Gutu and Kehoe2012; Kumar et al. Reference Kumar, Maurya, Mondal, Sinha, Singh, Mishra, Tiwari and Rai2019). Reversibility experiments performed on the samples revealed that the bioprinted constructs changed color to a uniform green color within one week when the bioprinted sample was moved from projection color pattern to uniform white lighting condition in F. diplosiphon (UTEX B481) (Figure 16). In contrast, F. diplosiphon (UTEX B590) shows only partial reversibility in our experiments which could be due to low viability of cells in long term and requires further experimentation.
Reversibility experiments moving bioprinted constructs from projection mapping light to uniform lighting condition.

Figure 16 Long description
Reversibility experiments testing whether the bioprinted constructs reverse their colour change when moved from a projection-light pattern to uniform light. F. diplosiphon (UTEX B590) showed only partial reversibility, while F. diplosiphon (UTEX B481) reversed fully to green under uniform light.
Discussion
The conducted experiments can be understood in isolation; however, as they build upon each other, they should be seen as a set of tools to design biological functions in photosynthetic living organisms such as F. diplosiphon.
The first experiment using direct illumination of complex bioprinted geometries reproduces patterns analogous to “necrotic core” formation in tissue engineered constructs (Datta et al. Reference Datta, Weiss, Wangpraseurt, Hild, Chen, Golden, Golden and Pokorski2023), where cells in the core region fail to access nutrients and experience oxygen accumulation. In photosynthetic constructs, oxygen accumulation is a concern: rather than being depleted, oxygen is produced internally by photosynthesis and must diffuse out, where the hydrogel matrix permeability is a key constraint (Trampe et al. Reference Trampe, Koren, Akkineni, Senwitz, Krujatz, Lode, Gelinsky and Kühl2018; Wangpraseurt et al. Reference Wangpraseurt, You, Azam, Jacucci, Gaidarenko, Hildebrand, Kühl, Smith, Davey, Smith, Deheyn, Chen and Vignolini2020). Oxygen accumulation was also observed in rectangular bioprinted constructs in E4, which can explain the reason for a necrotic core formation due to both high light intensity and oxygen accumulation within the constructs, while better growth occurs at the construct periphery. For our purposes, the white core is not a failure mode to be eliminated, but a structural feature that was resolved in the next experiments through scaling up the geometry from 2 cm to 5 cm, addressing our available light intensity gradient dimensions while providing better diffusion. Comparing the color in E1 experiment with the red color in E4 experiment, reveals the possibility that the orange color might be produced due to stress-related adjustments of F. diplosiphon producing carotenoid (orange pigment) (Pagels et al. Reference Pagels, Vasconcelos and Guedes2021).
The second experiment displays the possibility to create graded photosynthetic material. It allows understanding optimal light properties, as shown in the E4 light intensity gradient pattern, and therefore designing elements that are graded from biotic to abiotic regions. This enables the creation of materials that are partly structural and partly bioreceptive.
In the third experiment, clearing the living organisms, we can design acellular or light transmitting regions or bioprinted microchannels (Lim et al. Reference Lim, Baptista, Moon, Woodfield and Rnjak-Kovacina2019) that permit deeper light penetration and improve mass transport in densely populated photosynthetic hydrogels (Chua et al. Reference Chua, Smith, Murthy, Murace, Yang, Schertel, Kühl, Cicuta, Smith, Wangpraseurt and Vignolini2024), while also facilitating oxygen transport and release (Maharjan et al. Reference Maharjan, Alva, Cámara, Rubio, Hernández, Delavaux, Correa, Romo, Bonilla, Santiago, Li, Cheng, Ying and Zhang2021). The unexpected gradient in apparent Fv/Fm was also observed from the top-left to bottom-right corner, despite the bioink being homogeneous at the time of printing and UV being the only light source in the dark room. Although spots were exposed sequentially, by the time Fv/Fm was measured, spots a and b had recovered for longer than spots c and d, which may explain the apparent recovery seen at earlier-exposed spots. Moreover, UV light scattering through the Petri dish cover and surrounding water during exposure may have caused diffuse, low-level UV exposure beyond the targeted spots, contributing to the gradient seen in Figure 13. Distinguishing between these two factors would require a control experiment with simultaneous exposure of all spots or with sequential exposure in reverse order, which we did not perform here and leave to future work.
The fourth experiment enables the possibility to design and program the behavior of F. diplosiphon inside the bioprint to trigger CCA or apply photoinhibition and photoactivation through complex light patterns. The two strains tested in projection mapping experiment E4 exhibited markedly different responses to the same projected light patterns. F. diplosiphon (UTEX B481) underwent photoinhibition at intensities where F. diplosiphon (UTEX B590) grew optimally. On the technical side, the experiments also show that the irradiance range of any projection pattern can be calibrated to the strain in use.
Across the four experiments, the same conceptual method recurs: light is treated as a controllable variable and its influence on the cyanobacteria (self-shading, complementary chromatic acclimation, photoactivation and photoinhibition) under different intensity and spectral compositions is reframed as design parameters. While the first three experiments focus on understanding natural behavior, the last experiment focuses on programming and designing with the gained knowledge from natural behavior. This reframing is what connects the work to its architectural aim. At the microscale of a single panel, self-shading combined with photoactivation, and photoinhibition acts as an in vivo marker (Bordowitz and Montgomery Reference Bordowitz and Montgomery2010) of the light within the construct geometry: a thick, dense bioprinted panel will exhibit different patterns of CCA and growth than a thin, open grid exposed to the same illumination, the same way E1 experiment displays necrotic core due to dense geometry, making cellular response an indication of geometric design. At the macroscale, the same mechanisms produce color patterns across a building façade that reveal how much light is absorbed in different regions, distinguishing shaded areas from high-absorption areas, turning the façade into a record of its own light history.
Projection mapping moves our design concept beyond the natural behavior of the cyanobacterium F. diplosiphon to broader ideas in design to create heterogeneous materials. It allows us not only to replicate the behavior of bioprinted constructs on a building façade in the lab environment, but also to design materials with living (biotic) and non-living regions (abiotic), similar to graded cartilage-to-bone transition (Zhang et al. Reference Zhang, Wernig, Duncan, Brüstle and Thomson2001) or reef-building corals, where living tissue grows over a calcium carbonate skeleton(Roth Reference Roth2014). Projection mapping onto bioprinted photosynthetic living materials externally via light, rather than building it into the matrix or relying on emergent self-organization alone, turns light into a runtime design and fabrication parameter, which is programmable, reversible and spatially defined. On a functional level, the photosynthetic activity of the cells in the panels can capture the CO2 in the surrounding area, moving beyond protective and structural conventional elements in architectural design to biologically active elements.
Conclusion
This study demonstrates that projection mapping can be used not only as a visualization technology, but also as a design instrument for photosynthetic, 3D printed living constructs. By combining extrusion-based bioprinting with calibrated, spatially resolved illumination, we show that light can be used to promote growth through photoactivation, induce complementary chromatic acclimation and suppress growth locally through photoinhibition in cyanobacteria-laden hydrogels. In this sense, OC reframes light from a background cultivation condition to a programmable fabrication parameter.
A key contribution is the shift from uniform illumination toward spatiotemporal macroscale control of irradiance and spectral composition of light across 3D constructs. Our results confirm that geometry and photon distribution jointly shape growth and chromatic behavior. However, rather than treating these gradients as unwanted variability, the proposed framework uses them intentionally as controllable design features to create graded living constructs with heterogeneous function and color appearance. The platform also highlights current constraints such as light scattering and attenuation of light in hydrated, translucent matrices that can reduce pattern fidelity in depth and the limitations of the conventional projectors to mainly provide narrow spectrum of light.
Future work
The developed projection mapping method for controlling growth and color of bioprinted photosynthetic living organisms can be coupled with monitoring techniques such as CFI to create a real time feedback loop to adjust lighting conditions to control growth in the bioprinted construct. Paired with bioprinting techniques, each layer of the construct can consist of particles that block or scatter light. This enables the design of microenvironments with varying transparency and properties rather than a homogeneous bioprinted construct, which can pave the way for creating optimal photosynthetic living materials.
Quantitative characterization of in-construct light attenuation and oxygen production in the bioprinted constructs as a function of cell density and matrix composition is an important direction for future work, since it would convert the empirical observations in this study into a predictable design parameter for the structure and function of 3D printed living cell constructs.
Supplementary material
The supplementary material for this article can be found at https://doi.org/10.1017/S2977905726100274
Data availability statement
The authors confirm that the data supporting the findings of this study are available within the article and its supplementary materials.
Author contributions
Conceptualization: S.A; Data curation: S.A; Methodology: S.A; Data Visualization: S.A; Writing original draft: S.A; Investigation: S.A; Writing – review & editing: S.A, M.T, M.K, S.TC, M.RT; Project administration: M.T, M.K, M.RT; Resources: M.T, M.K, M.RT; Software: S.A; Funding acquisition: M.K, S.TC, M.RT; Supervision: M.T, M.K, M.RT; All authors approved the final submitted draft.
Financial support
The research was undertaken in the frame of the Eco-metabolistic Architecture (EMA) project, which has received funding from the European Research Council (ERC) under the European Union’s Horizon 2020 research and innovation program (grant agreement no 101019693; M.RT); additional support was provided by grants from the Gordon and Betty Moore Foundation (Grant no. GBMF9206; https://doi.org/10.37807/GBMF9206; M.K); the Villum Foundation (VIL50371 & VIL57413; M.K); and the Novo Nordisk Foundation (Grant no. NNF24OC0094451; S.TC).
Competing interests
None.
Ethical standards
This study did not involve human participants, human data or animals. Therefore, ethical approval and informed consent were not required under Danish regulations. No personally identifiable information was collected or processed. Data were stored and managed in accordance with institutional data management policies and applicable Danish/EU requirements.


 Open access

