Introduction
Lung cancer is the most commonly diagnosed cancer in Canada, accounting for about 13% of all newly diagnosed cancers and 25% of all cancer deaths in Canada. It is the leading cause of cancer-related mortality in both men and women in North America. 1,Reference Brenner, Weir and Demers2 It is estimated that about 29,800 Canadians will be diagnosed with lung cancer and 21,200 will die from the disease in 2020, which represents an average of 81 newly diagnosed lung cancers and 58 lung cancer mortality every single day, 1,Reference Brenner, Weir and Demers2 respectively. Non-small cell lung cancer (NSCLC) usually starts in the glandular cells on the outer part of the lung or in squamous cells and accounts for about 80–85% of all diagnosed lung cancers. The NSCLC is further subtyped histologically into adenocarcinoma (40%), squamous cell carcinoma (25%) and large cell carcinoma (15%). 1,Reference Polański, Chabowski, Jankowska-Polańska, Janczak and Rosinczuk3,Reference Zheng, Schipper and Kidwell4 Surgery is usually the primary treatment option for early-stage NSCLC when the cancer is localised within the lung and has a 5-year overall survival rate of 50–70%. Reference Infante, Berghmans, Heuvelmans, Hillerdal and Oudkerk5–Reference Strand, Rostad, Møller and Norstein11 However, for patients who may not be suitable candidates for surgery because of advanced age and general frailty, Reference Goldsmith and Gaya10,Reference Xiao, Papiez and Paulus12 lung stereotactic body radiation therapy (SBRT) has been used as an alternative method of treatment. Reference Yu, Dai and Xu7,Reference Wang, Zamdborg, Ye, Grills and Yan9,Reference Goldsmith and Gaya10,Reference Senan, Palma and Lagerwaard13–Reference Rana, Rogers, Pokharel and Cheng33 SBRT has emerged as a novel technique to focally administer high doses of radiation in a small number of fractions to precisely treat malignant target volumes and has been used for the treatment of several cancers, including lung, spine, liver, pancreas, kidney Reference Wang, Zamdborg, Ye, Grills and Yan9,Reference Goldsmith and Gaya10,Reference Sun, Deng and Lu14,Reference Vlachaki, Castellon, Leite, Perkins and Ahmad15,Reference Zhao, Khawandanh and Thomas23,Reference Heinzerling, Anderson and Papiez32 and adrenals. Reference Toesca, Koong, von Eyben, Koong and Chang16 SBRT has been delivered using either three-dimensional conformal radiation therapy (3DCRT), volumetric-modulated arc therapy (VMAT) or intensity-modulated radiation therapy (IMRT). Reference Yu, Dai and Xu7,Reference Wang, Zamdborg, Ye, Grills and Yan9,Reference Goldsmith and Gaya10,Reference Senan, Palma and Lagerwaard13–Reference Rana, Rogers, Pokharel and Cheng33
One of the challenges faced when treating small tumour volumes located within organs that move due to respiration is the management of the target coverage uncertainty associated with considerable tumour motion. Reference Goldsmith and Gaya10,Reference Nagata and Kimura34 Several studies have investigated and implemented different motion management techniques such as abdominal compression, active breathing control and respiratory gating capable of restricting or reducing target motion or tracking the target motion during treatment. Reference Goldsmith and Gaya10,Reference Vlachaki, Castellon, Leite, Perkins and Ahmad15,Reference Heinzerling, Anderson and Papiez32,Reference Mampuya, Matsuo and Ueki35–Reference Shen, Zhang and Wang38 Heinzerling et al. Reference Heinzerling, Anderson and Papiez32 investigated the efficacy of different levels of abdominal compression on tumour and organ motion during SBRT of the lower lobe lung tumours using four-dimensional computer tomography (4DCT) scans and observed a significant reduction in target motion of lower lobe lung cancers. Vlachaki et al. Reference Vlachaki, Castellon, Leite, Perkins and Ahmad15 studied the dosimetric impact of gated computer tomography (CT) treatment plans on tumours and surrounding normal tissues in patients with primary thoracic tumours and reported that 4DCT respiratory gating significantly decreases target volumes and doses to normal tissues.
Aim of study
Our lung SBRT programme started in 2009 using the 3DCRT technique which was designed to be ‘hot’ centrally and with a rapid dose fall-off outside the planning target volume (PTV). We introduced the VMAT technique for faster treatment delivery and with the intent of replicating the 3DCRT dose distribution. The goal of this comprehensive retrospective dosimetric study, therefore, is to compare the target and organ at risk (OAR) dosimetric parameters between the 3DCRT and VMAT treatment plans for two different prescription doses. The mean dose-volume parameters were also compared between the two techniques using the two-tailed Student’s t-test.
Materials and Methods
Patient positioning and treatment simulation
As part of our institutional standard treatment protocol for lung SBRT, patients were positioned supine on a stereotactic board (CIVCO Radiotherapy, Orange City, Iowa, USA) with a body VacLok (CIVCO Radiotherapy, Orange City, Iowa, USA) and knee-fix with arms raised above the head and with the elbows bent inwards to avoid collision with the gantry of the CT. This set-up minimises patients’ movement and ensures set-up reproducibility, and moreover using the VacLok also reduced intra-treatment patient set-up variations. To ensure minimal target motion due to respiration and also depending on patient tolerance, an abdominal compression system (CIVCO Radiotherapy, Orange City, Iowa, USA) with two options (plate or belt) were used for reducing patients’ respiratory motion. Patients then underwent a 4DCT scan with 3-mm slice thickness which included the entire lung volume. After the CT simulation, the respiratory cycles were audited and then reconstructed, and the acquired CT dataset including the free breathing scan and all phases (0, 50, and 100) of the 4DCT scan were then exported to the Eclipse Treatment Planning System (TPS, Varian Medical Systems, Palo Alto, CA, USA).
Targets and OARs volumes
Contouring of the target and all the normal OARs structures was standardised based on institutional guidelines and included the delineation of the internal target volume (ITV), gross tumour volume (GTV), PTV, bilateral lung, heart, spinal canal, great vessels, oesophagus, skin, trachea+proximal bronchial tree (trachea+bronchus) and ribs. The brachial plexus and stomach were contoured on a case-by-case basis. A radiation oncologist contoured the GTV on three breathing phases, 0, 50, and 100 phases, as well as on the average scan, and these contours are combined to form the ITV which was then expanded by 5 mm in all directions to form the PTV and a radiation treatment planner usually contoured the OARs. The trachea and the proximal bronchial tree were usually contoured as one structure. For purposes of dose-volume histogram (DVH) of the bilateral lungs, the GTV was usually subtracted from the bilateral lung contours. The maximum dose to any point 2 cm from the PTV in any direction (D2cm) ring was contoured as the PTV plus 4 cm minus the PTV plus 2 cm and it was used to evaluate the low-dose spillage in the treatment plan.
Radiation treatment planning
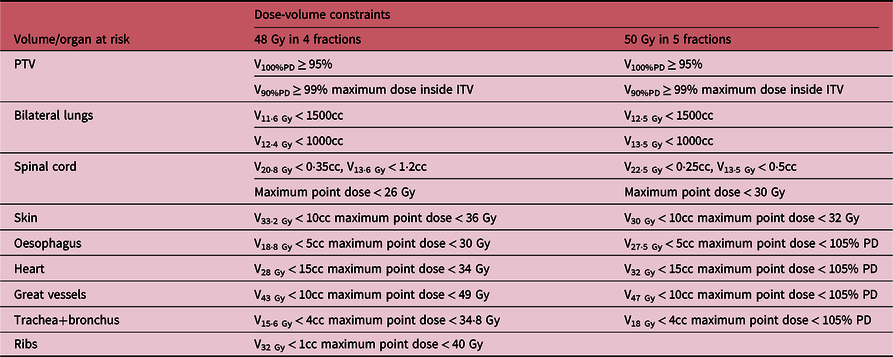
At the initial stages of our SBRT programme, patients were treated with a 3D conformal non-coplanar radiotherapy with 7 to 9, 6-MV or 10-MV flattening filter (FF) beams, and more recently, we introduced 2–3 VMAT arcs using 6-MV or 10-MV flattening filter-free (FFF) beams. The dose was normalised such that Dmax was 100% and within the ITV and prescription isodose chosen (typically 80%) such that at least 95% of the PTV volume was conformally covered by the prescription dose (i.e., V100%PD > 95%) and at least 99% of the PTV volume was covered by 90% of the prescription dose (i.e., V90%PD > 99%). Two dose fractionation schemes were used in this study, namely patients treated with 48 Gy in four fractions (48 Gy/4) and 50 Gy in five fractions (50 Gy/5), and the estimated biological effective doses, assuming α/β ratio of 10 (BED10) for these prescription doses, are 105·6 Gy and 100 Gy, respectively. The target and OARs dose-volume constraints used for both 48 Gy/4 Reference Videtic, Singh and Chang39 and 50 Gy/5 Reference Bezjak, Bradley and Gaspar40 treatment plans are shown in Table 1. All treatment plans were accomplished using the Varian Eclipse Ttreatment Planning System versions 8-13.6 (Varian Medical Systems, Palo Alto, CA, USA) over the 9-year period, and the analytical anisotropic algorithm (AAA) with inhomogeneity corrections was used for dose calculations with a dose grid of 2 mm.
The planning dose-volume constraints Reference Videtic, Singh and Chang39,Reference Bezjak, Bradley and Gaspar40

PD, prescribed dose.
Daily treatment
All patients were set up for daily treatment using the tattoos marked during CT simulation, the treatment room lasers and the abdominal compression system as per CT simulation. All treatments were initially delivered on a Varian Clinac 21EX and later on a Varian TrueBeam Linac (Varian Medical Systems, Palo Alto, CA, USA) with 120-leaf multileaf collimators. Daily cone beam CT (CBCT) image guidance was used for set-up verification, target localisation and patients repositioning for all patients, and the CBCT images are matched with the ITV
Indices for PTV
The plan quality was quantitatively evaluated for each plan by calculating the conformity index (CIRI), Reference Kim, Chung and Kim26,Reference Weyh, Konski, Nalichowski, Maier and Lack27,Reference Videtic, Singh and Chang39–41 heterogeneity index (HI5/95), Reference Weyh, Konski, Nalichowski, Maier and Lack27 the R50% index and the maximum dose to any point 2 cm from the PTV in any direction (i.e., D2cm). Reference Weyh, Konski, Nalichowski, Maier and Lack27,Reference Videtic, Singh and Chang39,Reference Bezjak, Bradley and Gaspar40 The target CIRI and HI5/95 evaluates the dose conformity and heterogeneity, respectively, within the PTV, whereas the R50% and D2cm accesses the dose spillage and fall-off gradient beyond the PTV and are calculated as Reference Kim, Chung and Kim26,Reference Weyh, Konski, Nalichowski, Maier and Lack27,Reference Videtic, Singh and Chang39–41 :
 $$C{I_{RI}} = {{{V_{RI - 100\% }}} \over {TV}}$$
 $$H{I_{5/95}} = {{{D_{5\% }}} \over {{D_{95\% }}}}$$
 $${R_{50\% }} = {{{V_{RI - 50\% }}} \over {TV}}$$
where D5% and D95% are the doses received by 5% and 95% of the PTV, respectively. TV is the target volume (in this case the PTV), VRI-100% and VRI-50% are the volumes of the PTV covered by the reference isodose line (in this case, the 100% isodose line) and the 50% isodose line, respectively. D2cm represents the maximum cumulative dose (as a percentage of the prescription dose) to any point located 2 cm away from the PTV. CI values closest to 1·0 indicate better conformity of dose to the target, and lower R50% ratios and lower D2cm doses indicate greater dose fall-off and better plan conformity.
Statistical analysis
The dosimetric parameters of 263 lung SBRT treatment plans for patients treated over a period of 9 years were retrospectively evaluated. The patients are stratified into two cohorts of those treated using the 3DCRT or VMAT techniques with either a prescription dose of 48 Gy/4 or 50 Gy/5. The quality of each treatment plan was evaluated by examining the extent to which each plan achieved the dosimetric objectives according to institutional criteria (Table 1). The measures of central tendency and dispersion was performed on all the dose parameters using the Excel software and we also analysed the corresponding DVHs for the targets and organs at risks. Data are reported as mean ± SD, median, range (minimum–maximum) doses to the target volumes and the OARs for the two treatment techniques and prescription doses. We also performed a two-tailed Student’s t-test of the means of all the dosimetric parameters for the 3DCRT and VMAT techniques for each dose scheme.
Results and discussions
There were 184 (70%) patients treated with 48 Gy/4 and 79 (30%) patients treated with 50 Gy/5. Amongst the patients treated with 48 Gy/4, 126 (68%) were treated with 3DCRT and 58 (32%) with the VMAT technique, whereas in the 50 Gy/5 cohort, 36 (46%) were treated with 3DCRT and 43 (54%) were treated with the VMAT technique.
Treatment plans dose evaluation
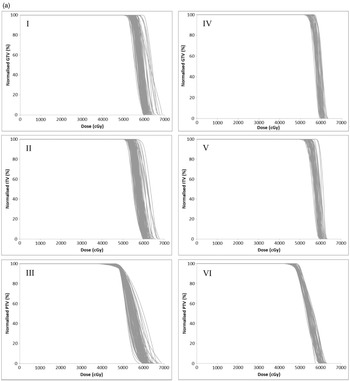
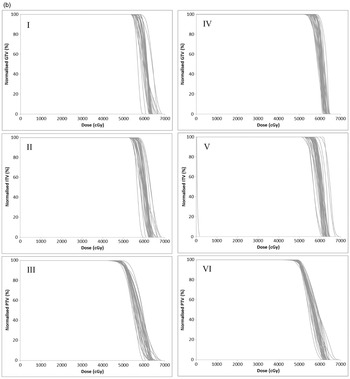
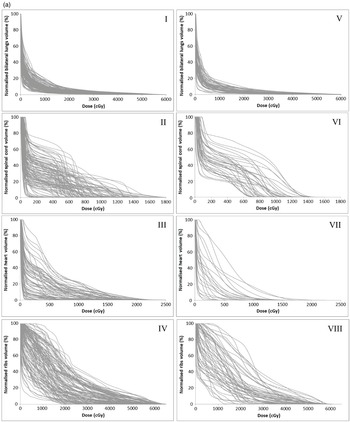
The DVH plots (Figures 1a and 1b to 3a and 3b) for patients’ treatment plans are used to quantitatively assess the acceptability of each treatment plan by examining the extent to which each plan achieved the target dose coverage and OAR dosimetric constraints. For target coverage, a plan is considered acceptable when at least 95% of the PTV volume is covered by the prescription dose (V100%PD > 95%), at least 99% of the PTV volume is covered by 90% of the prescription dose (V90%PD > 99%) and the maximum dose is inside the ITV (Table 1). For the OARs, plan acceptability is determined based on the organ dose-volume constraints (Table 1).
A plot of the dose-volume histograms (DVHs) of the GTV, ITV and PTV for individual patients treated with a prescription dose of 48 Gy in four fractions. Figures I, II and III are DVHs for patients treated with the 3DCRT technique and Figures IV, V and VI are for patients treated with the VMAT technique.

A plot of the dose-volume histograms (DVHs) of the GTV, ITV and PTV for individual patients treated with a prescription dose of 50 Gy in five fractions. Figures I, II and III are DVHs for patients treated with the 3DCRT technique and Figures IV, V and VI are for patients treated with the VMAT technique.

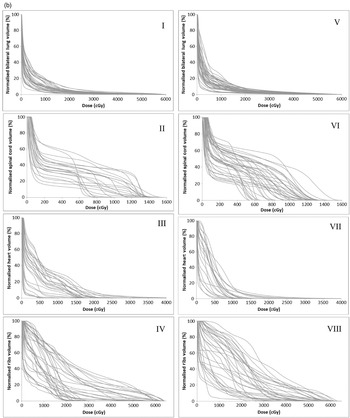
A plot of the dose-volume histograms (DVHs) of the bilateral lungs, spinal cord, heart and ribs for individual patients treated with a prescription dose of 48 Gy in four fractions. Figures I, II, III and IV are DVHs for patients treated with the 3DCRT technique and Figures V, VI, VII and VIII are for patients treated with the VMAT technique.

A plot of the dose-volume histograms (DVHs) of the bilateral lungs, spinal cord, ribs and great vessels for individual patients treated with a prescription dose of 50 Gy in 5 fractions. Figures I, II, III and IV are DVHs for patients treated with the 3DCRT technique and Figures V, VI, VII and VIII are for patients treated with the VMAT technique.

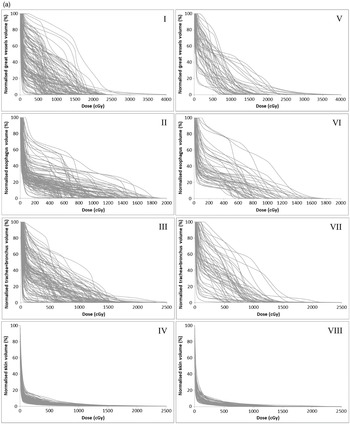
A plot of the dose-volume histograms (DVHs) of the great vessels, oesophagus, trachea+bronchus and skin for individual patients treated with a prescription dose of 48 Gy in four fractions. Figures I, II, III and IV are DVHs for patients treated with the 3D-CRT technique and Figures V, VI, VII and VIII are for patients treated with the VMAT technique.

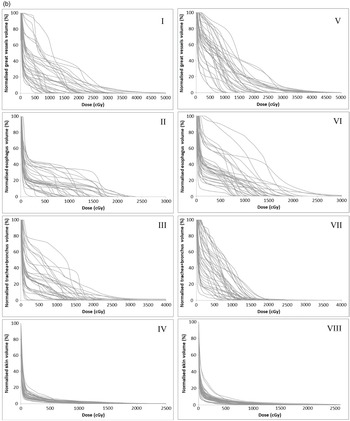
A plot of the dose-volume histograms (DVHs) of the great vessels, oesophagus, trachea+bronchus and skin for individual patients treated with a prescription dose of 50 Gy in five fractions. Figures I, II, III and IV are DVHs for patients treated with the 3D-CRT technique and Figures V, VI, VII and VIII are for patients treated with the VMAT technique.

PTV dose analysis
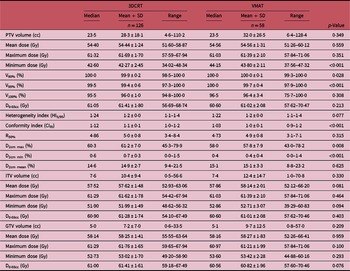
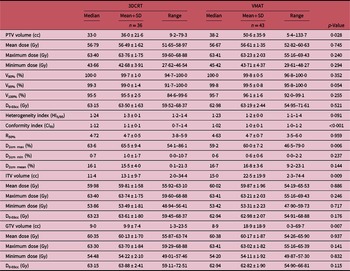
Figures 1a and 1b (I–VI) show the DVHs of the GTV, ITV and PTV for the individual patients treated with prescription doses of 48 Gy/4 and 50 Gy/5, respectively, using 3DCRT (Figures 1a and 1b [I–III]) or the VMAT (Figures 1a and 1b [IV–VI]) technique. A summary of the measures of central tendency and dispersion of the GTV, ITV and PTV volumes, mean, maximum and minimum doses, the PTV V90%, V95%, and V100% for all patients and stratified by the prescription dose of 48 Gy/4 and 50 Gy/5 are shown in Tables 2a and 2b, respectively. The data suggest that adequate conformal target coverage was achieved for all patients which is the main objective of radiation therapy without compromising excessive dose to OARs in order to minimise toxicity. The data show that for patients treated with a prescription dose of 48 Gy/4, the mean PTV V95%, and V100% are 99·4 ± 0·6% and 96·0 ± 1·0%, respectively, for 3DCRT and 99·7 ± 0·4% and 96·4 ± 3·4%, respectively, for VMAT technique (Table 2a). The corresponding PTV V95% and V100% for 50 Gy/5 prescription dose are 99·0 ± 1·4% and 95·5 ± 2·5%, respectively, for 3DCRT and 99·5 ± 0·8% and 96·1 ± 1·6%, respectively, for VMAT technique (Table 2b). The average maximum PTV dose for 48 Gy/4 is 61·7 Gy for 3DCRT and 61·4 Gy for VMAT technique and for the 50 Gy/5, it is 63·8 Gy with 3DCRT and 63·2 Gy with VMAT technique. Although the VMAT technique consistently showed higher PTV coverage, it is unlikely to be clinically significant. A two-tailed Student’s t-test of the PTV mean, maximum and V100% doses indicate no significant difference (p > 0·05) between VMAT and 3DCRT technique for 48 Gy/4; however, it showed a significant difference (p < 0·05) between the two techniques for the PTV minimum, V90% and V95% doses. However, a similar Student’s t-test for 50 Gy/5 showed no significant difference (p > 0·05) between VMAT and 3DCRT techniques’ PTV dosimetric parameters. Adequate target coverage is associated with tumour control which leads to improved biochemical relapse-free survival, cancer progression-free survival and cancer-specific survival. Reference Zheng, Schipper and Kidwell4 Herbert et al. Reference Herbert, Kwa and Nakano24 compared 3DCRT, single-arc VMAT and three non-coplanar partial arcs VMAT SBRT plans at a prescription dose of 48 Gy/4. They reported average maximum PTV doses of 70·3 Gy, 67·5 Gy and 68·9 Gy, and mean PTV doses of 59·6 Gy, 56·9 Gy and 56·9 Gy for 3DCRT, three-arc VMAT and one-arc VMAT treatments plans, respectively. Other investigators Reference Kim, Chung and Kim26,Reference Ong, Verbakel, Cuijpers, Slotman, Lagerwaard and Senan42–Reference Reyngold, Wu and McLane46 have conducted similar dosimetric evaluation of lung SBRT and reported similar results at similar prescription doses. Kim et al. Reference Kim, Chung and Kim26 reported maximum PTV dose of 52·83 ± 2·98 Gy and 54·27 ± 2·13 Gy, mean PTV dose of 48·68 ± 1·51 Gy and 48·16 ± 1·49 Gy, PTV V95% of 95·35 ± 5·53% and 95·31 ± 3·35% and PTV V100% of 86·75 ± 5·81% and 86·50 ± 4·33% for treatment plans using FFF and FF beams, respectively, at a prescription dose of 48 Gy/4. In this study, we observed that both the 3DCRT and VMAT are sufficient techniques to achieve adequate target coverage.
A summary of the measures of central tendency and dispersion of the target volumes, mean, maximum and minimum doses, the PTV volume receiving 90%, 95% and 100% (V90%, V95% and V100%) of the prescribed dose, heterogeneity index (HI5/95), conformity index (CIRI), the R50% and D2cm for all patients treated with 48 Gy in four fractions and stratified by 3DCRT or VMAT technique

A summary of the measures of central tendency and dispersion of the target volumes, mean, maximum and minimum doses, the PTV volume receiving 90%, 95% and 100% (V90%, V95% and V100%) of the prescribed dose, heterogeneity index (HI5/95), conformity index (CIRI), the R50% and D2cm for all patients treated with 50 Gy in five fractions and stratified by 3DCRT or VMAT technique

Dose fractionation schemes of 48–60 Gy in 4–5 fractions are commonly used for treating stage I primary NSCLC and result in high local control rates and low OARs toxicities. Reference Wang, Zamdborg, Ye, Grills and Yan9,Reference Goldsmith and Gaya10,Reference Timmerman, McGarry and Yiannoutsos21–Reference Zhao, Khawandanh and Thomas23,Reference Nagata, Takayama and Matsuo47–Reference Senthi, Haasbeek, Slotman and Senan52 It has been reported that a BED≥100 Gy (assuming α/β ratio of 10) is needed when performing SBRT for stage I primary NSCLC. Reference Wang, Zamdborg, Ye, Grills and Yan9,Reference Goldsmith and Gaya10,Reference Onishi, Araki and Shirato50–Reference Chaudhuri, Tang and Binkley53 According to Park et al., Reference Park, Urm and Cho51 a BED10 > 100 Gy is required to achieve a local tumour control rate > 85% irrespective of the size of the tumour; however, for small tumours < 3 cm, the optimal dose is a range below 150 Gy BED10 and for large tumours > 3 cm, a BED10 > 150 Gy may be needed to achieve adequate tumour control. A systematic review of central lung tumours by Senthi et al. Reference Senthi, Haasbeek, Slotman and Senan52 showed that using fractionation schedules with BED10≥100 Gy can achieve local tumour control rates greater than 85% and Chaudhuri et al. Reference Chaudhuri, Tang and Binkley53 also reported that lung SBRT with BED10≥100 Gy leads to high local tumour control. We estimated the BED10 of 105·6 Gy and 100 Gy for the prescription doses of 48 Gy/4 and 50 Gy/5, respectively, assuming α/β of 10, which are all within the suggested dose range. According to Machtay et al., Reference Machtay, Bae and Movsas54 higher radiotherapy doses are associated with improved local regional control and survival in the chemoradiotherapy settings for locally advanced NSCLC. Singh et al. Reference Singh, Chen and Hare48 reported 1 year and 2 years of local control rates of 93% and 87%, respectively, for patients treated with a mean dose of 50 Gy (range: 40–60 Gy). Reference Singh, Chen and Hare48 Qiao et al. Reference Qiao, Tullgren, Lax, Sirzén and Lewensohn49 conducted a review of 18 studies published from 1988 to 2000 on conventional radiation therapy for the treatment of stage 1 NSCLC and reported that local recurrence was the most common cause of failure. Reference Qiao, Tullgren, Lax, Sirzén and Lewensohn49 However, others have reported that treatment using SBRT resulted in less than 10% local tumour recurrence and about 80% tumour control within the lung lobe and local lymph nodes. Reference Timmerman, McGarry and Yiannoutsos21,Reference Senthi, Lagerwaard, Haasbeek, Slotman and Senan22
OARs dose evaluation
In radiation therapy, the dose to the OARs is usually the dose-limiting factor for the target dose. It is not clear whether one should prioritise target volume coverage or OARs safety in radiation therapy; however, according to Zhao et al. Reference Zhao, Khawandanh and Thomas23 when a compromise is needed, some cancer centres have opted to prioritise OARs constraints by compromising target volume coverage if needed. Reference Zhao, Khawandanh and Thomas23
Bilateral lungs dose analysis
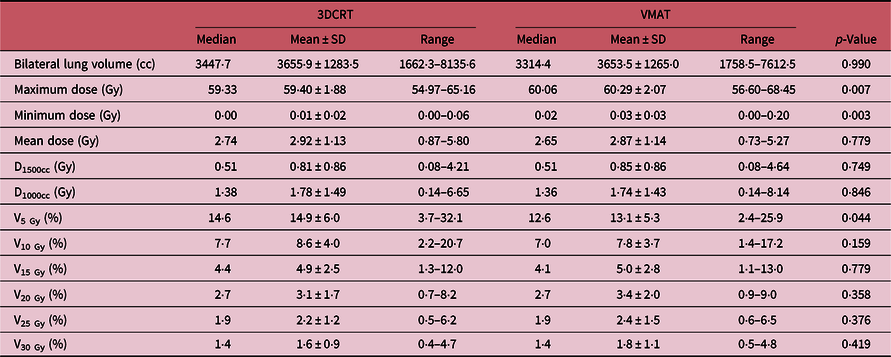
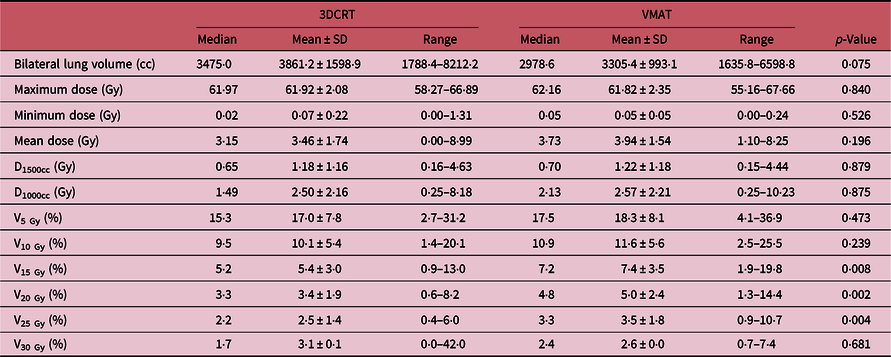
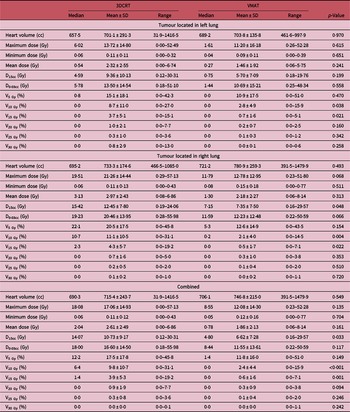
The dose to the bilateral lungs was indexed by V5 Gy, V10 Gy, V15 Gy, V20 Gy, V25 Gy and V30 Gy (i.e., the percentage volume of the bilateral lungs receiving the indicated dose), maximum and mean doses. Tables 3a and 3b show a summary of the measures of central tendency and dispersion of the dose parameters to the bilateral lungs for patients treated with 48 Gy/4 and 50 Gy/5, respectively, and the plot of the lung DVHs for 48 Gy/4 and 50 Gy/5 are also shown in Figures 2a and 2b (I and V), respectively. The bilateral lungs mean V5 Gy, V10 Gy, V15 Gy, V20 Gy, V25 Gy and V30 Gy are 13·1 ± 5·3%, 7·8 ± 3·7%, 5·0 ± 2·8%, 3·4 ± 2·0%, 2·4 ± 1·5% and 1·8 ± 1·1%, respectively, for patients treated with 48 Gy/4 and 18·3 ± 8·1%, 11·6 ± 5·6%, 7·4 ± 3·5%, 5·0 ± 2·4%, 3·5 ± 1·8% and 2·6 ± 0·0% respectively for patients treated with 50 Gy/5 using the VMAT technique (Tables 3a and 3b). A two-tailed Student’s t-test shows no significant difference (p > 0·05) between VMAT and 3DCRT techniques for the bilateral lung mean, D1500cc, D100cc, V10 Gy, V15 Gy, V20 Gy, V25 Gy and V30 Gy doses for 48 Gy/4; however, it indicated a significant difference in the maximum, minimum and V5 Gy doses. A similar Student’s t-test for 50 Gy/5 shows no significant difference between VMAT and 3DCRT techniques for the bilateral lung dosimetric parameters except for V15 Gy, V20 Gy and V25 Gy doses. Several studies Reference Herbert, Kwa and Nakano24,Reference Kim, Chung and Kim26,Reference Weyh, Konski, Nalichowski, Maier and Lack27,Reference Ong, Verbakel, Cuijpers, Slotman, Lagerwaard and Senan42–Reference Reyngold, Wu and McLane46,Reference Kang, Okoye and Patel56 have investigated lung doses during SBRT and have reported similar doses. Herbert et al. Reference Herbert, Kwa and Nakano24 reported mean V5 Gy of 14·92%, 12·58% and 14·81%; V20 Gy of 3·24%, 2·73% and 2·89%; mean lung dose of 2·93 Gy, 2·73 Gy and 2·87 Gy for treatments plans using 3DCRT, three-arc VMAT and a single-arc VMAT techniques respectively at 48 Gy/4 and reported clinically insignificant difference between 3DCRT and VMAT. Kim et al. Reference Kim, Chung and Kim26 on the other hand used a similar prescription dose of 48 Gy/4 and reported V5 Gy of 22·11 ± 6·13% and 22·60 ± 5·61%; V10 Gy of 13·37 ± 4·31% and 13·69 ± 4·69%; V20 Gy of 4·86 ± 1·33% and 5·33 ± 1·36%; and mean lung dose of 4·26 ± 1·14 Gy and 4·44 ± 1·25 Gy for treatments plans using FFF and FF beams, respectively. Weyh et al. Reference Weyh, Konski, Nalichowski, Maier and Lack27 reported mean lung V20 of 6·6 ± 3·7% and 6·32 ± 3·9% for IMRT and rapid arc treatment plans for a prescribed dose of 48 Gy/4. Hrbacek et al. Reference Hrbacek, Lang, Graydon, Klöck and Riesterer43 evaluated lung SBRT dosimetry using FFF and FF beams and reported lung V20 Gy of 3·5 ± 4·8%, 3·7 ± 5·2% and 3·7 ± 5·0% and V12·5 Gy of 6·9 ± 7·9%, 7·2 ± 8·2% and 7·2 ± 8% for 6-MV FFF, 6-MV FF and 10-MV FFF beams, respectively, for prescribed dose of 50 Gy/5.
A summary of the measures of central tendency and dispersion of the lung volume, maximum, minimum and mean doses, the dose to 1500cc and 1000cc of the lung volume, and normalised lung volume receiving 5 Gy, 10 Gy, 15 Gy, 20 Gy, 25 Gy and 30 Gy for all patients treated with 48 Gy in four fractions and stratified into patients treated with 3DCRT and VMAT

A summary of the measures of central tendency and dispersion of the lung volume, maximum, minimum and mean doses, the dose to 1500cc and 1000cc of the lung volume, and normalised lung volume receiving 5 Gy, 10 Gy, 15 Gy, 20 Gy, 25 Gy and 30 Gy for all patients treated with 50 Gy in five fractions and stratified into patients treated with 3DCRT and VMAT

Herbert et al. Reference Herbert, Kwa and Nakano24 reported that when assessing planning techniques such as IMRT where higher volumes of tissue are exposed to low-dose radiation, the mean lung dose may be a better predictor of toxicity than the traditional measure of lung V20 Gy and Kang et al. Reference Kang, Okoye and Patel56 indicated that the best-supported dosimetric parameter that correlates with radiation pneumonitis is the mean lung dose, followed by the lung V5 Gy and V20 Gy. It has been reported that the risk of radiation pneumonitis is of concern as it is one of the most important and serious complications resulting from radiation therapy of lung cancer Reference Herbert, Kwa and Nakano24,Reference Inoue, Kunitoh, Sekine, Sumi, Tokuuye and Saijo55–Reference Chia and Master58 and can lead to severe respiratory dysfunction and even death. Reference Inoue, Kunitoh, Sekine, Sumi, Tokuuye and Saijo55 According to Chen et al., Reference Chen, Wu and Ning57 radiation-induced pulmonary fibrosis is a common complication in patients with lung and breast cancer after receiving thoracic radiotherapy with an average incidence of 16–28% after radiotherapy. Reference Chen, Wu and Ning57 Shen et al. Reference Shen, Liu and Jin44 investigated the association of lung dosimetric parameters with overall survivor in 130 NSCLC patients treated with VMAT technique and reported that radiation pneumonitis is associated with overall survivor for patients with stage III NSCLC who received VMAT treatment plan.
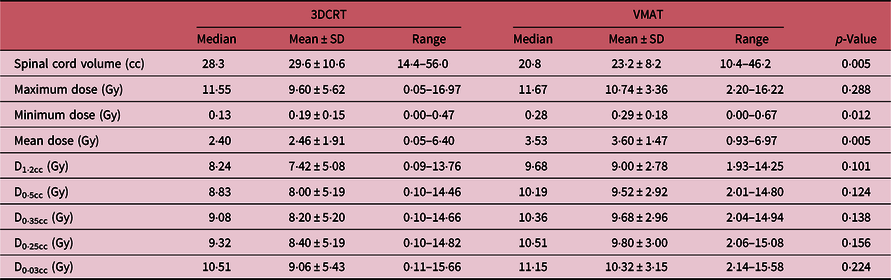
Spinal cord dose analysis
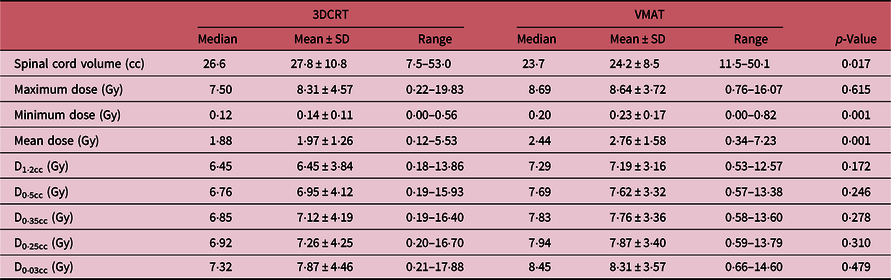
The dose metrics used to evaluate the dose to the spinal cord include the maximum, minimum, mean doses and the dose to 0·03cc, 0·25cc, 0·35cc, 0·5cc and 1·2cc of the cord volume. A summary of the measures of central tendency and dispersion of these parameters for all patients and stratified into those treated using 3DCRT and VMAT with 48 Gy/4 and 50 Gy/5 are shown in Tables 4a and 4b. The plot of the spinal cord DVHs for 48 Gy/4 and 50 Gy/5 are also shown in Figures 2a and 2b (II and VI), respectively. The average maximum cord dose for 48 Gy/4 using 3DCRT and VMAT techniques are 8·3 ± 4·6 Gy and 8·6 ± 3·7 Gy, respectively, and the corresponding values for 50 Gy/5 for 3DCRT and VMAT techniques are 9·6 ± 5·6 Gy and 10·7 ± 3·4, respectively. A two-tailed Student’s t-test shows no significant difference (p > 0·05) between VMAT and 3DCRT techniques for both 48 Gy/4 and 50 Gy/5 for the spinal cord maximum, D1·2cc, D0·5cc, D0·35cc, D0·25cc and D0·03cc doses but indicated a significant difference (p < 0·05) in the maximum and mean cord doses. Herbert et al. Reference Herbert, Kwa and Nakano24 reported maximum cord dose of 5·31 Gy, 4·36 Gy and 8·96 Gy for 3DCRT, three-arc VMAT and single-arc VMAT, respectively, at 48 Gy/4. Kim et al. Reference Kim, Chung and Kim26 also reported maximum cord dose of 8·40 ± 2·19 Gy and 8·45 ± 1·73 Gy for treatment plans using FFF and FF beams, respectively, at prescription dose of 48 Gy/4. Weyh et al. Reference Weyh, Konski, Nalichowski, Maier and Lack27 on the other hand reported mean spinal cord dose of 13·9 ± 9·7 Gy and 14·25 ± 7·7 Gy for IMRT and rapid arc treatment plans at 48 Gy/4 and in a study by Cong et al., Reference Cong, Sun and Wang45 they reported maximum cord dose of 14·1 (2·8–35·4) Gy. Hrbacek et al. Reference Hrbacek, Lang, Graydon, Klöck and Riesterer43 investigated the delivery accuracy for FFF and FF beams for SBRT of early-stage lung cancer and reported spinal cord doses of 13·6 ± 9·3 Gy, 13·3 ± 9·8 Gy and 14·4 ± 9·2 Gy for 6-MV FFF, 6-MV FF and 10-MV FFF beams, respectively. In a recent review, Sahgal et al. Reference Sahgal, Chang and Ma59 reported that spinal cord maximum point doses of 12·4–14·0 Gy delivered in one fraction, 17·0 Gy in two fractions, 20·3 Gy in three fractions, 23·0 Gy in four fractions and 25·3 Gy in five fractions are estimated to be associated with a 1% to 5% risk of radiation myelopathy.
A summary of the measures of central tendency and dispersion of the spinal cord volume, maximum, minimum and mean doses, and the dose to 1·2cc, 0·5cc, 0·35cc, 0·25cc and 0·03cc of the spinal cord volume for all patients treated with 48 Gy in four fractions and stratified into patients treated with 3DCRT and VMAT

A summary of the measures of central tendency and dispersion of the spinal cord volume, maximum, minimum and mean doses, and the dose to 1.2cc, 0.5cc, 0.35cc, 0.25cc and 0.03cc of the spinal cord volume for all patients treated with 50 Gy in five fractions and stratified into patients treated with 3DCRT and VMAT

Heart dose analysis
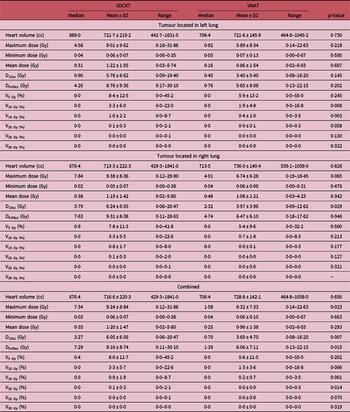
The dosimetric parameters used to evaluate the cardiac exposure include the heart V5 Gy, V10 Gy, V15 Gy, V20 Gy, V25 Gy and V30 Gy, maximum, minimum and mean doses and the dose to 15cc and 0·03cc of the heart volume. Tables 5a and 5b show a summary of the measures of central tendency and dispersion of dosimetric parameters for all patients treated with 48 Gy/4 and 50 Gy/5, respectively, and stratified into patients treated with the target located in the left and right lungs. The plot of the heart DVHs for 48 Gy/4 and 50 Gy/5 are also shown in Figures 2a and 2b (III and VII), respectively. The average maximum and average mean dose to the heart for all patients treated with 48 Gy/4 are 9·2 ± 8·8 Gy and 1·2 ± 1·5 Gy, respectively, for 3DCRT and 6·3 ± 7·3 Gy and 1·0 ± 1·4 Gy, respectively, for VMAT plans (Table 5a). The corresponding doses for 50 Gy/5 are 17·1 ± 14·9 Gy and 2·6 ± 2·5 Gy, respectively, for 3DCRT and 12·1 ± 14·3 Gy and 1·9 ± 2·1 Gy, respectively, for VMAT (Table 5b). The mean dose to 15cc and 0·03cc of the heart volume at 48 Gy/4 are 6·1 ± 6·6 Gy and 9·1 ± 8·7 Gy, respectively, for 3DCRT and 3·7 ± 4·7 Gy and 6·1 ± 7·1 Gy, respectively, for VMAT (Table 5a) and the corresponding doses at 50 Gy/5 are 10·7 ± 9·2 Gy and 16·6 ± 14·5 Gy, respectively, for 3DCRT and 6·6 ± 7·3 Gy and 11·6 ± 13·6 Gy, respectively, for VMAT (Table 5b). The heart V5 Gy, V10 Gy, V15 Gy and V20 Gy for 48 Gy/4 are 8·0 ± 11·7%, 3·3 ± 5·7%, 0·9 ± 1·9% and 0·1 ± 0·3%, respectively, for 3DCRT and 5·6 ± 11·5%, 1·3 ± 3·6%, 0·2 ± 0·7% and 0·0 ± 0·0%, respectively, for VMAT. The corresponding doses for 50 Gy/5 are 17·5 ± 17·8%, 9·8 ± 10·7%, 3·9 ± 5·3% and 0·9 ± 1·9%, respectively, for 3DCRT and 11·8 ± 16·0%, 2·4 ± 4·4%, 0·6 ± 1·6% and 0·3 ± 0·9%, respectively, for VMAT. For all the dosimetric parameters used to evaluate the cardiac exposure, the VMAT technique consistently resulted in relatively lower doses. However, a two-tailed Student’s t-test shows that there is no significant difference (p > 0·05) between VMAT and 3DCRT techniques for the heart minimum, mean, V5 Gy, V25 Gy and V30 Gy doses for 48 Gy/4. Nevertheless, a similar Student’s t-test for 50 Gy/5 indicates a significance difference between VMAT and 3DCRT for the D15cc, V10 Gy and V15 Gy doses. Herbert et al. Reference Herbert, Kwa and Nakano24 reported maximum heart dose of 12·19 Gy, 10·01 Gy and 9·92 Gy for 3DCRT, three-arc VMAT and single-arc VMAT techniques, respectively, for 48 Gy/4. Kim et al. Reference Kim, Chung and Kim26 also reported maximum heart dose of 12·36 ± 9·58 Gy and 12·46 ± 9·47 Gy for treatment techniques using FFF and FF beams at prescription of 48 Gy/4. Weyh et al. Reference Weyh, Konski, Nalichowski, Maier and Lack27 on the other hand reported heart dose of 10·93 ± 12·2 Gy and 9·72 ± 11·9 Gy for IMRT and rapid arc treatment plans, respectively, at a prescription of 48 Gy/4. Hrbacek et al. Reference Hrbacek, Lang, Graydon, Klöck and Riesterer43 investigated lung SBRT dosimetry plans prescribed to 50 Gy/5 and generated using FFF and FF and reported heart doses of 7·2 ± 6·8 Gy, 7·1 ± 6·8 Gy and 7·8 ± 7·2 Gy for 6-MV FFF, 6-MV FF and 10-MV FFF beams, respectively.
A summary of the measures of central tendency and dispersion of the heart volume, maximum, minimum and mean doses, the dose to 15cc and 0·03cc of the heart volume, and normalised heart volume receiving 5 Gy, 10 Gy, 15 Gy, 20 Gy, 25 Gy and 30 Gy for all patients treated with 48 Gy in four fractions and stratified into patients treated with the target located in the left and right lungs using 3DCRT and VMAT techniques

A summary of the measures of central tendency and dispersion of the heart volume, maximum, minimum and mean doses, the dose to 15cc and 0·03cc of the heart volume, and normalised heart volume receiving 5 Gy, 10 Gy, 15 Gy, 20 Gy, 25 Gy and 30 Gy for all patients treated with 50 Gy in five fractions and stratified into patients treated with the target located in the left and right lungs using 3DCRT and VMAT techniques

Shen et al. Reference Shen, Liu and Jin44 investigated the association of heart dosimetric parameters with overall survivor in 130 NSCLC patients treated with VMAT and a median prescription dose of 40–70 Gy and reported heart V5 Gy, V15 Gy, V25 Gy and V30 Gy of 54·1 ± 29·9%, 37·4 ± 24·7%, 25·1 ± 17·3% and 20·1 ± 14·0%, respectively. Ming et al. Reference Ming, Feng, Liu, Zhang, Zhou and Deng60 reported that the risk of long-term cardiac mortality is found to be directly correlated with the mean dose to the heart, maximum heart dose, as well as V25 Gy and V30 Gy of the heart. Reference Reyngold, Wu and McLane46,Reference Ming, Feng, Liu, Zhang, Zhou and Deng60 Moreover, with large prescription doses for the treatment of NSCLC, the radiation dose to a fraction of the heart volume incidentally irradiated by the treatment beams could be significant, depending on the location of the tumour and its involvement of the mediastinal lymph nodes. Furthermore, Bradley et al. Reference Bradley, Hu and Komaki61 has reported that recent clinical trial in lung cancer treatment has showed that a patient’s survival after lung cancer treatment is closely related to the amount of radiation delivered to the heart. Shen et al. Reference Shen, Liu and Jin44 has also indicated that the heart V15 Gy is associated with overall survivor for patients with stage III NSCLC treated with VMAT. Therefore, it is important to limit the dose to the heart to avoid long-term radiation complications for younger patients and to control cardiac toxicity.
Ribs dose analysis
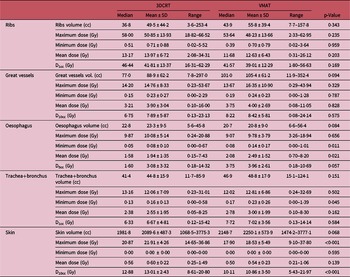
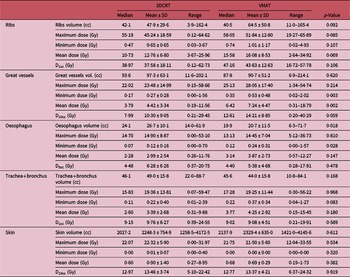
The dose to the ribs was evaluated using the maximum, minimum and mean dose to the ribs and the dose to 1cc of the rib volume. A summary of the measures of central tendency and dispersion of these dosimetric parameters for patients receiving 48 Gy/4 and 50 Gy/5 are shown in Tables 6a and 6b, respectively. The plot of the ribs DVHs for 48 Gy/4 and 50 Gy/5 are also shown in Figures 2a and 2b (IV and VIII), respectively. The average maximum dose to the ribs at 48 Gy/4 for 3DCRT and VMAT are 50·9 ± 13·9 Gy and 48·2 ± 13·7 Gy, respectively, (Table 6a) and the corresponding doses for 50 Gy/5 are 45·2 ± 18·6 Gy for 3DCRT and 51·8 ± 12·8 Gy for VMAT (Table 6b). The average mean doses are 14·0 ± 6·7 Gy for 3DCRT and 12·6 ± 6·4 Gy for VMAT for 48 Gy/4 and 12·8 ± 6·8 Gy for 3DCRT and 16·1 ± 8·5 for VMAT for 50 Gy/5. A two-tailed Student’s t-test shows no significant difference (p > 0·05) between VMAT and 3DCRT techniques for all the ribs dosimetric parameters for both 48 Gy/4 and 50 Gy/5 prescription doses. Herbert et al. Reference Herbert, Kwa and Nakano24 reported rib maximum doses of 55·48 Gy, 54·03 Gy and 51·19 Gy for 3DCRT, three-arc VMAT and single-arc VMAT treatments plans, respectively, at 48 Gy/4. Pokhrel et al. Reference Pokhrel, Sood and Badkul62 evaluated Monte Carlo-generated dose distributions in the treatment of peripheral lung cancer using SBRT and reported rib average maximum dose of 50·9 ± 6·4 Gy and average mean dose to 1cc of rib volume of 41·6 ± 5·6 Gy for 50 Gy/5 prescribed dose. Hrbacek et al. Reference Hrbacek, Lang, Graydon, Klöck and Riesterer43 on the other hand reported ribs mean doses of 47·8 ± 28·8 Gy, 48·2 ± 27·9 Gy and 49·1 ± 29·1 Gy for 6-MV FFF, 6-MV FF and 10-MV FFF beams. Taremi et al. Reference Taremi, Hope and Lindsay63 investigated the clinical and dosimetric factors associated with radiotherapy-induced bone injury following lung SBRT and reported average maximum point dose of 48·5 ± 24·3 Gy and 10·5 ± 10·2 Gy in fractured ribs and non-fractured ribs, respectively. Furthermore, they reported that D0·5cc, and V25 Gy were significantly associated with radiotherapy-induced bone injury.
A summary of the measures of central tendency and dispersion of the dosimetric parameters for the ribs, great vessels, oesophagus, trachea+bronchus and skin for patients receiving 48 Gy in four fractions and stratified by patients treated with 3DCRT or VMAT technique

A summary of the measures of central tendency and dispersion of the dosimetric parameters for the ribs, great vessels, oesophagus, trachea+bronchus and skin for patients receiving 50 Gy in five fractions and stratified by patients treated with 3DCRT or VMAT technique

Pettersson et al. Reference Pettersson, Nyman and Johansson64 reported that D2cc above 50 Gy and 27 Gy in three fractions are associated with fracture rate of 50% and 5%, respectively. Asai et al. Reference Asai, Shioyama and Nakamura65 also estimated fracture rate in 3 years to be approximately 50% when maximum rib dose, V40, or V30 was higher than 42·4 Gy, 0·29cc or 1·35cc, respectively. Furthermore, they reported that a high dose in a small volume is more important to predict the risk of rib fracture than a lower dose in a larger volume in hypo-fractionated SBRT. Kang et al. Reference Kang, Okoye and Patel56 and Chia et al. Reference Chia and Master58 reported that the dosimetric parameters predictive of radiation-induced rib fracture include chest wall dose ≥30 Gy to 70cc, dose to 2cc of the chest wall and maximum dose to the rib or chest wall >50 Gy. Tomé et al. Reference Tomé, Hodge, Mehta and Bentzen66 estimated the incidence of rib fractures as a function of maximum absorbed rib dose after SBRT for the early-stage lung cancer and concluded that the maximum rib dose should be carefully considered in SBRT with appropriate risk counselling of patients whose maximum rib dose exceeds 50 Gy in five fractions which is estimated to be associated with a 6·6% risk of rib fracture. Although, Aoki et al. Reference Aoki, Sato and Hirose67 who examined incidence and risk factors of radiation-induced rib fracture after SBRT using moderate fraction sizes for patients with peripherally located lung tumour reported that the doses and fractionations (54–56 Gy in 9–7 fractions) used in their study resulted in no clinically significant rib fractures, but higher maximum dose and dose per fraction treatments resulted in an increase in asymptomatic grade 1 rib fractures.
Great vessels’ dose analysis
The dose to the great vessels was evaluated using the maximum, minimum and mean dose to the great vessels and the dose to 10cc of the volume, and a summary of the measures of central tendency and dispersion of these dosimetric parameters for patients receiving 48 Gy/4 and 50 Gy/5 are shown in Tables 6a and 6b, respectively. The plot of the great vessels’ DVHs for 48 Gy/4 and 50 Gy/5 are also shown in Figures 3a and 3b (I and V), respectively. The average maximum doses to the great vessels for 48 Gy/4 are 14·8 ± 8·3 Gy for 3DCRT and 16·3 ± 10·9 Gy for VMAT and for 50 Gy/5 are 23·5 ± 15·0 Gy for 3DCRT and 28·1 ± 17·4 Gy for VMAT. The average mean doses are 3·9 ± 3·0 Gy for 3DCRT and 4·0 ± 2·7 Gy for VMAT at 48 Gy/4 and 4·4 ± 3·3 Gy for 3DCRT and 7·2 ± 4·5 Gy for VMAT at 50 Gy/5. A two-tailed Student’s t-test shows no significant difference (p > 0·05) between VMAT and 3DCRT techniques for the great vessels’ dosimetric parameters for the two prescription doses except for the minimum and mean dose for 50 Gy/5 where it indicated a significant difference between the two techniques. Herbert et al. Reference Herbert, Kwa and Nakano24 reported maximum doses of 12·61 Gy, 8·48 Gy and 11·20 Gy for 3DCRT, three-arcs VMAT and single-arc VMAT treatment plans, respectively, at a 48 Gy/4. Hrbacek et al. Reference Hrbacek, Lang, Graydon, Klöck and Riesterer43 compared the accuracy of FFF and FF beams for SBRT and reported great vessels’ doses of 15·1 ± 17·0 Gy, 15·2 ± 17·8 Gy and 15·4 ± 17·6 Gy for 6-MV FFF, 6-MV FF and 10-MV FFF beams, respectively, at 50 Gy/5. Chia et al. Reference Chia and Master58 reviewed the common toxicities reported in the literature in relation to SBRT of lung tumours as well as factors that may alter these risks and reported that radiation damage to the great vessels can result in haemoptysis, exsanguination secondary to rupture, aortic aneurysms or dissection and pulmonary haemorrhage. Furthermore, a dose-response model for the great vessels based on a total of 625 cases shows that at maximum doses of 52·5 Gy/5 and 45 Gy/3 the risk of grade 3–5 toxicity was 1·2% and 2·3%, respectively.
Oesophagus dose analysis
Radiation-induced oesophagitis (inflammation of the oesophagus) is the most common local acute toxicity of radiotherapy in patients who receive treatment to the chest area. Reference Chia and Master58,Reference Baker and Fairchild68 Baker and Fairchild Reference Baker and Fairchild68 reported that the factors that contribute to radiotherapy-induced oesophageal toxicity include the volume of tissue irradiated, total dose, dose per day, overall treatment time, concurrent systemic therapy and the radiotherapy technique employed. However, the use of VMAT or 3DCRT techniques can potentially reduce the dose to the oesophagus and minimise the toxicity. We evaluated the dose to the oesophagus for lung SBRT using the maximum, minimum, mean doses and the dose to 5cc of the organ volume, and a summary of the measures of central tendency and dispersion of these dosimetric parameters for patients receiving 48 Gy/4 and 50 Gy/5 are shown in Tables 6a and 6b, respectively. The plot of the oesophagus DVHs for 48 Gy/4 and 50 Gy/5 are also shown in Figures 3a and 3b (II and VI), respectively. The estimated average maximum and average mean doses for 48 Gy/4 are 10·1 ± 5·1 Gy and 1·9 ± 1·3 Gy, respectively, for 3DCRT and 9·8 ± 3·8 Gy and 2·5 ± 1·5 Gy, respectively, for VMAT. The corresponding doses for 50 Gy/5 are 14·9 ± 8·9 Gy and 3·0 ± 2·5 Gy, respectively, for 3DCRT and 14·5 ± 7·0 Gy and 3·9 ± 2·7 Gy, respectively, for VMAT. A two-tailed Student’s t-test shows no significant difference (p > 0·05) between VMAT and 3DCRT techniques for the oesophagus dosimetric parameters for both prescription doses except for the minimum and mean doses for 48 Gy/4 and minimum dose for 50 Gy/5. Herbert et al. Reference Herbert, Kwa and Nakano24 reported maximum doses of 3·21 Gy, 6·47 Gy and 10·49 Gy for 3DCRT, three-arc VMAT and single-arc VMAT treatment plans at a prescription dose of 48 Gy/4. Weyh et al. Reference Weyh, Konski, Nalichowski, Maier and Lack27 also reported mean doses of 11·62 ± 5·7 Gy and 14·12 ± 6·5 for IMRT and rapid arc treatment plans at a prescribed dose of 48 Gy/4 and Hrbacek et al. Reference Hrbacek, Lang, Graydon, Klöck and Riesterer43 reported oesophagus dose of 9·6 ± 8·7 Gy, 9·7 ± 9·4 Gy and 9·8 ± 8·9 Gy for 6-MV FFF, 6-MV FF and 10-MV FFF beams, respectively. Cong et al. Reference Cong, Sun and Wang45 reviewed the outcomes and toxicity of SBRT in patients with advanced stage ultra-central NSCLC and reported maximum dose of 23·9 Gy and D5cc of 13·3 Gy for mean prescription dose of 35 Gy in five fractions.
Trachea+proximal bronchial tree dose analysis
The dosimetric parameters used to evaluate the dose to the trachea+bronchus include the maximum, minimum and mean dose and the dose to 4cc of the volume of the trachea+bronchus. A summary of the measures of central tendency and dispersion of these dosimetric parameters for patients receiving 48 Gy/4 and 50 Gy/5 are shown in Tables 6a and 6b, respectively. The plot of the trachea+bronchus DVHs for 48 Gy/4 and 50 Gy/5 are also shown in Figures 3a and 3b (III and VII), respectively. The estimated average maximum dose to the trachea+bronchus at 48 Gy/4 are 12·1 ± 7·1 Gy for 3DCRT and 12·8 ± 6·9 Gy for VMAT and at 50 Gy/5 are 19·4 ± 13·8 Gy for 3DCRT and 19·2 ± 14·4 Gy for VMAT. The average mean doses at 48 Gy/4 are 2·6 ± 2·0 Gy for 3DCRT and 3·0 ± 2·0 Gy for VMAT and at 50 Gy/5 are 3·4 ± 2·7 Gy for 3DCRT and 4·3 ± 2·9 Gy for VMAT. A two-tailed Student’s t-test shows no significant difference (p > 0·05) between VMAT and 3DCRT techniques for the trachea+bronchus dose parameters for both prescription doses except the minimum dose for 48 Gy/4. Herbert et al., Reference Herbert, Kwa and Nakano24 reported bronchus maximum dose of 11·61 Gy, 12·60 Gy and 16·76 Gy for 3DCRT, three-arc VMAT and single-arc VMAT treatment plans, respectively, for a 48 Gy/4 prescription dose. Hrbacek et al. Reference Hrbacek, Lang, Graydon, Klöck and Riesterer43 investigated the delivery accuracy of FFF and FF beams for SBRT of early-stage lung cancer and reported trachea+bronchus doses of 12·9 ± 19·4 Gy, 13·2 ± 20·3 Gy and 13·4 ± 20·5 Gy for 6-MV FFF, 6-MV FF and 10-MV FFF beams, respectively, for a 50 Gy/5. Murrell et al. Reference Murrell, Laba, Erickson, Millman, Palma and Louie69 performed a modelling SBRT study prescribed to 50 Gy/5 to evaluate the trade-offs between prioritising target coverage for local tumour control or OARs dose for likelihood of toxicity. They reported maximum proximal bronchial tree doses of 60·1 Gy and D1cc of 47·2 Gy when PTV coverage is prioritised and 36·9 Gy and D1cc of 25·4 Gy when OAR constraints are prioritised. Lischalk et al. Reference Lischalk, Malik, Collins, Collins, Matus and Anderson70 investigated CyberKnife SBRT of high-risk central pulmonary metastases patients treated with a total dose of 35 or 40 Gy in five fractions and reported that late grade 2 or higher atelectasis was the most common treatment-related toxicity and was significantly associated with maximum dose to the mainstem bronchus, and gross endobronchial involvement was associated with significantly lower overall survival. They concluded that 35–40 Gy in five fractions is a safe and effective management strategy for high-risk pulmonary metastatic lesions, though care should be taken to limit the maximum point dose to the mainstem bronchus.
Skin dose analysis
The dosimetric parameters used to evaluate the dose to the skin include the maximum, minimum and mean dose to the skin and the dose to 10cc of the skin volume and a summary of the measures of central tendency and dispersion of these dosimetric parameters for patients receiving 48 Gy/4 and 50 Gy/5 are shown in Tables 6a and 6b, respectively. The plot of the skin DVHs for 48 Gy/4 and 50 Gy/5 are also shown in Figures 3a and 3b (IV and VIII), respectively. The average maximum dose and the average mean doses to the skin at 48 Gy/4 are 21·9 ± 4·3 Gy and 0·6 ± 0·2, respectively, for 3DCRT and 18·5 ± 5·5 Gy and 0·5 ± 0·2, respectively, for VMAT. The corresponding doses at 50 Gy/5 are 22·3 ± 5·9 Gy and 0·9 ± 1·4 respectively for 3DCRT and 21·5 ± 5·6 Gy and 0·7 ± 0·3 respectively for VMAT. A two-tailed Student’s t-test shows no significant difference (p > 0·05) between VMAT and 3DCRT techniques for the skin dosimetric parameters for both prescription doses except the maximum and D10cc doses for 48 Gy/4. Herbert et al., Reference Herbert, Kwa and Nakano24 estimated a maximum skin dose of 18·0 Gy, 12·8 Gy and 12·4 Gy for 3DCRT, three-arc VMAT and single-arc VMAT treatment plans, respectively, for a 48 Gy/4 prescription. Hoppe et al. Reference Hoppe, Laser and Kowalski71 examined the rate of acute skin toxicity of 50 early-stage NSCLC patients treated with 60 Gy in three fractions or 44–48 Gy in four fractions and also investigated the factors that might predict skin toxicity. They reported that limited number of coplanar beams, distance from the tumour to the posterior chest wall skin of less than 5 cm and a maximum skin dose of 50% or higher of the prescribed dose are factors associated with grade 2 or higher acute skin toxicity. Reference Kang, Okoye and Patel56,Reference Hoppe, Laser and Kowalski71
Evaluation of plan quality
We quantitatively assessed the quality of the treatment plans by calculating the CIRI, HI5/95, R50% and D2cm for each plan, and a summary of the measures of central tendency and dispersion of CIRI, HI5/95, R50% and D2cm for all treatment plans and stratified by the prescription dose of 48 Gy/4 and 50 Gy/5 are shown in Tables 2a and 2b, respectively. The CIRI and HI5/95 for the PTV for patients treated with 48 Gy/4 are 1·1 ± 0·1 and 1·2 ± 0·0 respectively for 3DCRT plans and 1·0 ± 0·1 and 1·2 ± 0·0 respectively for VMAT plans. The corresponding values for patients treated with 50 Gy/5 are 1·1 ± 0·1 and 1·3 ± 0·1 respectively for 3DCRT plans and 1·0 ± 0·1 and 1·2 ± 0·0 respectively for VMAT plans (Tables 2a and 2b). The mean R50% and D2cm for plans prescribed to 48 Gy/4 are 5·0 ± 0·8 and 61·2 ± 7·0% respectively for 3DCRT and 4·9 ± 0·8 and 57·8 ± 7·9% respectively for VMAT plans. The corresponding values for treatment plans prescribed to 50 Gy/5 are 4·7 ± 0·5 and 65·5 ± 9·4% respectively for 3DCRT and 4·7 ± 0·7 and 60·0 ± 7·2% respectively for VMAT plans (Tables 2a and 2b). When the CIRI values are close to 1·0, it indicates better conformity of dose to the target and when HI5/95 < 1·2 (considered ideal) or HI5/95 < 1·5 (considered minor deviation), Reference Videtic, Singh and Chang39,Reference Bezjak, Bradley and Gaspar40 it indicates greater heterogeneity within the target volume. Values of D2cm < 50–77% or D2cm < 57–94% for PTV volume ranging from 1·8cc to 163cc are considered ideal or acceptable minor deviation, respectively. Reference Videtic, Singh and Chang39,Reference Bezjak, Bradley and Gaspar40 Similarly, R50% < 2·9–5·9 or R50% < 3·7–7·5 for PTV volumes ranging from 1·8cc to 163.cc are considered ideal or acceptable minor deviation, respectively, Reference Videtic, Singh and Chang39,Reference Bezjak, Bradley and Gaspar40 and they indicate greater dose fall-off from the PTV and better plan conformity. Therefore, our data show greater dose conformity and heterogeneity to the PTV and greater dose fall-off from the PTV for both 3DCRT and VMAT techniques and 48 Gy/4 and 50 Gy/5 fractionation schemes. Although, the VMAT technique shows slightly improved dose conformity and heterogeneity to the PTV and greater dose fall-off from the PTV (Tables 2a and 2b). However, a two-tailed Student’s t-test shows no significant difference (p > 0·05) between VMAT and 3DCRT techniques regarding HI5/95 and R50% for both prescription doses, although it indicated a significant difference (p < 0·05) regarding CIRI and D2cm. Several studies Reference Herbert, Kwa and Nakano24,Reference Kim, Chung and Kim26,Reference Weyh, Konski, Nalichowski, Maier and Lack27,Reference Ong, Verbakel, Cuijpers, Slotman, Lagerwaard and Senan42,Reference Hrbacek, Lang, Graydon, Klöck and Riesterer43 have investigated the CIRI, HI5/95, R50% and D2cm of lung SBRT and reported similar results. Kim et al. Reference Kim, Chung and Kim26 investigated the feasibility of clinical usage of FFF beams for lung SBRT treatment at a prescription of 48 Gy/4. They reported CIRI of 1·05 ± 0·07 and 1·05 ± 0·09 and R50 of 3·93 ± 0·64 and 4·03 ± 0·65 for FFF and FF beams treatment plans, respectively. Herbert et al. Reference Herbert, Kwa and Nakano24 on the other hand reported CIRI of 1·21, 1·03 and 1·01; R50 of 3·97, 3·64 and 4·03; D2cm of 67·1%, 55·8% and 54·4% for 3DCRT, three-arcs VMAT and single-arc VMAT treatment plans respectively at a prescription dose of 48 Gy/4. Weyh et al. Reference Weyh, Konski, Nalichowski, Maier and Lack27 compared IMRT and RapidArc techniques to investigate the optimal treatment modality to deliver SBRT to peripheral lung cancer. They reported mean CIRI of 1·36 ± 2·9 and 1·29 ± 2·2; R50% of 7·1 ± 1·9 and 6·53 ± 1·2; D2cm of 75·65 ± 12·7% and 67·34 ± 10·5%; HI5/95 of 1·15 ± 0·02 and 1·14 ± 0·02 for IMRT and rapid arc treatment plans respectively at a prescription dose of 48 Gy/4. Hrbacek et al. Reference Hrbacek, Lang, Graydon, Klöck and Riesterer43 compared 6-MV FFF, 10-MV FFF and 6-MV FF beams for SBRT of early-stage lung cancer and reported D2cm of 41·6 ± 13·4%, 42·4 ± 13·8% and 42·6 ± 12·4% for 6-MV FFF, 6-MV FF and 10-MV FFF beams respectively for a prescribed dose of 50 Gy/5.
Conclusion
The use of 3DCRT and VMAT technique for SBRT of non-central lung tumours is an effective and reliable method for achieving greater target dose conformity, rapid dose fall-off from PTV and minimising doses to the organs at risk. The study shows that predefined dose-volume constraints and objectives for either 3DCRT or VMAT technique can be achieved, resulting in improved dose optimisation and coverage of target volume, reduction in OARs volume receiving high doses and therefore with the potential to reduce the rate of toxicity, decrease pain and improve the quality of life for lung cancer patients. The main advantage of the VMAT technique over 3DCRT technique is faster treatment delivery time which can potentially improve the tolerability of the SBRT technique and reduce the likelihood of error due to intra-fraction motion. In addition, VMAT treatment planning consists of an efficient and optimal inverse planning process than 3DCRT and can therefore achieve optimal plans with minimal effort.
Acknowledgements
The authors would also like to acknowledge with much gratitude the support from Abraham Park who developed the code for extracting the patients’ data from our database and all the staff in the oncology programme.
Conflict of Interest
The authors declare that the research was conducted in the absence of any commercial or financial relationships that could be construed as a potential conflict of interest.