Implications
The results of this experiment indicate that early weaning (EW) is not detrimental for the growth and development of replacement beef heifers, although this management strategy is associated with some physiological differences many months after weaning. In particular, EW heifers exhibited a lesser insulin response for the clearance of glucose, thus demonstrating that EW can have long-term effects on glucose/insulin dynamics. Despite this difference, EW was neither beneficial nor detrimental for heifer growth or puberty attainment. Additional research is needed to determine whether EW affects subsequent performance and cow life-time productivity.
Introduction
Early weaning (EW) is a strategy for altering growth that has traditionally been studied as a means of enhancing carcass characteristics in beef calves. More recently, however, there has been a growing interest in the effects of EW on replacement heifer development and puberty attainment. Early weaning is defined as removing the calf from the dam at a time before the industry standard for weaning, or 7 months of age. It is generally associated with feeding a high-concentrate diet from the time of EW until the age at which calves would have normally been weaned (Rasby, Reference Rhoads, Rhoads, VanBaale, Collier, Sanders, Weber, Crooker and Baumgard2007). In fact, results of previous experiments indicate that the high-concentrate diet typically fed after EW is essential for reducing age and/or BW at puberty (Gasser et al., Reference Gasser, Grum, Mussard, Fluharty, Kinder and Day2006d; Moriel et al., Reference Moriel, Johnson, Vendramini, Mercadante, Hersom and Arthington2014).
Manipulating the nutrition of replacement heifers early in life presumably results in metabolic imprinting capable of altering their long-term metabolic status and related reproductive parameters. Metabolic imprinting is defined as epigenetic changes caused by nutritional stress early in life that permanently alters physiological outcomes (Moriel et al., 2014), and could affect long-term productivity of EW heifers. Unfortunately, relatively few aspects of the resulting metabolism have been characterized in EW replacement heifers and reproductive responses to EW protocols have not been consistent across studies (Grings et al., Reference Grings, Geary, Short and MacNeil2007; Waterman et al., Reference Wheelock, Rhoads, VanBaale, Sanders and Baumgard2012; Moriel et al., Reference Moriel, Johnson, Vendramini, Mercadante, Hersom and Arthington2014). Understanding how EW regimens alter physiology is critical for interpreting disparities between experiments and predicting production-related outcomes. Therefore, the objective of this study was to evaluate the effects of an EW program coupled with feeding a high-concentrate diet on specific aspects of metabolism and selected reproductive parameters.
Material and methods
Animals and weaning regimens
All animal procedures were approved by the Virginia Tech Institutional Care and Use Committee. In all, 35 fall-born Angus×Simmental heifer calves were blocked by sire, stratified by BW and randomly assigned to either an EW plus high-concentrate or normal weaning (NW) management treatment. Heifers assigned to the EW treatment (n=17) were weaned at 107±3 days of age and fed a high-concentrate diet ad libitum in a dry lot for 125 days. Concentrate formulations were adjusted at 25-day intervals to decrease CP content, and have been previously reported (Scheffler et al., Reference Van Donkersgoed, Ribble, Townsend and Janzen2014). NW heifers (n=18) remained un-supplemented with their dams on cool-season mixed grass pasture comprised primarily of tall fescue (Lolium arundinaceum) until being weaned at 232±3 days of age. At the time of NW, BWs of heifers from this replicate were combined with those from three previous replicates (historical data) for pen-based analysis of effect of weaning regimen on BW. Following NW, EW and NW heifers were comingled on cool-season mixed grass pasture with a forage availability that ranged between 1685 and 2250 kg/ha (Scheffler et al., Reference Van Donkersgoed, Ribble, Townsend and Janzen2014).
Prepubertal measurements
Beginning at 261±4 days of age (~29 days after NW and comingling), blood samples were collected weekly until heifers were considered pubertal, or until they were enrolled in a pre-breeding estrous cycle synchronization protocol. Blood samples were collected into evacuated glass tubes containing sodium heparin (Tyco Healthcare Group LP, Mansfield, MA, USA). These samples were placed on ice, transported to the lab and centrifuged at 1500×g for 15 min. The plasma was collected, aliquoted in duplicate and stored at −20°C until analysis. Progesterone concentrations of the plasma samples were measured by validated radioimmunoassay (Coat-A-Count solid-phase 125I radioimmunoassay (RIA) kit; Diagnostic Products Corporation, Los Angeles, CA, USA; Holt et al., 1989), with intra- and inter-assay CV values of 3.7% and 4.4%, respectively. Heifers were considered pubertal when blood plasma progesterone levels exceeded 1 ng/ml for 2 consecutive weeks (Gasser et al., Reference Gasser, Behlke, Grum and Day2006a).
Pelvic measurements were collected at 406±3 days of age using a Rice pelvimeter (Lane Manufacturing Inc., Denver, CO, USA). Pelvic height was measured by resting the pelvimeter on the floor of the pubic symphysis and opening to the sacral vertebrae (Van Donkersgoed et al., Reference Waterman, Geary, Paterson and Lipsey1990). Pelvic width was determined by measuring the distance between shafts of the ilium at the widest point. Pelvic area was then determined by multiplying the pelvic height by pelvic width. The size of the ovaries (height and width) was measured by transrectal ultrasound (Ibex Pro; EI Medical Imaging, Loveland, CO, USA) when heifers were 409±3 days of age.
Estrous cycle synchronization and breeding
The estrous cycles of the heifers were synchronized using the Co-Synch+CIDR with timed artificial insemination (AI) protocol. All heifers received gonadotropin releasing hormone (GnRH; 100 μg; Cystorelin; Merial LLC, Duluth, GA, USA) intramuscularly and a vaginal insert (EAZI-BREED CIDR; Interag, Hamilton, New Zealand) containing 1.38 g of progesterone. Vaginal inserts were removed after 7 days, at which time each heifer received an intramuscular injection of prostaglandin F2α (25 mg; Lutalyse; Zoetis Inc., Kalamazoo, MI, USA). Approximately 54 h after the injection of prostaglandin F2α heifers received an injection of GnRH (100 μg) in conjunction with AI. First service occurred at 437±4 days of age. All heifers not pregnant from the first AI were resynchronized and inseminated a second time.
Hormone challenges
In all, 16 pregnant heifers that conceived from the first AI were chosen for the second phase of the experiment. Heifers were divided into two replicates of eight balanced by treatment, sire and weight. Each replicate was 1 week in duration and conducted in succession. During this time, heifers were fed corn silage at 2.5% of BW and offered orchard grass hay ad libitum. Three days before the first challenge, heifers were fitted with bilateral indwelling jugular vein catheters (Rhoads et al., Reference Roberts, Geary, Grings, Waterman and MacNeil2009). Immediately following catheterization, heifers were transported to a facility where they were housed individually in pens that were 8.6 m2 in size. They were maintained on the same diets consisting of corn silage and orchard grass hay.
The first challenge was conducted after a 3-day acclimation period. Although heifers were not allowed to eat or drink during the challenges, they were not fasted nor water restricted before initiation of the challenges. Blood samples from all challenges were immediately placed on ice and then centrifuged at 1500×g for 15 min. Plasma was collected, divided into aliquots and stored at −20°C until analysis.
The first challenge performed was a glucose tolerance test. Blood samples were collected at −30, −20, −10, 0, 5, 7.5, 10, 15, 20, 30, 45, 60 and 90 min relative to glucose administration as described by Wheelock et al. (Reference Perry, Smith, Roberts, MacNeil and Geary2010). Heifers were administered a bolus dose (250 mg/kg of BW) of a 50% dextrose solution (MWI, Boise, ID, USA) immediately after the time 0 blood sample was collected. Administration of the dextrose bolus was followed by 20 ml of saline, thereby ensuring that the entire dose was flushed through the catheter. Each blood sample (10 ml) that was collected during this challenge was divided between a sodium heparin tube (for insulin analysis) and a sodium fluoride tube (for glucose analysis; Tyco Healthcare Group LP).
An epinephrine challenge was performed 2 days after the glucose tolerance test. Blood samples (10 ml; sodium heparin-coated tube) were collected at −30, −20, −10, 0, 2.5, 5, 7.5, 10, 20, 30, 45, 60, 90 and 120 min relative to epinephrine administration as described by Rhoads et al. (Reference Roberts, Geary, Grings, Waterman and MacNeil2009). Immediately, following collection of the time point 0 blood sample, heifers were given epinephrine HCl (International Medical Systems, So. El Monte, CA, USA) at 1.4 µg/kg BW, which was followed by a 20-ml bolus dose of saline to flush the catheter.
A progesterone clearance analysis was conducted 2 days following the epinephrine challenge. Blood samples (10 ml) were collected at −45, −30, −15, 0, 7.5, 15, 30, 45, 60, 90, 120 and 180 min relative to progesterone administration as described by Hutchinson et al. (Reference Hutchinson, Dewhurst, Evans, Lonergan and Butler2012). A progesterone bolus (350 ng/kg BW; Watson Pharma Inc., Parsippany, NJ, USA) was administered in the same manner described for previous challenges.
Insulin and glucose concentrations were measured in samples collected during the glucose tolerance test. Plasma insulin was analyzed using a commercially available bovine insulin ELISA (Mercodia, Uppsala, Sweden). Glucose was measured with a colorimetric assay kit (Autokit Glucose C2; Wako Chemicals, Richmond, VA, USA; Rhoads et al., Reference Roberts, Geary, Grings, Waterman and MacNeil2009). The intra- and inter-assay CV values were 5.7% and 4.5%, respectively, for insulin and 4.8% and 5.4%, respectively, for glucose. Non-esterified fatty acids (NEFA) were measured in plasma samples collected during the epinephrine challenge with a commercially available enzymatic kit (NEFA C kit; Wako Chemicals; Rhoads et al., Reference Roberts, Geary, Grings, Waterman and MacNeil2009). Intra- and inter-assay CV values for NEFA analyses were 4.6% and 13.9%, respectively. Blood progesterone was measured by commercially available RIA kit, as described above.
Calculations and statistical analyses
Before NW, heifers from opposite treatments were not comingled. Therefore, treatment pen was used as the experimental unit for analysis of BW at the time of NW. After NW, heifers from both treatments were comingled on pasture and remained comingled for the duration of phase 1 of this study. Heifers used in the second phase of the experiment (hormone challenges) were housed individually. Therefore, heifer was used as the experimental unit for analyses of variables measured after NW. For each of the challenges, baseline values of the hormones of interest were analyzed, and included hormone concentrations in all blood samples collected before bolus dose administration. Response to the dose of interest was further assessed by calculating the area under the curve (AUC) using linear trapezoidal summation between successive pairs of concentrations and time coordinates as described by Rhoads et al. (Reference Roberts, Geary, Grings, Waterman and MacNeil2009). The magnitude of the insulin response to the glucose challenge was also evaluated by analysis of the peak insulin concentration, the time to peak insulin concentration and the change in insulin concentration from baseline to peak.
Data with single observations (day of age at puberty, BW at puberty, pelvic area, ovarian area and area under the challenge curves) were analyzed for effects of treatment with the GLM procedure of SAS (SAS Institute Inc., Cary, NC, USA). Response variables with repeated measurements (challenge time points) were analyzed for main effects of treatment, time and their interaction using the MIXED procedure of SAS. Sire was included as a covariate in the statistical analyses of the challenge data. For the MIXED procedures, multiple covariance structures were tested and the most appropriate structure (lowest Akaike’s information criterion, Akaike’s information criterion with correction and Bayesian information criterion values) was used for each analysis. Heifer nested within treatment was included in the model as a random effect.
Results are reported as least squares means±standard error of mean. Separation of means was conducted using the Tukey–Kramer procedure of SAS. Statistical significance was noted at P⩽0.05 and tendencies were reported at 0.05<P⩽0.15.
Results
Phase 1 observations
BWs of EW and NW heifers over four replicate calving seasons were compared at the time of NW (205 to 232 days of age). EW heifers were consistently heavier than the NW heifers at the time of NW (211.9±6.1 kg v. 251.1±6.1 kg for NW and EW, respectively; P<0.01). All other measurements reported herein were collected from a single fall-born cohort of heifers.
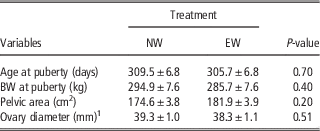
Although the number of heifers available for this study was not sufficient for robust and thorough evaluation of pregnancy rates, other reproductive characteristics were documented for comparison with previous experiments. Attainment of puberty was similar for EW and NW heifers, as neither age nor BW at puberty differed between treatment groups (Table 1). There also were no differences in pelvic area (measured at 406±3 days of age) or ovary size (measured at 409±3 days of age) between weaning treatment groups (Table 1).
Reproductive characteristics of normal-weaned (NW, n=18) and early-weaned (EW, n=17) beef heifers

1 Average diameter of both ovaries.
Phase 2 outcomes
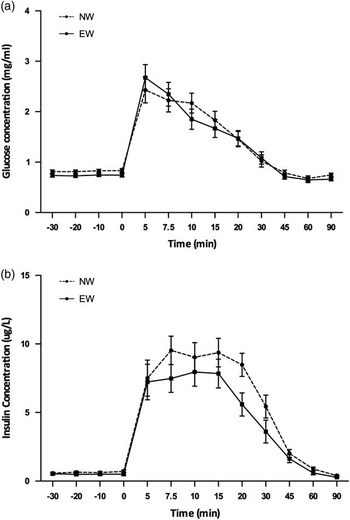
Although baseline insulin values did not differ between EW and NW heifers, EW heifers in the current experiment tended to have lower baseline glucose concentrations (0.75±0.03 v. 0.82±0.03 mg/ml for EW and NW, respectively; P=0.10). No other glucose variables were affected by weaning treatment.
For insulin, there was a tendency for a treatment by time interaction (Figure 1; P<0.06), which resulted in a reduction in the insulin AUC for EW heifers (176.4±30.2 v. 280.8±30.2 for EW and NW at 90 min, respectively; P<0.05). Additional examination of the response to the dextrose dose revealed that the peak insulin concentrations in NW heifers tended to be greater than EW. This relationship was consistent in analyses of both absolute (7.38±0.63 v. 8.93±0.63 μg/l for EW and NW, respectively; P=0.11) and delta (6.89±0.59 v. 8.30±0.59 μg/l for EW and NW, respectively; P=0.12) insulin concentrations.
Blood glucose (a) and insulin (b) concentrations of normal-weaned (NW) and early-weaned (EW) beef heifers during a glucose tolerance test. A 50% dextrose solution (250 mg/kg of BW) was administered immediately after the time 0 blood sample was collected.

In the current study, there were no treatment-induced differences in baseline NEFA concentrations nor in response to the epinephrine challenge. Throughout the progesterone clearance analysis, EW heifers tended to have lower overall circulating progesterone concentrations (25.6±3.7 v. 34.1±3.7 ng/ml for EW and NW, respectively; P=0.14). The AUC at 60 and 180 min of the progesterone clearance analysis followed the same numeric trend, but did not differ statistically (2448.7±441.2 v. 3056.2±453.1 for EW and NW at 60 min, respectively; 4232.7±693.0 v. 5002.1±711.6 for EW and NW at 180 min, respectively; P>0.15). Baseline concentrations of progesterone did not differ between treatments.
Discussion
The presumptive metabolic imprinting (defined as changes in the epigenetics of the animal due to nutritional stress early in life) that occurs as a result of EW is capable of affecting long-term productivity (Moriel et al., 2014). Effects of EW on growth and carcass characteristics of cattle destined for the feedlot have been well documented (Myers et al., 1999; Schoonmaker et al., 2001; Meyer et al., 2005). Unfortunately, the variables that affect a heifer’s maternal/replacement value go beyond growth and carcass characteristics, and are sometimes difficult to measure and/or quantify.
Reproductive tract scores are frequently used as a management tool, as they provide an indication of the maturity of the reproductive tract and are related to reproductive success (Gutierrez et al., Reference Gutierrez, Kasimanickam, Tibary, Gay, Kastelic, Hall and Whittier2014; Holm et al., Reference Holm, Nielen, Jorritsma, Irons and Thompson2015). Measurement of the ovaries was used as an indication of the heifers’ reproductive tract scores (Hall, Reference Hall2005) for this experiment because of its objectivity. Ovary size measured by ultrasound did not differ between EW and NW heifers. Likewise, pelvic area was not affected by weaning treatment (Table 1). These results suggest that the reproductive maturity of heifers enrolled in this experiment was not affected by weaning treatment.
Recent research has found that EW heifers fed a high-concentrate diet are more likely to precociously attain puberty (puberty before 300 days of age; Gasser et al., Reference Gasser, Burke, Mussard, Behlke, Grum, Kinder and Day2006b). During the current experiment, age and BW at puberty were numerically lower for EW heifers, but not biologically or statistically different (Table 1). This lack of treatment effect conflicts with data presented by Gasser et al. (Reference Gasser, Burke, Mussard, Behlke, Grum, Kinder and Day2006b), where age and BW at puberty was less for EW heifers fed a high-concentrate diet (60% corn) compared with conventionally weaned heifers and other EW heifers fed a control diet (30% corn). Likewise, Moriel et al. (2014) found EW heifers tended to achieve puberty at lighter BW than NW contemporaries, which was thought to be a direct result of the post-weaning feeding regimen and resultant growth, rather than the EW practice itself. This contention is supported by studies where heifers were fed for high gain after EW (Cardoso et al., Reference Cardoso, Alves, Prezotto, Thorson, Tedeschi, Keisler, Amstalden and Williams2014a and Reference Cardoso, Alves, Prezotto, Thorson, Tedeschi, Keisler, Park, Amstalden and Williams2014b) or NW (Roberts et al., Reference Sangsritavong, Combs, Sartori, Armentano and Wiltbank2009). Heifers fed for high gain achieved puberty at a lighter BW and/or younger age than those fed a restricted diet. Collectively, the results of these studies suggest that lower age and BW at puberty of EW heifers is a direct result of feeding and supplementation irrespective of weaning strategy.
For heifers, early attainment of puberty is particularly important for reproductive success as it allows for the completion of more estrous cycles before the beginning of the breeding season, which increases the likelihood of conception (Byerley et al., Reference Byerley, Staigmiller, Berardinelli and Short1987). Theoretically, even in the absence of precocious puberty, EW could improve fertility of beef heifers. For example, changes in follicular dynamics have previously been attributed to EW. EW heifers fed a high-concentrate diet have larger dominant follicles and increased LH pulse frequency (Gasser et al., Reference Gasser, Burke, Mussard, Behlke, Grum, Kinder and Day2006b and 2006c). As ovulatory follicle size affects pregnancy rate (Perry et al., Reference Rasby2007), larger ovulatory follicle size and higher LH pulse frequency could ultimately result in higher pregnancy rates.
Circulating progesterone concentrations are also critical for fertility. Progesterone is not only responsible for maintaining pregnancy, but also for preparing the reproductive tract to establish a pregnancy. Circulating progesterone concentrations are the product of both luteal production and metabolism by the liver (McCracken et al., Reference McCracken, Xie, Deaver, Baumgard, Rhoads and Rhoads2015). Results from previous experiments suggest that feeding regimen affects hepatic progesterone metabolism (Ferraretto et al., Reference Ferraretto, Gencoglu, Hackbart, Nascimento, Dalla Costa, Bender, Guenther, Shaver and Wiltbank2014). For example, non-lactating dairy cows fed 150% of maintenance requirements exhibited increased liver blood flow and lower blood progesterone concentrations after progesterone administration (Sangsritavong et al., Reference Scheffler, McCann, Greiner, Jiang, Hanigan, Bridges, Lake and Gerrard2002). Therefore, it seems likely that feeding a high-concentrate diet following EW could cause metabolically induced changes in both liver blood flow and function that ultimately alter circulating progesterone concentrations as a result of hepatic progesterone metabolism. Results of the progesterone clearance analysis supported this hypothesis, as there was a tendency for an effect of treatment, with EW heifers having lower overall circulating progesterone concentrations (P=0.14). Interestingly, baseline concentrations of progesterone did not differ between EW and NW heifers, suggesting that the EW heifers may have compensated for accelerated rates of clearance. This compensation could be accomplished through greater luteal production of progesterone. Luteal production of progesterone is a product of both corpus luteum (CL) size and function. Both CL size and function may have been elevated in the EW heifers if those heifers did indeed have higher LH pulse frequency, coupled with ovulation of a larger follicle (as previously suggested).
The potential for improved reproductive performance is only one of many reasons to wean heifers early. EW also changes circulating metabolite levels (Waterman et al., Reference Wheelock, Rhoads, VanBaale, Sanders and Baumgard2012) and these changes may improve metabolic status while positively influencing fertility. Blood glucose and insulin concentrations are tightly controlled in mammals, and treatment-induced differences in their dynamics are indicative of changes in physiology that can affect metabolism, feed efficiency and reproductive performance. Therefore, a glucose tolerance test was conducted in order to determine whether aspects of glucose and/or insulin concentrations were affected by weaning regimen. During the baseline measurements (before dextrose administration), insulin concentrations did not differ between EW and NW heifers. Despite similar circulating insulin concentrations, however, EW heifers tended to have lower baseline glucose concentrations than their NW counterparts (P=0.10). None of the other glucose variables differed between weaning treatments, suggesting that although baseline values differed, weaning treatment does not alter the rate of glucose clearance.
Although glucose was cleared at a similar rate between EW and NW heifers, the insulin response to the dextrose bolus differed between treatment groups. Heifers that had been subjected to the EW regimen had lower insulin AUC (P<0.05), which was related to a tendency for lesser peak insulin concentrations in EW heifers (P=0.11 and P=0.12 for absolute and delta peak concentrations). Collectively, these results demonstrate that a lesser insulin response was necessary to properly clear the glucose in the EW heifers, and are indicative of greater insulin sensitivity in the EW heifers. This contention is further supported by the tendency for EW heifers to have lower baseline plasma glucose concentrations. No previous reports of insulin sensitivity in NW v. EW heifers could be found. The observed differences in aspects of glucose and insulin regulation could be the result of metabolic imprinting that occurred as a result of the EW regimen. Although weaning regimen was previously shown to alter the epigenetic regulation of the transcriptome in steers (Moisá et al., Reference Moisá, Shike, Shoup, Rodriguez-Zas and Loor2015), additional research is necessary to determine the underlying physiological mechanism(s) responsible for this effect in replacement heifers.
Circulating concentrations of NEFA are negatively correlated with fertility in dairy cattle and are known to decrease oocyte quality and alter oviductal epithelial cell physiology (Van Hoeck et al., 2013; Jordaens et al., 2015). Previous research has suggested that weaning protocol can affect circulating NEFA concentrations (Waterman et al., Reference Wheelock, Rhoads, VanBaale, Sanders and Baumgard2012), which, in turn, could be responsible for reduced fertility. In the current study, however, there were no differences in baseline NEFA concentrations nor in response to the epinephrine challenge.
Conclusions
Although EW has traditionally been investigated as a method to improve the performance of cattle destined for the feedlot, the results of this experiment indicate EW can also be successfully utilized for heifers that will be retained in the herd as replacements. EW heifers reached reproductive maturity at the same age as their NW counterparts, and appeared to be more insulin sensitive than their NW contemporaries. Further research is necessary to elucidate the physiological mechanisms responsible for these results, and to determine the impact on offspring and cow life-time productivity.
Acknowledgments
Funding for this work was provided, in part, by the Virginia Agricultural Experiment Station and the Hatch Program of the National Institute of Food and Agriculture, US Department of Agriculture.