

I. Introduction
Speculation about the rising alcohol content of wine and its causes has sparked a flurry of media attention in recent years in major news outlets and in the food and wine press (e.g., Goode, 2009; Teague, Reference Teague2010; Bonné, Reference Bonné2011; Rose, Reference Rose2012; Frazer, 2014; Williams, 2014; Schmitt, Reference Schmitt2014; Darlington, Reference Darlington2015). Has the alcohol content of wine risen? If so, by how much, and what roles have been played by climate change compared with market responses to evolving consumer preferences and expert ratings? It is not easy to answer any of these questions with confidence because accurate information on the alcohol content of wine is not readily available.
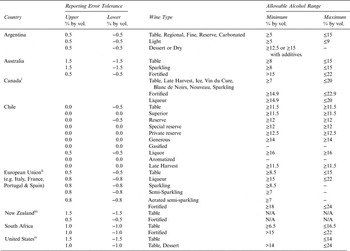
While every bottle of wine reports alcohol content on the label, the tolerances are wide; U.S. law allows a range of plus or minus 1.5 percentage points for wine with 14% alcohol by volume or less, and plus or minus 1.0 percentage points for wine with more than 14% alcohol by volume, and other countries have similarly large tolerances (see Appendix Table A.1). These are wide bands compared with the relevant range of variation in the marketplace—the vast majority of table wine has alcohol content between 12% and 15%—, which raises a third question: Are the stated alcohol percentages on wine labels accurate, and, if not, are they systematically biased? Wineries may have incentives to deliberately distort the information because they perceive a market preference for a particular range of alcohol content for a given style of wine or for other reasons such as tax avoidance (for instance, the U.S. tax rate is $1.07 per gallon for wine with 14% alcohol or less, and $1.57 per gallon for wine with 14.1% to 21% alcohol).
This paper uses a novel data set to address these questions. The Liquor Control Board of Ontario (LCBO), which has a monopoly on the importation of wine for sale in the province of Ontario, Canada, tests every wine imported and records several characteristics, including the alcohol content. We obtained data from the LCBO on over 100,000 observations of wines tested between 1992 and 2009, reporting the actual and stated alcohol content of wine sourced from a large number of countries that experienced different patterns of climate change and influences of policy and demand shifts. Using these data we explore the extent to which the alcohol content of wine has risen over time, and seek to distinguish between causes related to climate change versus other causes related to evolving market preferences, as indicated by expert ratings for wines, and government policies that discourage the production of wine with higher alcohol content.Footnote 1 We also examine differences between reported and actual alcohol content of wine, and develop a model of demand for these labeling errors.
The work in this paper relates to several disparate strands of literature, including the more general literature on the economics of food labeling and labeling regulations (e.g., Golan et al., Reference Golan, Kuchler, Mitchell, Greene and Jessup2001), and other strands of marketing and behavioral economics as they pertain to consumer responses to packaging and labeling as sources of information about product quality (see, e.g., Cheskin and Ward, Reference Cheskin and Ward1948; Woolfolk et al., Reference Woolfolk, Castellan and Brooks1983; Hine, Reference Hine1995; Dimara and Skuras, Reference Dimara and Skuras2005; Costanigro et al., Reference Costanigro, McCluskey and Mittelhammer2007; Masson et al., Reference Masson, Aurier and d'Hauteville2008). But our findings are of more direct relevance to work on hedonic pricing and other work on consumer perceptions of the quality attributes of wine, as represented by information conveyed on the label and from other sources (e.g., see Gustafson, Reference Gustafson2011). While connecting to this broader literature, the purpose of the work here is more specifically focused.Footnote 2 The issue of inaccurate wine label claims is of direct interest, and has also attracted some attention from the media in the context of concerns over high and rising alcohol content of wine. Analysis of this issue can also provide insight into whether wine producers are concerned about the high and rising alcohol content of wine, and how they respond to it.Footnote 3
The remainder of the paper is organized as follows: Chapter II presents data, summary statistics and analysis of wine alcohol content and global temperatures over time. Chapter III examines the systematic errors in alcohol content reported on labels and presents a model of “demand for labeling errors.” Using the model, we calculate the optimal alcohol content for a range of wine categories and prices. Chapter IV concludes the paper.
II. Evidence on the Rising Alcohol Content of Wine and the Role of Climate
To begin, first we examine changes in the alcohol content of wine from the world's main wine-producing regions over a period of nearly two decades. As well as describing the patterns in the data we attempt to account for the role of changes in climate, as measured by an index of heat (average daily temperature) in the growing season.Footnote 4
A. Data for the Analysis
The LCBO provided us with data for 18 years (1992–2009) comprising 127,406 samples of wines, including 80,421 red wines and 46,985 white wines from around the world. The amount of detail reported varies widely among the observations; some contain information on the brand and variety name, others only the variety; some report only country of origin, while others refer to smaller regions within countries, or other details of the appellation reported on the label. In the early stages of the analysis we decided to set aside the data for German wines because they entail substantial differences in winemaking styles and techniques—emphasizing white wines with significant residual sugar, mainly Riesling, for which many of the structural relationships could be expected to be different from their counterparts for dry table wines that predominate elsewhere. We also opted to exclude other wines that were clearly dessert wines, either because of other indications or because they reported very high alcohol content (more than 17% by volume); we also excluded wines having other chemical properties not consistent with normal dry table wines such as total residual sugar above 1%, volatile acidity above 10%, or very low alcohol (less than 8% by volume); and the observations for 2008 and 2009 were set aside because they were incomplete. Of the remaining observations, 91,432 were usable in that they were non-duplicates that included data on the actual alcohol percentage, the alcohol percentage stated on the label, the vintage year, and the country (and, in some cases, the region) of origin.
We acquired corresponding region-specific climate data from several sources. We obtained data recorded by various weather stations, and worked to identify those weather stations that would provide the best representation of the respective growing regions. Where they were available, we used weather station data from NOAA's National Climatic Data Center (1992–2008). Climate data in the form we desired were not available for New Zealand or South Africa from NOAA. Instead we were able to obtain information for New Zealand from the Marlborough Wine Research Centre (1990–2008), and for South Africa from Irene van Gent at AgroMet-ICSW (Reference Van Gent2010). The daily measure of growing degrees (GDs) is equal to the average of the daily minimum and daily maximum temperature minus a base temperature of 50oF. The accumulated total of growing degree units (GDUs) is the sum of GDs accumulated during the relevant growing season for wine grapes (April–October in the northern hemisphere, October–April in the southern hemisphere). We use a growing season heat index, H defined as the average daily GDs during the growing season, equal to the accumulated GDUs divided by the total number of days. We also experimented with the same variable applied to different periods (e.g., the entire year or particular months).Footnote 5
B. Base Values and Growth in Alcohol Percentages and Growing Season Temperatures
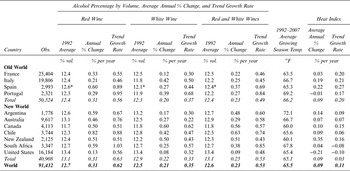
Table 1 includes summary statistics on the numbers of observations for each type of wine (red, white, or both red and white pooled) for each country and the average actual alcohol percentage recorded for that country in 1992, as well as the average value of the heat index for the sample period, 1992–2007. The spatial patterns in the alcohol content of wine in 1992 are consistent with expectations generally. Specifically, “Old World” wines tend to have lower alcohol percentages than “New World” wines; wines from cooler places (e.g., Canada and New Zealand) tend to have lower alcohol percentages than wines from hotter places (e.g., the United States and Australia); and red wines tend to have higher alcohol percentages than white.
Alcohol Content and Heat Index: Base Values and Percentage Changes, by Color of Wine and Country

Notes: *Values represent 1993 average alcohol content. Annual percentage change accounts for 1993 starting year.
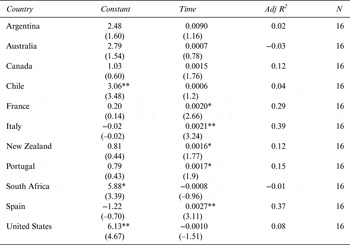
Table 1 also includes two measures of the growth rate of the alcohol percentage and the heat index: the average of annual percentage changes and the trend growth rate from a semi-logarithmic regression (details of these regressions are included in Appendix Tables A.1 and A.2).Footnote 6 All of the trend coefficients for alcohol are highly statistically significant, indicating growth in the alcohol percentage in every country, but at different rates (with the trend rate sometimes quite different from the average annual rate).Footnote 7 The growth rates range between about 0.1 and 1.0 percent per year implying total growth of 1.5 to 16.0 percent over 16 years (i.e., an increase in the average alcohol content of 0.2–2.0 percentage points on a base of 12–13% by volume).
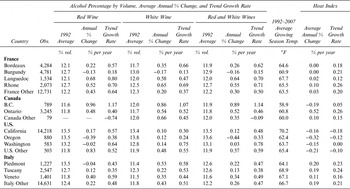
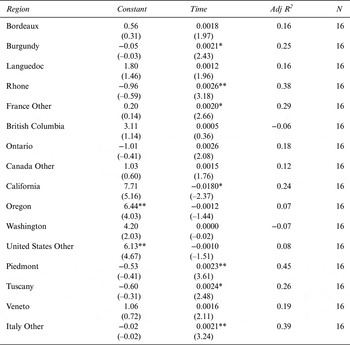
Table 2 includes the same information as in Table 1, but now for sub-national regions, which were defined based on an inspection of the data, and in consideration of the availability of data for some regions relative to others (the counterpart growth-rate regressions are included in Appendix Tables A.3 and A.4). The disaggregated regions have much more disparate patterns in their growth rates, partly reflecting the relatively small sample sizes in some cases. While the model fit was poor for these specifications, the estimated growth rate was positive and highly significant for each region, with the exception of “Canada Other,” representing wine growing regions of Canada outside British Columbia and Ontario, or observations without a designated growing region. In the heat index regressions, the specific regions within France (Bordeaux, Burgundy, Languedoc, Rhone, and France Other) and Italy (Piedmont, Tuscany, Veneto, and Italy Other) all had statistically significant growth rates.
Alcohol Content and Heat Index: Base Values and Percentage Changes, by Color of Wine and Region of Production

C. Regressions of Alcohol Percentage against the Heat Index
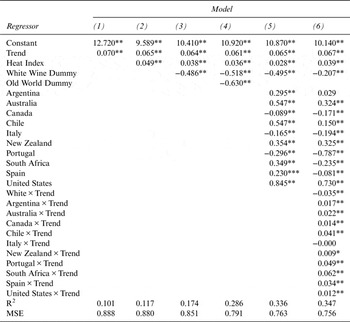
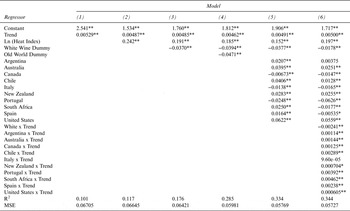
We pooled the data across countries, years, and types of wine and ran a series of regressions to explore the effects of climate change, as represented by the heat index, as a potential contributor to the rising alcohol content of wine. The alcohol percentage by volume is the dependent variable in all of the regression models reported in Table 3.Footnote 8 In column (1) we show the results of regressing the alcohol percentage against a linear time trend. The trend coefficient is positive and statistically significant. It indicates that, on average, across the data, the predicted alcohol content of wine increased by 0.07 percentage points per year, or 1.12 percentage points over the 18 years relative to an initial mean of 12.7% alcohol by volume; an increase by one-tenth in the average alcohol content of wine.
Regressions of Alcohol Percentage Against Trend and Heat Index, 1992 to 2007

Notes: Dependent variable is actual % alcohol. “France”, “Red Wine” and “France × Trend” are default categories.
** Significant at the 1% level, * significant at the 5% level. 91,432 observations.
The model in column (2) also includes our climate variable, the average growing season temperature in degrees Fahrenheit. Both coefficients are positive and statistically significant. The coefficient on the trend variable is smaller than in column (1), indicating an underlying growth rate in alcohol content of 0.06 percentage points per year, after accounting for the effects of temperature changes. The coefficient on the heat index is approximately 0.05, suggesting that, holding other factors constant, a one-degree Fahrenheit increase in the average growing season temperature everywhere in the world would cause the average alcohol content of wine to increase by 0.05 percentage points; it would take a whopping 20 degrees Fahrenheit increase in the average temperature in the growing season to account for a 1 percentage point increase in the average alcohol content of wine. In the other models in Table 3, with additional explanatory variables included, the measured effect of the heat index is, if anything, even smaller, while the general results for the effects attributable to the trend are roughly constant.
The other models in Table 3 progressively introduce dummy variables to allow different intercepts (fixed effects) for white wine versus a default of red wine in column (3); for Old World (European) wines versus a default of New World wines (from the Americas, Australia, New Zealand, and South Africa) in column (4); and by country of origin versus a default of France (such that the combined default category is red wine from France) in column (5). In column (6) the model in column (5) is augmented with interactions between country and trend such that we have individual slope and intercept dummies allowing for different growth rates of alcohol content among countries, with common coefficients to adjust for the difference between red and white wine, and the effects of region-specific temperatures.
In all of these models, the coefficients are consistent with priors and all coefficients are statistically significant (with one exception, the coefficient on the time-trend dummy for Argentina). The white wine effect in column (3) is approximately −0.5, indicating that we can expect white wines generally to have about 0.5 percentage points less alcohol than red wines. In column (4) the estimates indicate that we can expect Old World wines to have about 0.63 percentage points less alcohol than wine produced in the New World. The latter effect is not measured in the other models; columns (5) and (6) report country-specific fixed effects instead. In column (5) the effects of the country dummies indicate that, compared with France, three countries produce somewhat lower-alcohol wine (Canada, New Zealand, and Portugal) while the rest produce higher-alcohol wine, with the effects being most pronounced for Australia (0.55 percentage points higher) and the United States (0.85 percentage points higher).
The results of the model in column (6) are slightly harder to interpret because we now have, in effect, color-of-wine-specific and country-specific time trends as well as intercepts. The coefficients on the trend interaction terms measure the additional trends, relative to the default, which is red wine from France. The coefficient of −0.0348 on “white × trend” measures the difference in the trend growth rate. It indicates that, compared with French red wine, for which the alcohol content grew by 0.0667 percentage points per year, the alcohol content of French white wine was growing more slowly, at a rate of 0.0667–0.0348 = 0.0312 percentage points per year; less than half the rate for red. The “country × trend” interaction terms indicate that, compared with French wine for which it grew by 0.0667 percentage points per year, the alcohol content grew somewhat faster in every other country except Italy. For instance, the coefficient of 0.0220 on “Australia × trend” indicates that the alcohol content of Australian red wine grew by 0.0667 + 0.0220 = 0.0887 percentage points per year, implying an accumulated increase over 18 years of 1.4 percentage points for red wine. Combining this with the coefficient of −0.0348 on “white × trend” indicates that the alcohol content of Australian white wine grew by 0.0667 + 0.0220–0.0348 = 0.0539 percentage points per year, implying an accumulated increase over 18 years of 0.9 percentage points for white wine. These estimates are comparable to those implied by the proportional growth rates reported in Table 1 for Australian wine.
The main lesson from these results is that the heat index does not account for much of the growth in the average alcohol content of wine, for two reasons. First, the heat index did not increase by very much in most places, perhaps especially in those places that exhibited the fastest growth in alcohol content of wine (Australia and the United States). Second, the estimated regression coefficient indicates that a very large change in the heat index would be required to bring about an appreciable increase in the alcohol content of wine. These findings parallel those from Alston et al. (Reference Alston, Fuller, Lapsley and Soleas2011) who found that a similar heat index for California did not contribute much to accounting for increases in either the sugar content of California winegrapes or the alcohol content of California wine.Footnote 9 We are conscious of the possibility that our results might be fragile, conditional on our data and model specification choices, and our use of a measure of temperature that might not optimally capture the true impacts of changes in climate on wine production, but for now we must conclude that climate change has not been the main factor driving the steady, systematic, and pervasive rise in the alcohol content of wine.
III. Actual versus Reported Alcohol Percentages
We now turn to discrepancies between the actual alcohol content of wine and the alcohol percentage as stated on the label. These discrepancies are intrinsically intriguing, but they also may provide some insight into producers' perceptions of alcohol content as a characteristic of wine—whether it is valuable, a “good” characteristic, or alternatively a “bad,” and under what circumstances—which in turn may help us understand the causes of the rise. We begin this section with an overview of the main patterns in the data, before turning to some attempts to interpret the patterns and discern causes.
A. Systematic Errors in the Reported Alcohol Percentage
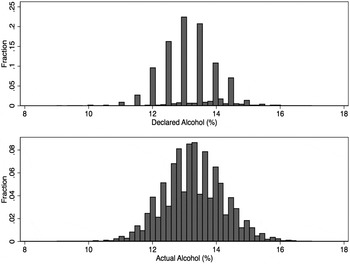
Some insight can be gleaned from frequency distributions of reported and actual alcohol content for the entire, pooled sample (Figure 1). Reported alcohol percentages fall mostly between 12.0% and 14.0%, and are clustered at 0.5-percentage point intervals, in contrast with the actual alcohol content, which falls a bit higher on the scale, and is not so clustered.
Distributions of Declared and Actual Alcohol Percentages

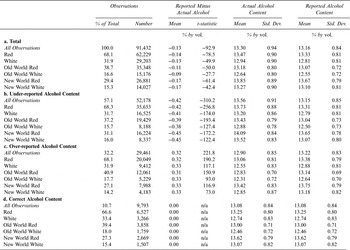
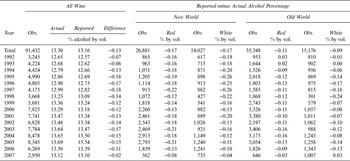
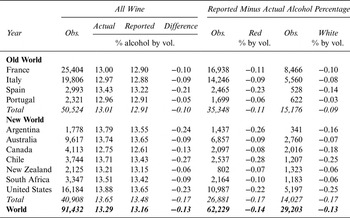
To dig into these discrepancies a little deeper, Table 4 includes summary statistics on the actual and reported alcohol content of wine and the difference between the two, organized in various ways. First, consider the totals in the first row in Panel a of Table 4, representing all 91,432 observations. These data show that the average actual alcohol content was 13.30 percent alcohol by volume and the average reported alcohol content was 13.16 percent alcohol by volume. The average discrepancy between the two (reported minus actual, such that a positive value means the actual alcohol content was overstated on the label and a negative value means the actual alcohol content was understated on the label) was −0.13 percent alcohol by volume, over all samples. The other rows in Panel a of Table 4 include summary statistics for red, white, and total wine from the New World and Old World. The average error was slightly greater for New World wines compared with Old World wines, but similar between red and white wine.Footnote 10
Reported Versus Actual Alcohol Content of Wine by Color of Wine and Region of Production

Notes: The t-statistics are from a paired test of the difference between Reported versus Actual Alcohol. All values are significantly different from zero at the one percent level of significance. In the case of “correct alcohol,” the actual alcohol is exactly equal to the reported alcohol, and the variance is zero, so the test statistics cannot be computed.
The next block of entries (Panel b in Table 4) refers to observations in which the alcohol content was understated by 0.01 percentage points or more; they include the majority of the observations (52,178 observations, or 57.1 percent of the total). The average actual alcohol content was 13.56% and the average reported alcohol content was 13.15% with an average discrepancy of 0.42 percentage points. A discrepancy of 0.4 percentage points might not seem large relative to an actual value of 13.6% alcohol by volume, but even errors of this magnitude could lead consumers to underestimate the amount of alcohol they have consumed in ways that could have some consequences for their health and driving safety; and in particular instances the discrepancies could be much larger than average. Some concerns about misreporting have been voiced in recent articles.Footnote 11
An average error of 0.4 percentage points is much more significant compared with the typical range for wines in a particular category—for instance, Napa Valley Cabernet might be expected to have alcohol content within the range of 13.5–14.5% alcohol by volume, and an average error of 0.4 percentage points is large in the context of this range. The size of the understatement was similar between red and white wines, though the average actual alcohol content was 13.7% for red versus 13.2% for white, within this group. The patterns are somewhat different if we further split the data in this group between the New and Old World sources. Compared with New World wines, Old World wines had lower actual alcohol content (by about 0.6 to 0.7 percentage points on average for both red and white wine) and understated the alcohol content to a smaller extent (i.e., by 0.39 percentage points for Old World wines compared with 0.45 percentage points for New World wines).
Labels for a significant, albeit smaller, number of wines (29,461, 32.2 percent of the sample) erred in the opposite direction, overstating the true alcohol content by 0.01 percentage points or more, as shown in Panel c of Table 4. The average actual alcohol content for this group was 12.9% by volume and the average reported alcohol percentage was 13.2%, with an average discrepancy of 0.32 percentage points. Within this group, the size of the overstatement was similar between red and white wines, though the average actual alcohol content was 13.1% for red versus 12.6% for white, and similar between the New World and Old World sources, though the Old World wines had lower actual alcohol content (by about 0.5 percentage points).
A little over one-tenth of the useful sample (9,793 observations) fell into the final category shown in Panel d of Table 4, wines for which the reported alcohol percentage was within 0.01 percentage points of the actual alcohol percentage. In this category, Old World red wine had an average alcohol content of 13.0% by volume; Old World white, 12.5%; New World red, 13.6%; New World white, 13.1%.
We observe systematic patterns in the errors in Panels b, c, and d, in Table 4: a tendency to overstate the alcohol content for wine that has relatively low actual alcohol, and a tendency to understate the alcohol content for wine that has relatively high alcohol content. Indeed, even though the average actual alcohol content varies substantially among the panels for a given category of wine (e.g., the average for New World red in Panel b is 14.1% and in panel c it is 13.4%) the average reported alcohol content is virtually constant across panels (within 0.1% alcohol). It is as though the reported alcohol percentages are biased towards values of 13.0% by volume for Old World red, 12.5% for Old World white, 13.6% for New World red, and 13.1% for New World white. Some of this bias may be the result of rounding actual percentages towards a percentage that is perceived to be more acceptable.
B. A Theory of Demand for Labeling Errors
It is relatively inexpensive to measure the alcohol content of wine reasonably precisely (though some of the devices used may entail larger measurement errors), and it is necessary to do so to be informed enough to comply with tax regulations, at least in the United States. It is also an important element of quality control in winemaking. Consequently, we speculate that commercial wineries for the most part have relatively precise knowledge of the alcohol content of the wines they produce and that the substantial average errors that we observe are not made unconsciously. This speculation is based in part on discussions with several winemakers who have told us (informally, not for specific attribution) that they chose to understate the alcohol content on a particular wine label, within the range of error permitted by the law, because they believed that it would be advantageous for marketing the wine to have a stated alcohol content closer to what consumers would expect to find in a high quality wine of the type in question. Here we develop a simple theoretical model of such behavior that gives rise to an empirical specification that we can use to estimate the “desirable” ranges of alcohol content for different types of wines towards which the label claims are biased.
Suppose winemakers perceive a demand function in which the price, P, they can expect to receive for a given wine, i, in a given year, t, is a nonlinear function of its attributes including variety, V; region of origin, R; the alcohol content stated on the label, S (which may differ from the actual alcohol content); other attributes of the wine, X, that winemakers might be able to control and which may vary from vintage to vintage (including whatever else may be printed on the label in addition to variables already listed); and other variables, Z, that are not specific to the particular wine (such as shifts in consumer preferences or government policies), as follows:
 $$P_{it} = f\left( {V_i, R_i, {\rm \;} S_{it}, X_{it,} \,Z_t} \right).$$
Winemakers can influence the alcohol content and other characteristics of the wine by choosing quantities of inputs and technology, at a cost, but cannot cheaply vary the quantity of alcohol independently from other characteristics. For instance, to achieve riper, more intense fruit flavors may require longer “hang times” for grapes that also imply more concentrated sugar and higher alcohol wine. Consumers may happily pay a premium for the resulting flavors yet prefer not to have (or, at least know about) the concomitant increase in alcohol content. In such a setting, it may be profitable for the winery to give the consumer both the desired wine characteristics (including higher actual alcohol content) and the desired label characteristic, by understating the true alcohol content. This conception is consistent with explanations we have been given by some winemakers. An implication is that there exists an optimal (i.e., winery-profit-maximizing) or desired value for the stated alcohol content for any wine that is a function of all the other variables in equation (1). Assuming a simple linear form for this relationship:
 $$S_{it}^{\rm {^\ast}} = \alpha _0 + \alpha _v V_i + \alpha _r R_i + \alpha _z Z_t. $$
If there were no other cost associated with false label claims, the winery would simply apply the desired value, S*, regardless of the actual content. However, suppose the winery perceives a cost (for whatever reason) associated with the size of the discrepancy between the stated alcohol content, S it , and the actual alcohol content, A it , that it has to trade off against the cost of having a stated alcohol percentage that is different from the desired value, S*.Footnote 12 Specifically, assume the winery seeks to choose S it to minimize a total cost which is quadratic function of both (a) the size of the discrepancy between the stated and actual alcohol percentage and (b) the difference between the stated alcohol percentage, S and the desired value, S*:
 $$\mathop {\min} \limits_{S_{it}} \left[ {L_{it} = \beta \left( {S_{it} - A_{it}} \right)^2 + \left( {1 - \beta} \right)\left( {S_{it} - S_{it}^{^\ast}} \right)^2} \right]_\;. $$
The solution to this optimization problem is:
 $$\; S_{it} = \beta A_{it} + \left( {1 - \beta} \right)S_{it}^{^\ast} $$
Using (2) to replace the unobserved “desired” value in (4), and subtracting the actual alcohol content from both sides yields the following model for the observed discrepancy between reported and actual alcohol content of wine:Footnote 13
 $$\; D_{it} = S_{it} - A_{it} = \left( {\beta - 1} \right)A_{it} + \gamma _0 + \gamma _v V_i + r_r R_i + \gamma _z Z_t. $$
C. Regression Results
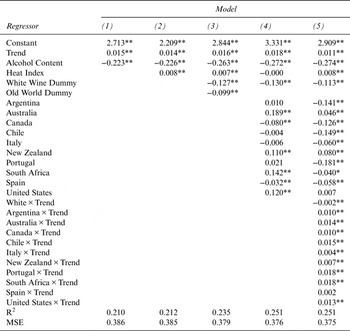
We implemented the model in equation (5) using our LCBO data. Table 5 includes the results from the estimation of five variants of this model. In the model reported in column (1), which includes a time trend and the actual alcohol percentage, the estimated coefficients imply a value of β = 0.777 (i.e., 1 − 0.223). If the actual alcohol content was 14% and the desired alcohol content was 13%, this value of β = 0.777 implies an optimal reported alcohol percentage of 13.8% by volume. The coefficient on the time trend is positive (0.015) and statistically significant, indicating that the desired alcohol content of wine has trended up over time, by 0.067 ( = 0.015/0.223, using the result in footnote 14) percentage points per year implying an accumulated increase of 1.21 percentage points over 18 years. The estimated values for β and the base time-trend effect are relatively constant across the alternative models reported in columns (2) through (6) that include additional variables to represent growing season temperature and differences among regions of the world.
Regressions of Reported Minus Actual Alcohol Percentage by Country 1992 to 2007

Notes: Dependent variable is the Difference (Reported – Actual Alcohol Percentage). France, Red and France × Trend are the default categories. ** Significant at the 1% level, * significant at the 5% level. 91,432 observations.
In column (2) of Table 5, we incorporated our heat index, which contributed significantly to the regression. In column (3) we added dummy variables for white wine and Old World so the default category is New World red wine. The estimated coefficients indicate that, ceteris paribus, desired alcohol percentages are lower by about 0.48 ( = 0.127/0.263) percentage points for white wine compared with red, and by about 0.38 (= 0.099/0.263) percentage points for Old World wine compared with New World wine.
Columns (4) and (5) include dummy variables to capture fixed effects for individual countries rather than the Old World dummy; France is the default country. In column (4), the coefficients on these dummy variables can be interpreted as indicating the difference between the desired alcohol percentage for wine from that country compared with the desired percentage for French wine. For most of the New World countries, the desired alcohol percentage is between 0.2 and 0.5 percentage points higher than the desired alcohol percentage for French wine. In column (5) we have introduced time trends interacted with the white wine dummy and with country dummies, to measure country-specific trends in the desired alcohol content of wine. The coefficient on the interaction of the trend with the dummy for white wine is negative but small, indicating that the trend in desired alcohol content has been slower for white than red wine but nonetheless positive. The country-specific trends indicate that the positive trend in the desired alcohol content of wine has been faster for wine from every other country relative to France—indeed, more than twice as fast for most New World countries, but fastest of all for Portugal.
D. “Optimal” Alcohol Content
We can infer values for the desired alcohol content for a given wine as a function of its characteristics by using the estimated parameters from (5) in equation (2). Alternatively, for any particular observation or set of observations, we can simply use the estimated value for β in conjunction with the stated and actual alcohol content:
 $$\; S_{it}^{^\ast} = \displaystyle{1 \over {\left( {1 - \hat \beta} \right)}}S_{it} - \displaystyle{{\hat \beta} \over {\left( {1 - \hat \beta} \right)}}A_{it} $$
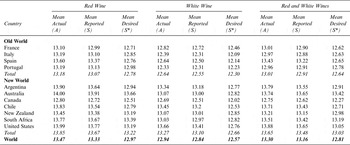
We use equation (6) and the estimate of β = 0.73 (from the model in column (5) of Table 5) to infer estimates of desired alcohol content for red wine and white wine from countries of the New World and the Old World evaluated at the sample means of the data (as shown in panel a of Table 4). The results are summarized in Table 6.
Actual, Reported, and Desired Alcohol Percentages by Country of Origin and Type of Wine, Based on β = 0.726

Notes: In the model β = 1 implies a perfectly accurate label while β = 0 implies that the stated alcohol content is equal to the desired alcohol content regardless of the actual value.
In Table 6, for red wine, white wine, and both red and white wine combined, country by country, we report the average actual (A) and average reported (S) alcohol percentage, and then the implied value for the “desired” alcohol percentage to report on the label (S*) as implied by equation (6) and using a value for β of 0.73. Consider the last row of Table 6, representing the aggregate for the world as a whole. The average actual alcohol percentage for red wine (in the first column) was 13.47% but the reported alcohol percentage (in the next column) was 13.33%, from which we infer that the desired alcohol percentage (in the third column) was 12.97%—the reported percentage is between the actual and desired, closer to the actual reflecting the fact that β = 0.73 implies putting more weight on the actual alcohol content.
The same (third) column of Table 6 includes the counterpart estimates of the desired alcohol percentage for red wine by country of origin and for the New World and Old World aggregates of countries. We can see that the “desired” alcohol percentage for red wine ranges from a low of 12.51% for Canadian wine, and just below 12.71% for French wine, up to a high of 13.66% for Australian wine, a full percentage point higher. Of course, these aggregates reflect aggregation across varietals, and we might for instance expect to see Australian Cabernet Sauvignon having a lower desired alcohol percentage than Australian Shiraz if we had data in such detail. Looking across Table 6, the middle block of three columns of numbers refers to white wines, reporting the average actual, reported, and desired alcohol percentages, country by country. For the world as a whole, the average desired alcohol percentage for white wine is 12.57% (i.e. essentially 0.4 percentage points lower than for red wine), reflecting a range from a low of 12.02% for Canadian wine up to a high of 12.85% for New Zealand wine. Again, some of these differences may reflect differences in the varietal mix as well as differences that would be found holding the variety constant.
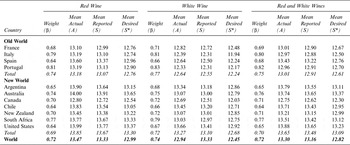
The results in Table 6 are based on a common estimate of β = 0.73 applied to all places and all years, taken from the model in column (5) of Table 5. We also estimated models in which we allowed the value of β to vary among countries or regions within countries, and between red and white wine. The results are summarized in Table 7, along with the implied estimates of the desired alcohol content of wine. Differences in reporting errors reflect differences in both the size of the discrepancy between actual and desired alcohol content of wine and differences in values of β, which range from 0.64 (for Chile, Spain, and the United States) indicating a comparatively low perceived cost for misstating alcohol content, to almost 0.80 (for South Africa and Italy) or more (for Portugal). But even countries with comparatively high β values may also have large reporting errors if their actual alcohol content is far from the desired value. The results in Table 7 show similar patterns to those in Table 6 but with some interesting differences for those countries for which the individual β values differ substantially from the value of 0.73 used in Table 6.
Country-Specific β-Values and Desired Alcohol Percentages

Notes: See note to Table 6. We estimated models with interaction terms for actual alcohol and country- and region- specific dummies to calculate the individual β's in this table.
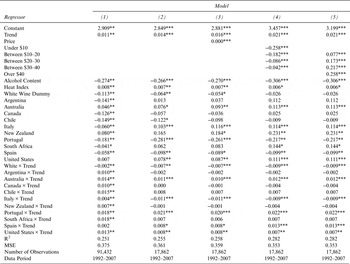
E. The Role of Prices
The propensity for mislabeling wine may vary with the price of wine. One reason is that the rates of excise tax may vary with alcohol content. For instance, as noted, in the United States the Federal excise tax rate increases by $0.50 per gallon for wine having more than 14% alcohol. For bulk wines, which may sell at wholesale for only a few dollars per gallon, an additional $0.50 per gallon is a significant disincentive for producing wines having more than 14% alcohol, whereas for premium wines this tax difference is negligible. In addition, the characteristics that incidentally give rise to higher or lower alcohol content in wine may be more or less pronounced in bulk wine versus premium wine. For instance, the intense ripe flavors of wine that are associated with high ratings by some experts and tend to be correlated with higher alcohol content may be less demanded in bulk wines than in premium wines. Rather than speculate more specifically about the relationships, here we simply propose that the actual and desired alcohol content of wine, and propensity for under- or overstating the alcohol content can be expected to vary with the price of wine. To examine this possibility we conducted some further regressions using a different sample of data from the LCBO, which included information on the price of wine as well as the other characteristics of interest.
Table 8 includes the results of several regressions. Column (1) replicates column (5) of Table 5, for purposes of comparison. This model uses 91,432 observations for the years 1992–2007. Column (2) reports the results from estimating the same model for the 17,862 observations for the years 1992–2007 for which we have prices. The results are remarkably similar between columns (1) and (2), with very similar values for the coefficients of greatest interest. Column (3) reports the results for the same model augmented with a variable representing the price (in 2010 dollars) of the wine. The coefficient on price is highly statistically significant, indicating that the reporting error increases with increases in the price of wine. The other coefficients were affected slightly by the inclusion of the price variable, but not enough to change the interpretation. The models in the last two columns include dummy variables for price categories rather than the continuous price variable. In column (4), the default category is the most expensive (over $40 per bottle) and in column (5) the default category is the least expensive (under $10 per bottle). The pattern is consistent between the two: in each case the desired alcohol content of wine increases monotonically with the price, by a percentage equal to the respective coefficient divided by the magnitude of the coefficient on the actual alcohol content, our estimate of 1 – β = 0.306, which implies β = 0.694. Relative to wine selling for less than $10 per bottle, the desired alcohol content is higher by 0.11 percentage points (wine selling for $10–$20), 0.25 percentage points (wine selling for $20–$30), 0.31 percentage points (wine selling for $30–$40), and 0.37 percentage points (wine selling for more than $40).
Regressions of Reported Minus Actual Alcohol Percentage–Price Effects

Notes: Dependent variable is actual % alcohol. “France”, “Red Wine” and “France × Trend” are default categories. ** Significant at the 1% level, * significant at the 5% level.
IV. Conclusion
A popular press article in Wine and Spirits from May of 2015 gives a profile of Pinot Noir grown in the Russian River Valley, with a focus on rising alcohol content and associated concerns. The author, David Darlington, examines a host of potential contributing factors including climate change, changes in cultural practices, and new yeasts that convert more of the available sugars into alcohol. Darlington concludes that “…whatever the clone or climate, Russian River Pinot producers are still making what they want to make” (Darlington, Reference Darlington2015).
In this paper we have used extensive data on the actual and reported alcohol content of wine from around the world to examine conjectures like these for a range of wine categories. Our results indicate that the alcohol content of wine varies systematically among countries, reflecting differences in climate, which we proxy using a measure of the heat index during the growing season for winegrapes, but also differences among varieties (lower alcohol for white than red wine varieties) and perhaps social norms (lower alcohol for countries in the Old World of Europe than for the New World producers, mainly in the Southern hemisphere and the United States). The alcohol content of wine has been trending up around the world, though at different rates in different places. Some, but not much, of this trend can be accounted for by trends in the heat index. The trend in alcohol that is not explained by the heat index is attributable to unobserved factors, such as other features of the climate or producer responses to the market, or changes in the mix of varieties or regional emphasis of production. While other measures of climate might have additional effects that we have not measured, our findings lead us to think that the rise in alcohol content of wine is primarily man-made, even if as an unintended consequence of choices made by grape growers and winemakers for other reasons.
Our analysis of the pattern of discrepancies between label claims and actual alcohol content of wine suggests that in many places the rise in alcohol content of wine is a nuisance consequence of choices made by producers in response to evolving demand for wine having more intense, riper flavors. Specifically, label claims appear to be biased towards a perceived norm, a “desired” alcohol percentage to report for a particular wine—red or white, New World or Old World—with the size of the bias depending on the extent to which the actual alcohol content differs from that norm. The implied average values for these norms revealed by our analysis are approximately 12.8% alcohol (by volume) for Old World red, 12.3% alcohol for Old World white, 13.2% alcohol for New World red, and 12.7% alcohol for New World white. The alcohol content of much wine is high and rising relative to these norms, which can account for why the label claims on average understate the true alcohol content by about 0.39% alcohol for Old World wine (red or white) and about 0.45% for New World wine (red or white).
Many studies have estimated hedonic price functions to quantify the effects of various attributes of wine, as displayed on the label, on consumers' willingness to pay for the wine. Gustafson (Reference Gustafson2011) reviewed this literature. Costanigro, McCluskey, and Mittelhammer (Reference Costanigro, McCluskey and Mittelhammer2007, p. 455) noted that “ … when regressing objective and sensory characteristics on wine price, the objective cues (such as expert rating score and vintage) are significant, whereas sensory variables (such as tannin content and other measureable chemicals) are not.” Our work suggests two points to be raised in interpreting this literature. First, given the relatively large and systematic errors in the alcohol percentage stated on wine labels, the evidence refers to consumers' willingness to pay for stated rather than actual alcohol percentages. Second, if consumers have a “desired” alcohol percentage in mind for a particular wine, we should not expect to see a simple linear relationship between willingness to pay and alcohol percentage; perhaps the models would be better specified in terms of the difference between the stated and desired alcohol percentage.
Finally, to return to our main finding, we have suggested that the substantial, pervasive, systematic errors in the stated alcohol percentage of wine are consistent with a model in which winemakers perceive that consumers demand wine with a stated alcohol content that is different from the actual alcohol content, and winemakers err in the direction of providing consumers with what they appear to want. What remains to be resolved is why consumers choose to pay winemakers to lie to them. Further work could examine whether consumers really do pay premium prices for wine that more nearly conforms to the “desired” alcohol content norms we have estimated. Our limited analysis using a subset of our data that includes information on prices indicates that alcohol content of wine is systematically related to prices in ways that are consistent with arguments related to the role of excise taxes, in particular for lower-priced wines, and the role of expert ratings, especially in higher-priced market segments.
Appendix
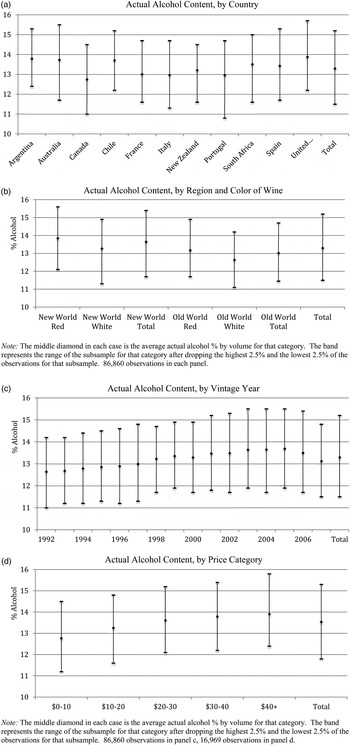
Box and Whiskers Plots of Actual Alcohol Content of Wine

Regulations of Wine Alcohol Content and Reporting Error Tolerance, by Country

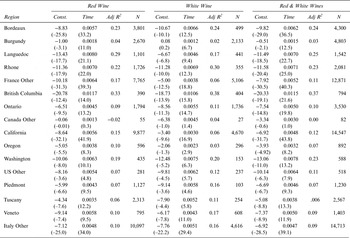
Regressions of Logarithm of Alcohol Against Time, by Region, 1992 to 2007

Regressions of Logarithm of Heat Index Against Time, 1992 to 2007

Regressions of Natural Logarithm of Heat Index Against Time by Region, 1992 to 2007

Regressions of Logarithms of Alcohol Percentage against Trend and Heat Index by Country, 1992 to 2007

Alcohol Reporting Error by Year, 1992–2007

Alcohol Reporting Error by Country and Type of Wine