Many political scientists rely on event data. Recently, researchers have begun disaggregating event flows in terms of both space and time (below the country-year level). For example, the Journal of Conflict Resolution published a special issue on disaggregating civil war studies (Cederman and Gleditsch Reference Cederman and Gleditsch2009). The World Bank and other international organizations (Frank and Martinez-Vazquez Reference Frank and Martinez-Vazquez2014) have also emphasized the importance of deeper examination of political and economic landscapes.
This trend highlights the need for customizing event data. While there are dissenting opinions (Weidmann Reference Weidmann2015), both the scientific and policy communities have recognized the value of machine extraction and automated coding of event ontologies to produce event data. Projects such as the Integrated Crisis Early Warning System (ICEWS) (Lautenschlager, Shellman and Ward Reference Lautenschlager, Starz and Warfield2015) and Phoenix (OEDA 2016) reflect such efforts. Both ICEWS and Phoenix are constructed with the features of events automatically coded, using news articles downloaded from content aggregators, such as Lexis-Nexis or Factiva. These automated event data allow researchers to extract and examine information about politically relevant events around the world in near real time.
Despite the apparent advantages of automated event data, machine coding ontologies require further research.Footnote 1 Unresolved technical issues in producing event data include machine translation of foreign languages, handling duplicate reports from multiple sources (de-duplication), and improving geolocation accuracy (Schrodt Reference Schrodt2015). While these issues are all important, we focus on geolocation in event data given the importance of geography in studying international and intrastate relations. Typically, automatic geocoding involves three steps. Named entity recognition (NER) software can capture location words from text. Then, the actual location of captured location word strings can be disambiguated by geoparsing programs, such as Mordecai, to determine the country-level geolocation (Halterman Reference Halterman2016). The last step, which is the focus of this study, involves associating events with referent locations. Software developed by ICEWS (Lautenschlager, Starz and Warfield 2016) and the CLIFF/CLAVIN approach adopted by the Phoenix pipeline (Beieler 2016) reflect recent advances in this domain. Still, event location accuracy in automated event data needs improvement.
Associating referent locations with events is challenging for several reasons. For example, news articles typically contain multiple location names, such as the location of the journalist writing the story, the capital that represents the government authority, nearby landmarks used as location references, the birthplace of a person being interviewed, and the location of a similar past event. Additionally, news summaries often refer to irrelevant event stories. These sources of noise in the text data increase the difficulty of locating events automatically. An ideal algorithm should discern irrelevant place names and only code the correct event locations. By analyzing the structure of sentences with embedded location words and extracting the contextual information in those sentences, we can train the machine to classify each location as correct or incorrect and thereby improve coding accuracy.
Departing from existing approaches, we treat the geolocation task as a classification problem wherein all location mentions in an article are evaluated and predicted to be correct or incorrect. This approach allows us to evaluate each location word using both sentence-level and document-level information without being restricted to a small subset of foci sentences, particularly improving the recall rates (i.e., the proportion of correct locations that are correctly identified as suchFootnote 2 ) of geocoding. Importantly, we generalize (i.e., tokenize) the text data, as the process helps identify collocation patterns for correct location mentions across documents.
The proposed approach is fully automated; however, it requires hand-coding of a small number of stories. While the process is generalizable, we selected 1000 raw news articles from ICEWSFootnote 3 and PhoenixFootnote 4 to demonstrate the steps required to construct customized geocoded data with a focus on identifying provinces/governorates in which the event of interest occurred.
There are 20 action types in the Conflict and Mediation Event Observations (CAMEO) ontology. Of those, we selected “protest”Footnote 5 and “fight”Footnote 6 as test cases given the relevance of conflictual events in political science research. Event types, such as “appeal,” “consult,” or “yield” do not result in as many extracted events. However, the proposed method is applicable to other CAMEO event types as long as the event location can be identified.
We began with an investigation of 250 protests in China (ICEWS, CAMEO code 14: protest); we then added (and coded) 250 violent events in the Democratic Republic of Congo (DRC) (ICEWS, CAMEO code 19: fight) and Syria (Phoenix, CAMEO code 19: fight); to further strengthen the potential generality of our approach, we added a fourth case, 250 protests in Colombia (ICEWS, CAMEO code 14: protest). The Colombian case was added for external validation; our results for the Colombian case were obtained by using the algorithm we developed for analyzing the other three cases without changing any features of the model. These countries produce a large number of news reports on conflictual events and the event locations at the subnational level vary considerably; therefore, these data are suitable test cases for our purpose.
The steps of the proposed algorithm are as follows:
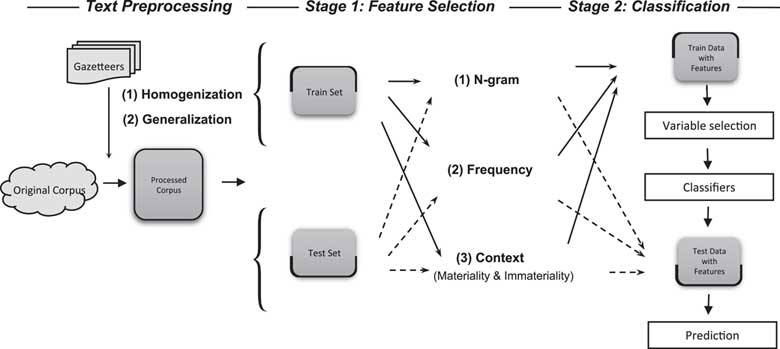
1. First, we extract three types of contextual information for location words from the training set: (A) N-gram collocation patterns for location words, (B) mention frequency, and (C) the context of sentences containing location words.
2. The extracted contextual information forms the basis of a classification model.
3. Finally, the model is used to predict whether each location mention in the test set is correct.
We demonstrate the steps by constructing customized geolocation data sets and evaluate the accuracy of the locations predicted as correct against a hand-coded set of ground truths. Our supervised machine-learning model codes locations correctly with approximately 71–87 percent accuracy and improves the accuracy of existing geocoders by as much as 40 percent.Footnote 7
STEPS IN AUTOMATED GEOLOCATION
Determining event locations involves three substantial steps: (1) NER, (2) disambiguation of location mentions in the text, and (3) association of the referent location with an event. Here, we focus on the third task, which is based on the results of the first two. In the following, we briefly review all three tasks, associated difficulties, and recent developments.
Step 1: NER
NER determines which words in a given sentence are location names. In principle, capturing location names from texts can be performed easily using a predefined gazetteer. In practice, however, developing a gazetteer that is sufficiently comprehensive for such a task is challenging. The geographic boundary of the analyzed texts may be unclear given that the domain of many event data is the entire world. Furthermore, because conflict events may spread to places that have not been previously reported and therefore do not exist in compendiums of place names, texts may include location names that are not defined in a gazetteer. Additionally, a location name may be written in multiple forms, thereby requiring the gazetteer to include all variants of each location. Multiple forms of location names commonly occur when a foreign location name is transliterated into another language, such as English. For example, the English transliterations dei ez-zor, Deir-al-Zour, Dayr al-Zawr, and dei ez-Zour all refer to the same province in Syria. Indeed, some stories include location names that have passed through transliteration from several languages (e.g., Arabic to Chinese to English).
Further complicating matters, news articles often use nearby landmarks in lieu of official names. For example, the 2014 Ukrainian revolution was often described as having taken place at Mariinsky Park rather than in Kiev. The same is true for the so-called Martyr Square (Tahrir Square) as the site of protests during the Egyptian revolution of 2011. We encountered this problem in our data as well. For example, “U.N. attack helicopters whirred overhead as armoured personnel carriers ploughed through forests in Virunga National Park [a park in North Kivu province] in Democratic Republic of Congo ….”Footnote 8
Currently, several open source NER systems are available. Popular NER programs include the Stanford Named Entity Recognizer (Manning et al. 2014), Apache OpenNLP (Morton et al. 2005), and the MIT Information Extraction (MITIE) toolkit (King Reference King2009), which was developed by MIT’s Lincoln Laboratory. Other NER programs include spaCy (Honnibal Reference Honnibal2016) and the NLTK (Steven, Klein and Loper Reference Steven, Klein and Loper2009). By parsing sentences syntactically, these programs can classify each word in a sentence into various categories, such as persons, organizations, and location names.
Step 2: disambiguation
The second step is entity disambiguation/resolution, i.e., identifying the actual location of the recognized name string (D’Orazio et al. 2014). Once this is accomplished, it becomes possible to extract the ontologically defined meaning from the text in terms of who does what to whom, when, and where via coding frameworks, such as CAMEO (Gerner, Schrodt and Yilmaz 2009), the Python Engine for Text Resolution And Related Coding Hierarchy ((PETRARCH) 2017) or another coding scheme (Schrodt Reference Schrodt2006). Entity disambiguation/resolution is an emerging research field that attempts to find methods to determine the true location of the referent location word (Rao, McNamee and Dredze 2013).
Different approaches exist for assigning location name strings to the referent location words.Footnote 9 Co-occurrences of location names, i.e., which location words frequently appear together in the corpus, could be modeled and used to associate the name strings with the true locations (Han, Sun and Zhao 2011). For example, in the sentence “The group moved to the intersection of Duke and Chapel Hill streets near the Durham Police Department headquarters” (July 21, 2016; CBS News Carolina), “Durham” would most likely to refer to a city in North Carolina, USA while the same word in the sentence “Paul Collingwood commits for another year to Durham” (July 26, 2016; AFP) would most likely to refer to a city in England.
Similarly, the Mordecai geoparsing software (Halterman Reference Halterman2016) links extracted location names to their geographic information, e.g., coordinates, from the GeoNames (2017) gazetteer using the Word2vec model (Mikolov et al. 2013) that infers the country focus given the word vectors of place names in the article.Footnote 10
Step 3: geolocation
In the last step, disambiguated location names are evaluated to determine whether they represent the event of interest. As noted previously, this step depends on the two preceding steps. Fortunately, the body of work in machine coding accumulated over past decades has made the first two steps more manageable.
One unresolved issue in this step stems from the fact that single news articles often contain several location words. Noting this issue, Schrodt and Yonamine (Reference Schrodt and Yonamine2012, 19) stated that “the main challenge is to empirically determine which place name should be assigned to the specific event, especially when multiple events and location names occur in a single article.” In the data we examined, nine out of ten news articles contained multiple location mentions. Sometimes these are due to multiple true events, i.e., a single article describing several events, but many are specious locations, e.g., the location of news agencies, the location of a similar (often previous) event, or the current location of a reporter.
This complexity raises questions about how an automated geocoder should determine which location word represents the place of the described event. The Phoenix pipeline employs the Java-based CLIFF software, which is built on top of the CLAVIN software (Beieler 2016). D’Ignazio et al. (2014, 3) explain that CLIFF/CLAVIN selects a “focus” location in the article based on the “frequencies of mentions.” Similarly, Lautenschlager, Starz and Warfield (2016, 342) describe the geolocating process in the ICEWS pipeline as “select(ing)” “the most appropriate location” after “statistically rank(ing)” the location mentions captured in sentences via NER. In short, both algorithms select a most likely location mention for each story.
However, we have observed that the above approaches may not always result in the desired outcome; the extant algorithm can be much improved in terms of accuracy calculated based on the human-coded gold standard. In the following section, we discuss issues related to the uncertainty inherent in these existing geocoders, as well as methods to reduce such uncertainty.
REMAINING CHALLENGES IN ASSOCIATING EVENTS WITH LOCATIONS
We focus on the third step in geolocation, i.e., associating events with location words and determining the “aboutness” of text data, for which the current ICEWS and Phoenix pipelines have adopted an algorithm that selects a location (or locations) as the focus (or foci) of the story. We identify two areas as remaining challenges and therefore depart from the existing approach in two ways.
Because single articles often report multiple events, as the article in Online Appendix Table A.4 demonstrates, an algorithm that is designed to pick a most likely location mention may inadvertently discard (without sufficient attention to the process) many still-likely locations. More than 30 percent of the Syrian stories we examined report more than one event and therefore contain multiple true locations. In the China and DRC data, these numbers are about one-third to one-half this amount. While ratios for other countries in the world have not been determined, we can assume that the ratio is greater than 0.
However, due to the design of the existing algorithms, which select the most likely location mention, it is rare for more than one event location is coded per story in both the ICEWS and Phoenix data. In the China data, two provinces were coded as event locations in eight out of 250 news reports,Footnote 11 and in all other reports, only one or zero provinces were coded. There were two news stories with two event locations in the DRC dataFootnote 12 and none in the Syria data. This issue could be addressed by implementing a selection algorithm that evaluates each location mention to determine whether it is a true event location rather than assessing whether it is the most likely location.
Second, in both the ICEWS and Phoenix data, event coder programs select the sentences of interest first (prior to determining potential event locations). Accordingly, location mentions in sentences not selected for event coding are excluded in the next step (i.e., determining the geographic focus of the story), resulting in a significant number of “no locations” in the geolocation data. For example, the geocoder employed by the ICEWS data uses only the first six sentences of an article (Boschee et al. 2015). The Phoenix pipeline also “code(s) only the first several sentences …” for the (frequently valid) reason that the subsequent sentences often provide “historical background or news analysis” (Halterman and Beieler Reference Halterman and Beieler2014, 5).
However, in the data we examined, approximately 6 percent (China data), 4 percent (DRC data), and 13 percent (Syria data) of the initial appearance of true location mentions were observed in the seventh or subsequent sentences. Thus, unless the location mentions in the seventh and subsequent sentences are also considered, even a perfect geocoder would capture only 94, 96, and 87 percent of the true locations in the China, DRC, and Syrian data, respectively. Defining the universe as the entire set of location mentions may not increase the accuracy rates substantially for a focus location selection algorithm; however, it could potentially improve the accuracy considerably for a classifier that evaluates the probability of each location mention being correct.
Existing methods can inadvertently omit many true event locations, thereby reducing the accuracy of the coded location names. A researcher who analyzes geolocated event data based on this approach may misinterpret the event location data, e.g., concluding that protests in China are concentrated in Beijing. On the other hand, coding all locations extracted via NER techniques as correct event locations reduces false negatives but increases false positives. A slightly more sensitive and specific approach would determine which set of location words in the article is more likely to be correct, in addition to relaxing the focus location assumption. Therefore, we have modified the existing method and developed an algorithm to evaluate all location mentions and classify each location mention as correct or incorrect.
CATEGORIZING LOCATION MENTIONS
In articles with multiple location mentions, we observed four types of mutually exclusive location words, classified based on the relevance and occurrence of events, as Table 1 exhibits. We define event-relevant locations (Type 1 and Type 3) as those that are part of the main description of the event of interest, i.e., all locations that are key to the narrative of the event of interest. Event-occurring (Type 1 and Type 2) refers to all locations where an event occurred, regardless of whether the event is the event of interest, e.g., protests or battles. Thus, the event-relevant and event-occurring category (Type 1) refers to locations where events occurred, the occurred events being within the scope of interest. We aim to detect Type 1 as the correct location words. Note that news articles often contain multiple events and consequently multiple Type 1 location mentions. While an algorithm that selects only the most likely locations cannot capture all such location mentions, multiple Type 1 locations can be captured by a classification method.
Four Types of Locations

Regarding the second category, a small portion of articles in our data contains event-irrelevant and event-occurring location words. This type is commonly observed when the raw texts are news summaries that include events that are not of interest. Examples of articles that contain both Type 2, event-irrelevant and event-occurring (Idlib and Kinshasa), and Type 1, event-relevant and event-occurring (Aleppo and Goma) locations are presented in Online Appendix Table A.1. The first example is from an article that initially describes a rebel attack involving 15 civilian causalities and then describes a ceasefire agreement, an event not of interest. Occasionally, news articles contain summaries of completely unrelated events, such as those described in the second article, which consists of six reports that summarize newsworthy events that occurred in Syria on that day.
Event-relevant and non-event-occurring locations (Type 3) complicate matters even more. For example, journalists often provide relevant background information that may recite the location of the stronghold of a rebel group, the name of the province to which victims fled, or the place where the putative perpetrators of incidents are being detained or tried. The articles in Online Appendix Table A.2 are examples of stories containing location mentions of both Type 3 (Orientale and Damascus) and Type 1 (North Kivu and Daraa). In the first article, Orientale is the place to which the rebel leader was heading, so the location is mentioned as part of the description of the rebel attack. However, the actual attack was in North Kivu, i.e., no event occurred in Orientale. In the second article, the writer mentioned Damascus to describe a goal that the rebel group wished to achieve. The actual attack was in Daraa. No event pertaining to the event described occurred in Damascus.
Event-irrelevant and non-event-occurring location words (Type 4) commonly refer to the location of news agencies and spokespersons. For example, Beijing (first article, Table A.3 in the Online Appendix) indicates where the story was written. The true event location in this article is Guangdong. As reporting locations often appear in the first line, discarding bylines in the text preprocessing step can alleviate this problem to a certain extent. However, the problem persists because reporting locations are frequently embedded in the middle of texts. Additionally, event-irrelevant and non-event-occurring location words are often embedded for other reasons, such as references to the birthplace of someone being interviewed, e.g., “‘we can mix in any society,’ said Amar Aldoura from Damascus.”Footnote 13
Based on the assessment of the types of multiple locations, we concluded that each location word should be evaluated to determine whether it is an event-relevant and event-occurring location. A sophisticated algorithm would distinguish correct and incorrect locations by filtering out the event-irrelevant and non-event-occurring locations.
CLASSIFICATION
We adopt a classification approach to determine the Boolean status (true event location or not) of each captured location word. We rely on existing NER and entity resolution (matching location strings referenced in a gazetteer) techniques to create a list of location words that should be considered for classification.
Various machine-learning techniques can be used to classify location words as correct or incorrect, such as Neural Networks (NNs) (Müller and Reinhardt Reference Müller and Reinhardt2012), Support Vector Machines (SVM) (Cristianini and Shawe-Taylor Reference Cristianini and Shawe-Taylor2000), random forests (Liaw and Wiener 2002), AdaBoost (Freund and Schapire Reference Freund and Schapire1997), K-nearest neighbors (Dasarthy Reference Dasarthy1990), and naive Bayes (Murphy 2006). The proposed algorithm does not depend on a specific model, and we tested it with NNs, SVM, and random forests.
Besides unique strengths of each model, the selected classifiers have two primary merits. First, they do not require pre-specifying the type of relationship between the covariates and response variable. For this reason, they are powerful information extraction tools that can capture underlying relationships not explained by known structures (Jones and Linder 2015).
PREPROCESSING THE TEXTS
Prior to classification, correctly formatted text data with desirable features are required. Text analysis literature describes several common preprocessing steps. Following D’Orazio et al. (2014), we removed punctuation and special characters from the text data that contain sentences with location words. We converted all sentences to lowercase letters to avoid confusion during word pattern recognition. We then removed English stop words (Shellman Reference Shellman2008). Next, we performed stemming (Grimmer and Stewart Reference Grimmer and Stewart2013) using the Porter Stemmer (Porter Reference Porter1980).
In addition to the tasks performed prior to most text analysis projects, we also performed two additional text treatment tasks that are critical in our algorithm: (1) homogenization of location words and (2) generalization (or tokenization) of texts using two existing and one newly compiled dictionary.
The homogenization step is important because the use of location names in news articles is not always consistent with respect to the spelling of location names, particularly of those in non-English speaking countries. In addition to the transliteration issue, the different conventions for stating locations also complicate the process. For example, news articles by local agencies tend to cite only city names while those by national or international agencies often indicate province names.
Accordingly, we follow the existing method that employs NER software and communicate with the Geonames (GeoNames 2017) gazetteer. We first used MITIE’s sentence parser to obtain all location mentions in our news reports. The parts of speech elements classified as location words were then sent to the Geonames’ API and the returned entity pairs were stored. Using this list of province names (standardized province/governorate names) and sub-province names (city, village, and town names, spelling variations of both province and sub-province names, and frequently used famous location names), we converted the lower level administrative division names (e.g., city) to higher level names (province/governorate) with the “sub” prefix.
As the last step in the preprocessing stage, we generalized the news texts using two existing ontology lists (actors and relevant words) and one newly built dictionary (irrelevant words, numbers, dates, and news agencies). For the actors dictionary, we imported the actor lists from the ICEWS and Phoenix data. Note that this process can be customized and performed automatically or manually. Without prior knowledge about the events in the given data, one may resort to sentence parsers to build dictionaries iteratively.
For the relevant words dictionary, we first imported action-verb lists from the CAMEO ontology. The verbs for the protest data included words such as “rally,” “demonstrate,” and “march.” For the fight data, the verb list included “air-strike,” “bomb,” and “shoot.” we added key nouns that capture the context of the location sentence, such as “bloodshed” and “casualty.” As with the process used to build the other dictionaries, the relevant words dictionary does not have to depend on an existing ontology; however, we chose to adopt the pre-existing CAMEO framework because such action verbs were used to initially collect the news articles in our data by the ICEWS and Phoenix pipelines.
We built the irrelevant words dictionary from the start of the text processing. We gathered pertinent knowledge for our dictionary while hand-coding the news articles, which is necessary for supervised classification approaches. To build this dictionary more systematically, we examined sentences that contained event-irrelevant location mentions (Types 2 and 4). While the topics of sentences containing Type 2 location words are not uniform, those containing Type 4 location words mostly pertain to the action of reporting. Thus, we gathered words that most commonly co-occurred with the Type 4 location words and used the Wordnet (version 3.0) synonym dictionary (Feinerer, Hornik and Wallace 2016) to generate a more comprehensive list. A typical irrelevant words dictionary can contain words such as “interview,” “report,” “say,” and news agency names. All three dictionaries are specific to the given text data.
Finally, dictionaries containing generic words that are not data specific were compiled. The lists included numerals, directional words (southern, southeastern, etc.), administrative units (province, village, city, etc.), the names of months (including various abbreviations), and days.
The purpose of this step is to ensure that the algorithm recognizes the following two N-grams as identical: “33 people in Beijing” and “2000 people in New York.” More tokenized sentence patterns are desirable because the approach attempts to match phrase and sentence patterns from different news articles. An example of preprocessed text is given in the right side of Table A.4 in the Online Appendix.
IMPLEMENTATION OF AUTOMATED CLASSIFIERS
As illustrated in Figure 1, the implementation of the proposed algorithm involves two stages: feature selection and model estimation. The preprocessed text data were divided into a test set and a training set, which comprises two-thirds of the data. We first captured all location words in the training set. Based on human coding, we then determined whether each location word fell into the correct or incorrect category, which becomes the dependent variable.
Illustration of the proposed classification method

Then, we computed (1) the N-gram pattern information (2–7 g), (2) the mention frequencies, and (3) the materiality of the location sentences in terms of both within-article and data-level ratios. Thus, the final generated data contained the dependent variable indicating whether the target location word is correct (Y=1) or incorrect (Y=0), as well as the three types of covariates mentioned previously. Variables with the most explanatory power were used to predict the status of the dependent variable in the test set. Each stage is discussed in further detail below.
To describe Stage 1 (feature selection), we take examples from the China data, which consist of 250 news articles about protest against the government from 2001 to 2014. On average, each article contained approximately 398 words before preprocessing and 284 after preprocessing.
Our goal is to differentiate event-relevant words from irrelevant words and event-occurring words from non-event-occurring words; therefore, we selected variables that can provide information about “event-relevance” and “event-occurrence.” Specifically the N-gram collocation patterns, frequency of location words, and context of sentences that contain the location word were extracted from the news articles.
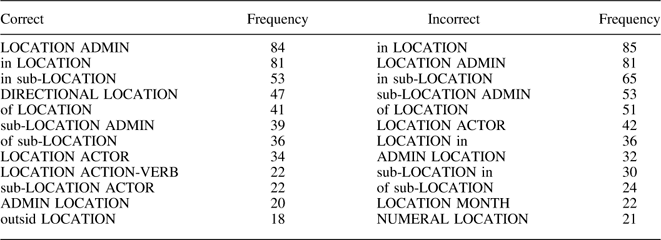
An N-gram is a sequence of N words. Collections of N-grams provide valuable information about each word in a phrase while considering the complexity and long-distance dependencies of languages. In a sentence “Factory workers protested,” an N-gram of order two (or a bigram) is a two-word sequence of words (e.g., “factory workers” and “workers protested”) while an N-gram of order three (or a trigram) is a three-word sequence of words (e.g., “factory workers protested”). Given that the collocation patterns in which the event-occurring location words appear differ from those of the non-event-occurring collocations, the N-gram patterns can provide contextual information about event-occurrence to our classifiers. Thus, we compare the frequencies of each N-gram containing the location mention in correct and incorrect lists (Table 2) and compute their relative frequencies.
Examples of Correct and Incorrect Bigram Lists (China Data)

Note: This list is extracted from a sample of 100 articles.
The bigrams (N-grams of N=2) presented in Table 2, e.g., “LOCATION ADMIN” (frequency of 84 in the correct list), “LOCATION ACTION-VERB” (frequency of 22 in the correct list), and “outsid(e) LOCATION” (frequency of 18 in the correct list), were extracted from sentences such as the following: “The Guizhou provincial government deployed thousands of police,”Footnote 14 “Workers at IBM Systems Technology Company in Shenzhen are protesting since March,”Footnote 15 and “500 villagers had been protesting outside the Qingdao naval base.”Footnote 16 Incorrect bigrams such as “LOCATION MONTH” (frequency of 22 in the incorrect list) and “LOCATION ACTOR” (frequency of 42 in the incorrect list) were extracted from phrases such as “BEIJING, Dec 3, 2007 (AFP),”Footnote 17 and “Shandong farmers protested, …”Footnote 18
After creating the correct and incorrect lists of N-grams, we compared the captured N-gram patterns to these lists. For example, from the raw text in Online Appendix Table A.5, “heilongjiang” and “beijing” would be captured. While creating covariates for “heilongjiang,” the N-gram collocation patterns, such as “of heilongjiang,” “at sub-heilongjiang,” and “in sub-heilongjiang,” were converted to “of LOCATION,” “at sub-LOCATION,” and “in sub-LOCATION,” respectively. For “beijing,” the N-gram collocation patterns “to beijing,” “beijing therefor(e),” and “in beijing” would be converted to “to LOCATION,” “LOCATION therefor(e),” and “in LOCATION.”
Then, the N-gram pattern feature was converted to numeric values in two ways. The first N-gram variables compute the ratio by which each N-gram pattern appears in the stored correct and incorrect N-gram lists. The other N-gram variables reflect how many of these collected patterns can be matched to the most frequent patterns in each list.Footnote 19
The second type of variables, i.e., the frequencies of location words, provide information about the relevance of a given location word. Assuming that the news articles in the data were well-sorted and contain articles mostly pertinent to target research interest, a set of location words that are mentioned several times should have higher chances of being correct compared to those with low frequencies (D’Ignazio et al. 2014).
Testing the context (materiality and immateriality) of a sentence that contains location words is another way to capture relevant location words. The idea is that, if the sentence contains more action verbs and key nouns, it is highly likely that the location word in that sentence is relevant. Likewise, a location word in a sentence with “report” or news agency names may be less likely to be relevant.
With these variables, we designed the data such that they can account for variations at the article and data levels assuming that (1) some location words are more correct than others in each article and (2) some articles contain location words that are collectively more likely to be correct or incorrect altogether. In other words, these variables were calculated in relative terms within the article and data levels. This means that, for within-article level variables, the most likely correct location word in each article obtains the value of 1. At the data level, the most likely location word also obtains the value of 1. For example, the relative within-article ratio of frequency for Heilongjiang in the example in Online Appendix Table A.5 would be 1 while that for Beijing would be 0.67. The within-article materiality ratio for Heilongjiang and Beijing would be 0 and 0 while the immateriality ratio for the two would be 1 and 0, respectively, because the sentences that contain Heilongjiang include “said,” which is defined as irrelevant during preprocessing and none of the sentences with Heilongjiang and Beijing include words defined as relevant.
Figure 2 presents the first 13 rows and parts of the covariates of the data generated using the Chinese news articles. The number of rows in the data equals the number of total province names that appear in all news articles. The first column represents the unique story IDs from ICEWS, and the next column contains all location words in the article. The Y variable indicates whether the location word is correct based on human coder assessment. In the data shown, the first row represents the two location mentions, i.e., “beijing” and “heilongjiang” from the example. As the column to the right side of the location mentions indicates, “heilongjiang” (second row) is the correct event location. The next four location words in rows three through six are from a single article (ICEWS story 16963437). According to the figure, only “sichuan” (fifth row) is the correct location mention.
Parts of the final data automatically generated (China data)

The covariates whose names contain the suffix “article” represent the relative ratios of the independent variables within the articles. Therefore, location words within articles that do not contain other locations are assigned the value of 1. The covariates with the suffix “data” represent the relative ratios within the data. Correct and incorrect N-grams (order two to seven), frequencies, and materiality variables are constructed in this manner.
In Stage 2, using the generated data (the training set), we fit the Feed-forward NNs, the SVM (Meyer et al. 2017), and the random forests (Liaw et al. Reference Liaw and Wiener2016) models. Then, using the random forests Recursive Feature Elimination (RFE) algorithm (Kuhn 2016), we selected the variables that, when combined, yielded the highest accuracy rates in the training data.Footnote 20 We employed the RFE algorithm, as the “main benefit of feature selection (selecting a subset of relevant features from a larger set of original ones) in small sample classification problems is to overcome overfitting problems” by discarding redundant features (Chen and Jeong 2007). The algorithm automatically selects the best combination of covariates to improve the geolocation accuracy.Footnote 21 For example, in one of the iterations (DRC data), nine covariates produced the highest accuracy rate in the training set model and the accuracy rate decreased when more covariates were added. In such a case, those nine covariates were automatically selected for the test set model.
Note that the parameters of each classifier were also automatically adjusted to obtain the optimal result (Meyer et al. 2017). The NNs model was tuned in each iteration by automatically selecting the best decay rate and number of dendrites in the hidden layer. For SVM, the kernel was set to radial and the number of trees for the random forests was set to 1000.
The estimated parameters were then used to predict the Boolean status of each location word in the test set. For the example, the average predicted probabilities for Beijing as the correct location were 6 percent (NNs), 9 percent (SVM), and 27 percent (random forests), and those for Heilongjiang were 97 percent (NNs), 75 percent (SVM), and 98 percent (random forests), thereby resulting in correct predictions for both location words.
RESULTS
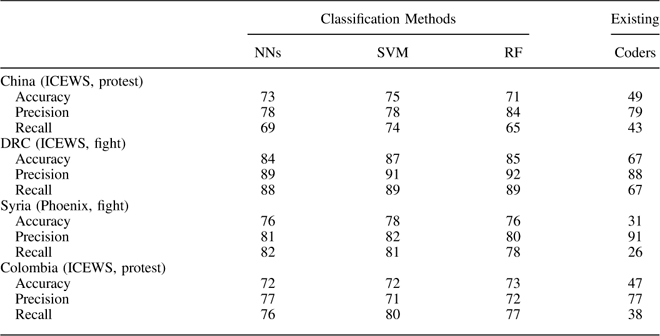
We compared the performance of the proposed algorithm against the geocoding results from existing coders (ICEWS and Phoenix). To do this we explore the accuracy, which is the percent of correct predictions, the recall, which is the true positive rate, and the precision, which denotes the number of positive predictions that were correct. Table 3 summarizes the performance, including that of the Colombian case, which we added as a special case to test the applicability of the algorithm as a generic method in new data. The rows indicate the datum used and the columns represent each method, including our classifiers. For all classifiers, we performed three separate, three-fold cross-validations; thus, the scores in the NNs, SVM, and random forests columns are the averages of nine iterations.
Accuracy, Precision, and Recall Rates of the Proposed and Existing Methods

Note: NN=Neural Networks; SVM=Support Vector Machines; RF=Recursive Feature; ICEWS=Integrated Crisis Early Warning System; DRC=Democratic Republic of Congo.
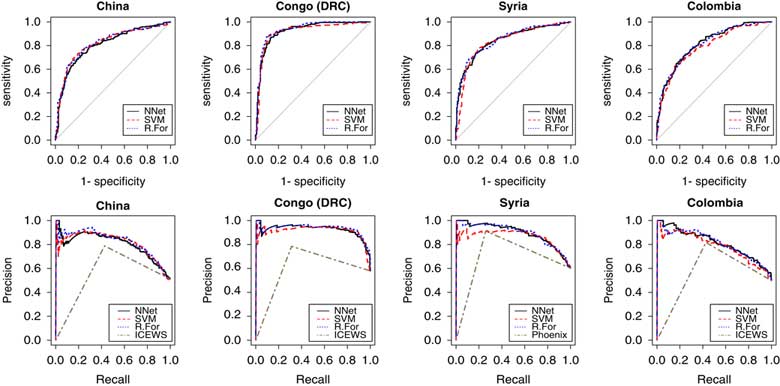
Starting from our classification models (the first three columns from the left), we calculated the ratios of correct predictions compared to the gold standard or human-coded ground truth Boolean statuses of all location mentions in each data. Across datum and classifiers, accuracy rates were greater than 70 percent for the NN, SVM, and Random Forest methods, demonstrating that the proposed approach improves the accuracy of existing geocoders used in ICEWS and Phoenix. The accuracy rates across the three classification methods did not vary significantly. As shown in Figure 3, the performance of the three classification methods is consistent. While there is no clear best model, the highest accuracy rates for the China, DRC, and Syria cases were produced by the SVM. The accuracy of the ICEWS and Phoenix methodologies are considerably less accurate. At the same time, recall rates of the classification methods are much higher than they are for the existing coders in Phoenix and ICEWS. This means that when both the existing and the proposed classification methods identify a location word to be a correct location of the event, the prediction is likely to be correct. The existing methods, however, do not make those predictions frequently enough, thereby disregarding many correct location words.
Receiver operating characteristic curves and precision and recall curves Note: The precision–recall curves of the classification methods were plotted using predicted probabilities while those of the existing coders were plotted using the Boolean statuses (whether or not each location mention is coded as the event location in the existing data). DRC=Democratic Republic of Congo; NN=Neural Networks; SVM=Support Vector Machines; ICEWS=Integrated Crisis Early Warning System.
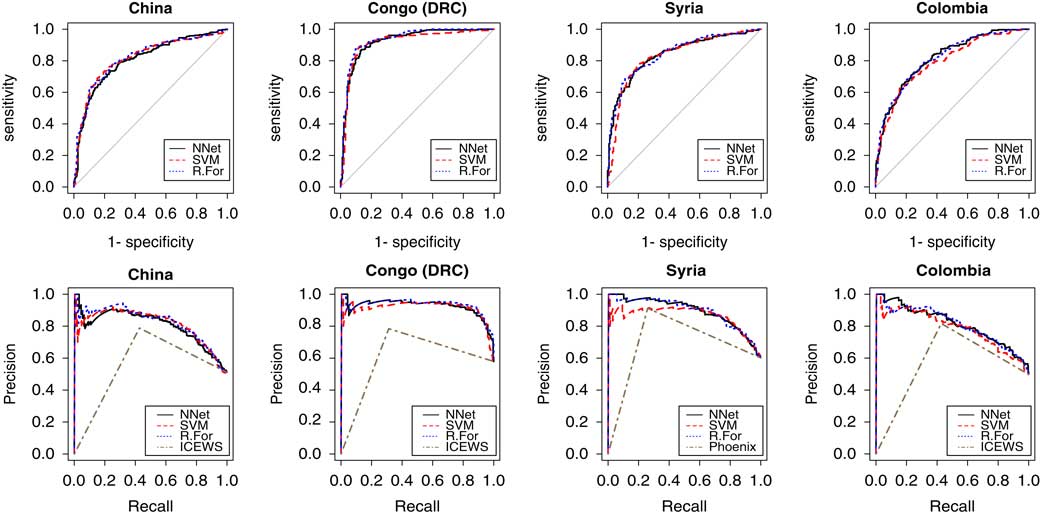
The performance of the classification models is also presented in Figure 3. The receiver operating characteristic (ROC) curves visualize the trade-off between true positive (recall) and false positive (specificity) rates, showing how the number of correctly classified positive examples varies with the number of incorrectly classified negative examples. The area under the curve is bounded by zero and one, and herein it shows that the accuracy rates are considerably higher than one would obtain by chance with probability 0.5, the area under the 45° diagonal. Moreover, the results are consistent and do not depend on a particular model across different samples.
However, ROC curves may overstate the performance of a method if the distribution of data is unbalanced due to an abundance of zeros or ones. To further examine the model performance, we also plotted the precision and recall curves, which show the trade-off between precision and recall, without being sensitive to the balance of zeros and ones. Precision measures the portion of true positives in all predictions made. Recall measures the completeness of a method, as it captures the portion of true positives identified from the universe. The precision and recall curves in Figure 3 demonstrate that the proposed method efficiently identifies both events and non-events, suggesting that the proposed classification models are more accurate than existing coders.
The curves in all of these plots are more finely grained for the proposed classification models, than for the existing coders. That is because the existing coders do not provide alternative cut points for deciding the zeros and ones in the way that the proposed method does. As a result, the comparison may not be exactly perfect, yet it is clear that the extant coders are outperformed by the proposed method.
The accuracy rates in the DRC data were consistently higher than the other three. This difference comes from the distribution of the number of true event locations in the data. The model tends to perform better when single articles contain one true location and the civil conflicts in the DRC that appear in our fight data are concentrated in a small number of areas. Accounting for this distribution, the accuracy rates across the country data sets became similar.
Next, we calculated the ratios of the existing geocoders’ codings to the ground truth. The distribution of articles with a single true location affects the accuracy of the existing schema as well, producing the highest accuracy rates in the DRC case. Compared to our classification approach, the existing geocoders have noticeably lower recall rates as Table 3 and Figure 3 demonstrate. In locations identified by the existing coders, events occurred frequently; however, many true event locations were omitted.
Our approach differs from the existing methods in two ways: (1) we evaluate all location mentions in a text and (2) our classification algorithm incorporates contextual information. Since replicating the ICEWS and the Phoenix coding processes was impractical,Footnote 22 we experimented with the data at hand to assess how much of the obtained improvement can be attributed to each strategy. We first investigated how the performance of our classifiers would change if we omitted the seventh and subsequent sentences, as the existing methods do. The results show that 2.3–2.9 percent (China data), 3.2–3.4 percent (DRC data), and 4.0–4.1 percent (Syria data) of our correctly predicted true event locations occurred in the seventh or subsequent sentences. This means that while evaluating all location mentions enhanced the results, most of the obtained improvement came from the second strategy of adopting a classification approach that utilizes contextual information of location mentions.
Importantly, even if our accuracy rate is not 100 percent, the proposed classification method does not systematically miss or favor certain locations, which explains why the recall rates are improved compared to the existing geocoders and the visualized results in Online Appendix Figure A.1 appear closer to the hand-coded truth. This is because the proposed algorithm evaluates each location word, recognizing that a single news article may report multiple events and therefore contains multiple true event locations. Overall, the proposed method shows improved performance compared to the existing geocoders.
CONCLUSION
We examined problems with current geolocation methods employed in widely used existing machine-coded event data. To address the discrepancy between automated and human coders in geolocating events, we developed a supervised machine-learning algorithm that filters out event-irrelevant and non-event-occurring location words.
Departing from the existing approach that evaluates location mentions in key sentences, we evaluated each location word in the entire article. In doing so, we extracted contextual information from the texts and used it to determine whether each disambiguated location mention represents the place of a given event. Using a human-coded gold standard, we demonstrated that the proposed approach improves geocoding accuracy in the three cases examined, as well as one additional case that we added to test the generality of the method. Our proposed algorithm diverges from the existing ones and is not biased toward certain subnational locations, such as the capital of a country and locations that appear frequently in the corpus.
While we have studied only a few countries, the developed protocol may aid others interested in geolocating events at the subnational level. Interested scholars can extend the current work to a wider range of event ontologies and locations by scraping their own text data with a clear country focus and applying the proposed approach. The proposed method can be utilized in extracting subnational location information from structured text data written in formal languages, such as the United Nations reports on Children and Armed Conflict, to create event data streams in which events are geolocated.
Automated event coding is a complicated task and recent projects, such as ICEWS and Phoenix, have made significant advances. The proposed geolocation method seeks to contribute to advancing the field by improving geocoding tasks, particularly regarding the so-called “the third task” of associating disambiguated location mentions with the event of interest.