I. INTRODUCTION
Shape memory alloys (SMAs) exhibit unique mechanical behavior because of the shape memory effect or pseudoelasticity depending upon whether the material is in the martensitic or austenitic phase, respectively. Generally, metallic alloys can only elastically deform up to approximately 1% strain. However, in austenitic NiTi SMAs, full recovery of up to 5–10% strain is possible through an austenite-to-martensite phase transformation (Humbeeck, Reference Humbeeck1999; Otsuka and Ren, Reference Otsuka and Ren2005; Elahinia et al., Reference Elahinia, Hashemi, Tabesh and Bhaduri2012; Dughaish, Reference Dughaish2014). Since NiTi SMAs have such good mechanical properties, they are used for many applications, but one major concern is their fatigue life (Eggeler et al., Reference Eggeler, Hornbogen, Yawny, Heckmann and Wagner2004; Wagner et al., Reference Wagner, Sawaguchi, Kaustrater, Hoffken and Eggeler2004; James et al., Reference James, Foulds and Eiselstein2005; Figueiredo et al., Reference Figueiredo, Modenesi and Buono2009; Pelton et al., Reference Pelton, Fino-Decker, Vien, Bonsignore, Saffari, Launey and Mitchell2013). Eggeler et al. (Reference Eggeler, Hornbogen, Yawny, Heckmann and Wagner2004) examined the fatigue life of pseudoelastic NiTi SMA wires through low cycle loading and unloading during bending; they also looked at strain localization during the phase transformation. Their results showed that irreversible strain accumulates during the pull–pull testing in bending rotation fatigue (BRF) experiments and that cracks formed at the surface of the sample after increasing the cycling load stress. Wagner et al. (Reference Wagner, Sawaguchi, Kaustrater, Hoffken and Eggeler2004) also studied the fatigue properties of pseudoelastic NiTi SMA wires using BRF experiments, by examining the effects of the wire diameter and rotation speed. Their results show that in a normal atmosphere, the surface temperature increases during cycling when the wire diameters are thicker or rotation speeds are faster, thereby lowering the rupture life. However, when wire temperatures are held constant, by providing an appropriate atmosphere, neither the wire diameter or rotation speed affects the rupture life. The effects of frequency of loading and amplitude of the strain on the fatigue life of pseudoelastic NiTi SMAs were studied by Sateesh et al. (Reference Sateesh, Senthilkumar, Satisha and Dayananda2014). They found that the low cycle fatigue life decreases with increasing loading frequency; samples with high net strains show more plastic strain, and consequently have less number of cycles to failure. Also, that the austenitic modulus and the martensitic unloading modulus are not sensitive to the minimum strain. James et al. (Reference James, Foulds and Eiselstein2005) fractured NiTi SMA wires at various loading, temperature, and environmental conditions and observed that the cracking is found at high strain levels on the compression side in bending and that compressive damage failure mode occurs in these wires when the bending strain is higher than 20%. Bechle and Kyriakides (Reference Bechle and Kyriakides2014) studied NiTi SMA tubes under bending at several temperatures in order to examine how the texture-driven, complex material asymmetry affects a simple structure showing that the nucleation of martensite is in the form of bands that organize into diamond-shaped deformation patterns, localized on the tensioned side of the structure because of the asymmetry of the material. In order to gain a better understanding of the important fatigue fracture issues in pseudoelastic NiTi SMA wires, in situ high-energy synchrotron radiation X-ray diffraction (SR-XRD) has been performed during the tensile testing by Young et al. (Reference Young, Wagner, Frenzel, Schmahl and Eggeler2010), proving that the phase transformation occurs in a localized manner along the gage length at the plateau stress. Furthermore, Cai et al. (Reference Cai, Schaffer, Daymond, Yu and Ren2014) also performed in situ SR-XRD during tensile testing to study the effect of heat treatment on NiTi SMA wires. They found that a low-temperature heat treatment decreases the residual strain in the austenite phase and improves the fatigue life of the material. Based on these previous studies and current industrial interests, there is a need for an improved understanding of the effect of bending on localized strain and micro-crack evolution to improve fatigue life in NiTi SMAs. In this study, we combine the simple bending of austenitic NiTi SMA wire with SR-XRD measurements to examine phases, texture, and residual stress in the wire.
II. MATERIALS AND EXPERIMENTS
Austenitic pseudoelastic NiTi (50.7 at.% Ni) SMA wires with a diameter of 1.26 mm were examined in bending using scanning electron microscopy (SEM) and SR-XRD. Some of the NiTi SMA wires were heat-treated at 500 °C for 30 min to form participates, which encourage phase transformation. A Netzsch 204F1 Phoenix differential scanning calorimeter (DSC) was used to determine the phase transformation temperatures. The temperature range was cycled between −5 and 65 °C with a heating/cooling rate of 10 °C min−1 and held for 5 min at the maximum and minimum temperatures. Samples were electrochemically polished at 15 V for 60 s at room temperature using a Struers LectroPol-5 machine electropolisher. SEM images were collected before and after bending using FEI Quanta 200 ESEM with energy dispersive spectroscopy. Roughly 40 mm gage lengths of NiTi SMA wires were prepared for bending experiments at the 1-ID-C beam line at the Advanced Photon Source (APS) at Argonne National Laboratories (ANL). These NiTi SMA wires were examined in the unbent condition and in the bent condition with progressively bent radii of 5.25 and 2.1 mm of the curvature, which corresponds to 0, 12, and 30% strains, respectively. These strains were calculated according to Wagner et al. (Reference Wagner, Sawaguchi, Kaustrater, Hoffken and Eggeler2004) using the following equation:
 $${\varepsilon _{\rm a}} = \displaystyle{d \over {2R}},$$
“ɛ a” is the strain amplitude where “R” represents the radius of the semicircle, and “d” is the diameter of the wire.
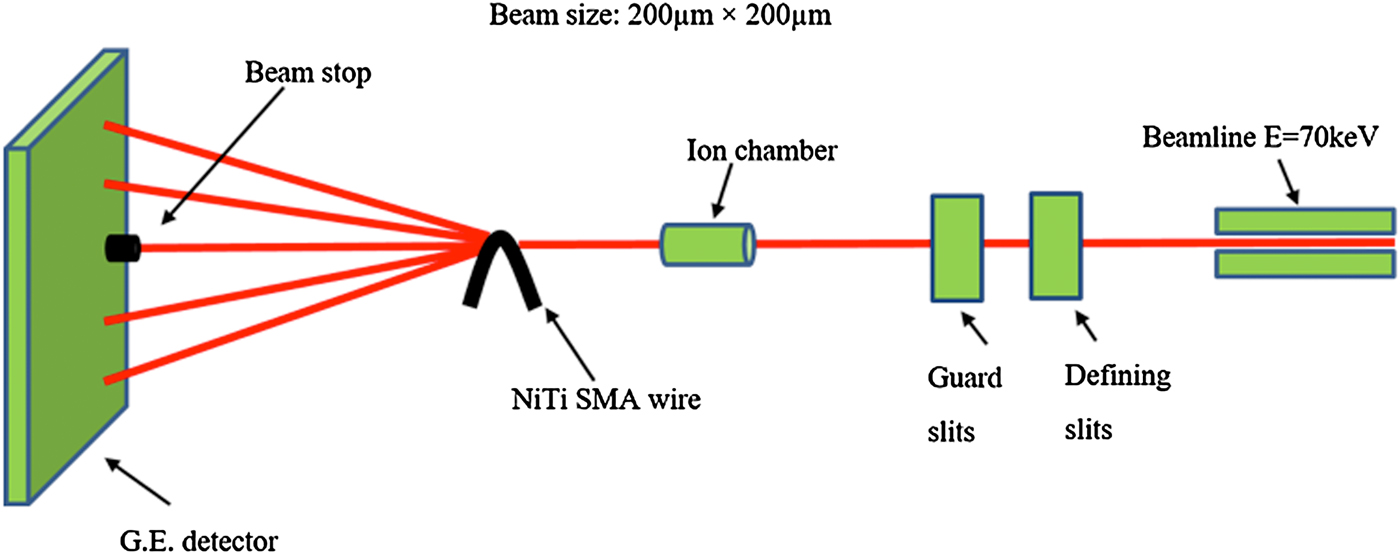
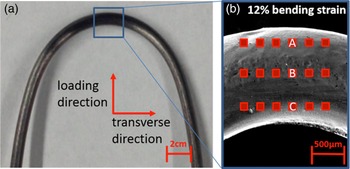
As illustrated in a schematic of the experimental setup in Figure 1, SR-XRD experiments were performed using a monochromatic 70 keV beam with a beam size of 200 × 200 µm2. Diffraction patterns were collected in three rows of six measurements (see Figure 2) and were recorded with a G.E. a-Si flat panel on-line image plate detector (410 × 410 mm2 for 2048 × 2048 pixels, 200 µm pixel size). Guard slits were used to remove the diffraction wave from the defining slits. An ion chamber and a beam stop were used to calculate the initial and transmitted beam intensities. The sample-to-detector distance is 1.377 m.
(Color online) Schematic image of 1-ID-C SR-XRD.

(Color online) (a) Optical image of NiTi SMA wire in 12% bending strain and (b) SEM image of a detailed view with points where SR-XRD measurements (red boxes) were collected. Red boxes with A, B, and C show regions of martensite in tension, austenite (neutral loading), and martensite in compression, respectively.

A customized MATLAB program was used to analyze the SR-XRD patterns (Young et al., Reference Young, Almer, Dymond, Haeffner and Dunand2007, Reference Young, Wagner, Frenzel, Schmahl and Eggeler2010). Fit2D software was used to convert diffraction patterns from polar to Cartesian coordinates (Hammersley, Reference Hammersley1997, Reference Hammersley1998). The diffraction peaks were identified using the crystallographic parameters from power diffraction files for austenite (PDF# 03-065-5537), martensite (PDF# 03-065-0145), and R-phase (Kudoh et al., Reference Kudoh, Tokonami, Miyazaki and Otsuka1985). A two-dimensional (2D) strain map was generated using a customized MATLAB program (Daymond et al, Reference Daymond, Young, Almer and Dunand2007; Young et al., Reference Young, Almer, Dymond, Haeffner and Dunand2007). Phase and strain analysis methods have been previously described in detail (Daymond et al., Reference Daymond, Young, Almer and Dunand2007; Young et al., Reference Young, Wagner, Frenzel, Schmahl and Eggeler2010, Reference Young, Gollerthan, Baruj, Frenzel, Schmahl and Eggeler2013; Cai et al., Reference Cai, Schaffer, Daymond, Yu and Ren2014).
III. RESULTS
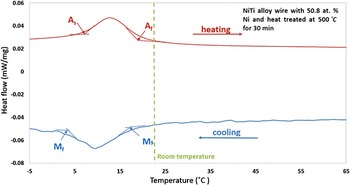
DSC curves were collected for both the as-received and heat-treated NiTi SMA wire. The DSC curve for the as-received NiTi SMA wire exhibited no transformation peaks, as they are likely shifted out of the DSC test temperature range because of large plastic deformation during processing. As illustrated in Figure 3, the DSC curve for the heat-treated NiTi SMA wire exhibits a fully reversible one-step transformation. The austenite transformation start temperature (A s), austenite transformation finish temperature (A f), martensitic transformation start temperature (M s), and austenite transformation finish temperature (M f) were determined to be 6.9, 20.1, 16.8, and 1.2 °C, respectively, for the heat-treated NiTi SMA wire. The wire is austenitic at room temperature.
(Color online) DSC curve for the heat treated NiTi SMA wire. The dashed line indicates room temperature (23 °C).

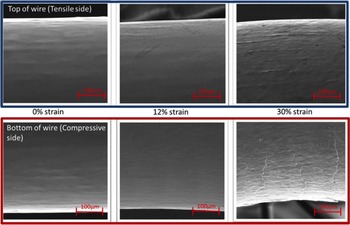
As illustrated in Figure 4, SEM images were collected at both the outer region (tensile side) and inner region (compressive side) of the bent region of the heat-treated NiTi SMA wire at 0, 12, and 30% strain, respectively. SEM images reveal that the wire: (a) looks very smooth with no apparent cracking or damage at 0% strain, (b) shows the initiation of some small micro-cracks and martensitic variants on the surface especially on the compressive side at 12% strain, and (c) shows severe micro-cracking and many martensitic variants at the surface, resulting in permanent deformation of the wire at 30% strain.
(Color online) SEM images of the outer region (tensile side; blue box) and inner region (compression side; red box) of the bent region of the heat treated NiTi SMA wire in simple bending at 0, 12, and 30% strain, respectively.

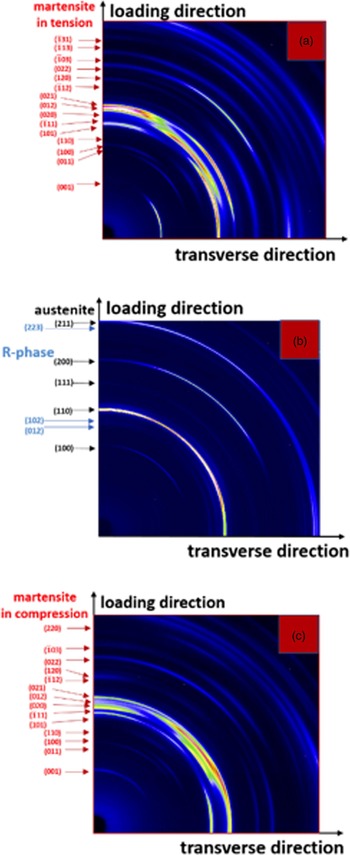
Another section of the same heat-treated NiTi SMA wire was placed in bending at 12% strain in the synchrotron beam line at the APS. As shown in Figure 2(b), a SR-XRD phase and strain maps were generated from Debye–Scherrer diffraction rings. The location of three of these Debye–Scherrer diffraction rings from the bent NiTi SMA wire are shown in Figure 2(b) (labeled A, B, and C, and correspond to regions of tension, neutral bending, and compression, respectively). The corresponding Debye–Scherrer diffraction rings are shown in Figures 5(a)–5(c).
(Color online) Representative SR-XRD patterns (quarter of image plate) at the (a) outer region (tension; martensite), (b) center region (neutral load; austenite and R-phase), and (c) inner region (compression; martensite) of a NiTi SMA wire in 12% bending strain. All of the diffraction rings were identified as either austenite, martensite, or R-phase. Lighter pixels indicate higher diffracted intensity.

The diffraction pattern for the outer region of the wire in bending shows only fully transformed martensite [Figure 5(a)] in tension. The diffraction pattern for the center region of the wire in bending shows predominantly the austenite phase with a small amount of R-phase and no transformed martensite [Figure 5(b)]. The diffraction pattern for the inner region of the wire in bending shows only fully transformed martensite [Figure 5(c)] in compression.
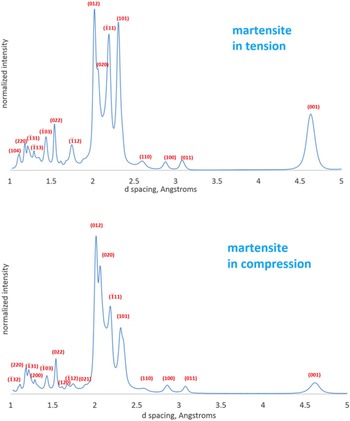
Thus, as the wire is bent, the inner and outer regions transform from austenite to martensite, whereas the middle of the wire remains relatively untransformed with the exception of R-phase. As seen microscopically (Figure 4) and by SR-XRD [Figures 5(a)–5(c)], anisotropic deformation behavior of martensite is observed between the inner region (compressive) and outer region (tensile). As illustrated in Figures 6(a) and 6(b), this anisotropy in martensite can be more clearly seen by integrating the Debye–Scherrer diffraction patterns and plotting their normalized intensities vs. d-spacing for the (a) outer region (tension) and (b) inner region (compression). For example, more grains in the loading direction are aligned in the martensite (101) diffraction plane in tension than in compression, while more grains in the loading direction are aligned in the martensite (020) diffraction plane in compression and nearly completely out of alignment in tension.
(Color online) Normalized intensity vs. d-spacing for the NiTi SMA wire illustrating anisotropic deformation behavior of martensite between the (a) inner region (compression) and (b) outer region (tension).

As shown in Figure 7, strain maps were generated from SR-XRD measurements in the loading and transverse to loading directions, which show the overall transformation behavior during bending and correspond to the same points in Figure 2(b). For the martensite (101) plane, the top row (outer region of the bent wire) shows positive tensile elastic lattice strains of the order of 3 × 10⁻³–6 × 10⁻³, while the bottom row (inner region of the bent wire) shows negative compressive elastic lattice strains of the order of −3 × 10⁻³ to −6 × 10⁻³. In contrast, the middle row (middle region of the bent wire) shows predominantly the austenite phase with no transformed martensite and only a very small amount of R-phase owing to having low tensile elastic lattice strains. The lattice strains of the austenitic phase in the middle are smaller than those from the sides of the strain map. The diffraction patterns closer to the edge of sample exhibit more lattice strain than the middle diffraction patterns show for austenite. Thus, for this middle region, only the strains from the austenite (200) plane is shown and exhibits positive tensile elastic lattice strains of the order of 0–6 × 10⁻³ with the majority of the strains being around 1 × 10⁻³–2 × 10⁻³. Figure 7(b) shows the transverse direction to loading and basically exhibits the Poisson effect for each phase and position as that compared with strains found in Figure 7(a). The volume has increased after phase transformation, the formation of martensite increase the local strains, which also induce the formation of microcarcks of NiTi wire. Further analysis of the data is presented in another publication (Carl et al., Reference Carl, Zhang and Young2016), which addresses off-axis rotation of the bent wire and its effect on texture and strain measurements.
(Color online) Lattice strain maps for a heat-treated NiTi SMA wire in the (a) bending and (b) transverse to bending directions correspond to the same points in Figure 2(b). X-and Y-axes show the distance between each SR-XRD measurement. The color bar shows the amount of elastic lattice strain present. The top row (outer region of the bent wire) and bottom row (inner region of the bent wire) show the strains only for the martensite (101) plane, while the middle row (middle region of the bent wire) shows the strains only for the austenite (200) plane.

IV. SUMMARY AND CONCLUSIONS
In the present study, we investigated the microstructure and residual strains in austenitic pseudoelastic NiTi (with 50.7 at.% Ni) SMA wires during simple bending using SEM and SR-XRD, respectively. The NiTi SMA wires were heat-treated at 500 °C for 30 min. DSC measurements showed that the NiTi SMA wire was austenitic at room temperature and that the phase transformation occurred only as a one-step transformation from austenitic B2 to martensitic B19′ and back to austenitic B2, i.e. no R-phase transformation was observed; however, Debye–Scherrer diffraction rings from SR-XRD indicated that a small amount of material was transformed to R-phase in the center of the wire during simple bending. Furthermore, the outer and inner regions of the wire in bending showed only fully transformed martensite in tension and in compression, respectively. Anisotropic phase transformation was observed when comparing transformed martensite in tension and compression. For example, more grains in the loading direction prefer to align in the (101) diffraction plane in tension than in compression, while more grains in the loading direction prefer to align in the (020) diffraction plane in compression and nearly completely out of alignment in tension. SEM images showed an increase in microcracks with increasing angle of bending.
From these results, the following conclusions can be drawn:
-
(a) SEM images show the initiation of micro-cracks as a result of bending. As more micro-cracks appear, the strains in the NiTi SMA wire become unrecoverable.
-
(b) Anisotropic behavior of fully transformed martensite is observed between the outer region (tension) and the inner region (compression) of the NiTi SMA wire during bending, resulting in some preferred crystallographic orientations.
-
(c) Strain maps generated from SR-XRD measurements in both loading and transverse to the loading directions show that positive tensile elastic lattice strains can be found in the outer region of the bent wire, while negative compressive elastic lattice strains can be found in the inner region of the bent wire for the martensite (101) plane, whereas in the middle region of the bent wire, only the austenite phase and a small amount of R-phase is present since the strain is not high enough to induce the martensitic phase transformation. In this middle region, the austenite (200) plane exhibits predominantly small positive tensile elastic lattice strains.
ACKNOWLEDGEMENTS
The authors thank Scott Robertson (NDC, now at Medtronic) for supplying the SMA materials, Matthew Carl and Nathan A. Ley for help with synchrotron X-ray diffraction measurements, Ying Qiu for help with electropolishing, and beamline scientists Jon Almer and Jun-Sang Park for help with the experiments at the Advanced Photon Source (APS) and for providing the preliminary MATLAB code to analyze the diffraction patterns. This research used resources of the Advanced Photon Source, a U.S. Department of Energy (DOE) Office of Science User Facility operated for the DOE Office of Science by Argonne National Laboratory under Contract No. DE-AC02-06CH11357. This project was financially supported by UNT's ROP grant.