

INTRODUCTION
In Who Are the Criminals?, John Hagan (Reference Hagan2012, 2) develops a race (and class) analysis that examines the political construction of crimes and their consequences. His approach draws on research on the links between political depictions of crime as a problem, people’s fear of victimization, and their perception that some groups of people are disproportionately involved in crime (see, for example, Beckett and Sasson Reference Beckett and Sasson2004). Hagan argues that sensational political constructions have criminal justice consequences that extend long past the period in which they arise. As Murray Edelman (Reference Edelman1964, 7) notes, “the link between dramatic political announcements and their impact on people is so long and so tangled.”
Hagan emphasizes that many political representations in the United States encourage the view that poor Black Americans and their communities are disproportionately responsible for street crime. In the 1950s through the 1970s, political rhetoric about crime usually focused on White American fears about violent crime, thereby helping to entrench fears of the “criminal Black man” (Russell-Brown Reference Russell-Brown1998). By the 1980s, however, claims about America’s “drug problem” increasingly dominated. Sensitive to the changing dynamic of race relations, US politicians increasingly avoided racist language in their speeches and instead resorted to coded words and dog whistles that encouraged stereotypes and fears (Haney-López Reference Haney-López2014). Their messages helped crystallize the view that Black communities were primarily responsible for drug crime and generated support for various types of crime control (Simon Reference Simon2007). These controls included increased policing of Black communities and the incarceration of its residents.
We draw on Hagan’s approach to examine civil asset forfeiture (CAF). CAF statutes allow law enforcement to retain the cash and property that they seize and that are forfeited to them. Vulnerable property includes any that law enforcement suspects is the result of illegal activity. Forfeited assets includes items used to commit an alleged crime, the proceeds from it, or property bought with the profits that the offense generated. In 1984, President Ronald Reagan expanded CAF as part of his war on drugs policies. State governments quickly followed, passing their own CAF laws and creating their own state-based forfeiture programs. Supporters of CAF laws argue that they deter crime and allow for the use of the profits of crime to fund law enforcement (see Jacobs Reference Jacobs1992; Newton Reference Newton1992). Critics argue that they are unconstitutional (Karis Reference Karis2002), incentivize law enforcement misconduct (Benson and Rasmussen Reference Benson and Rasmussen1994), and are disproportionately used to police minority communities (Doctoroff et al. Reference Doctoroff, Margaret Dooley-Sammuli, Lopez and Vieyra2016). Minority communities, and especially those with a high proportion of Black residents, have borne the brunt of the war on drugs and the incarceration escalation that it spawned (Provine Reference Provine2011). They have also been subject to an array of hostile law enforcement tactics such as the use of stop and frisk (Hannon Reference Hannon2020), fines and fees (Henricks and Harvey Reference Henricks and Cheyenne Harvey2017), and excessive force (Holmes Reference Holmes, Martinez, Hollis and Stowell2018). We examine if a similar pattern occurs for the use of CAF. We draw on Hubert Blalock’s (Reference Blalock1967) racial threat theory and examine the hypothesis that the use of CAF is associated with the size of a minority group, relative to the dominant White population.
Our analysis uses nineteen years of asset forfeiture data from California law enforcement agencies. California is a particularly useful case. As discussed below, California politicians—from President Reagan to Congressman and State Attorney General Dan Lungren—were strong advocates for CAF legislation. California police have been aggressive users of CAF: the state has typically received the largest share of returns from CAF sent to the federal government and, along with Texas and Arizona, had the highest state-based forfeiture revenues for much of the 2000s (Carpenter et al. Reference Carpenter, Knepper, Erickson and McDonald2015; Knepper et al. Reference Knepper, McDonald, Sanchez and Smith Pohl2020).Footnote 1 California also revised its state CAF law several times, but still received C grades in the reviews of its policies (Carpenter et al. Reference Carpenter, Knepper, Erickson and McDonald2015; Knepper et al. Reference Knepper, McDonald, Sanchez and Smith Pohl2020; see also Williams et al. Reference Williams, Holcomb, Kovandzic and Bullock2010), and critics charge that California law enforcement has used CAF disproportionately against Black, Latinx, and poor populations (Doctoroff et al. Reference Doctoroff, Margaret Dooley-Sammuli, Lopez and Vieyra2016).
This article proceeds as follows. We begin with a discussion of political rhetoric and the justification for CAF. We then describe the key features of CAF, CAF research, and concerns about law enforcement’s misuse of CAF, particularly in minority communities. Next, we summarize racial threat theory and research before turning to our data, measures, methods, and results. We conclude with a summary of our research, its limitations, and the questions it raises.
Crime Policy: Crisis and Normative Framing
Hagan (Reference Hagan2012) argues that government officials use “framing devices” to direct how the media and the public conceptualize and talk about crime and criminal justice practices. Legislators and regulatory agencies use “crisis framing” to direct attention to particular issues or actions, while simultaneously using “normal framing” to foster the acceptance and support of other actions, including questionable criminal justice practices. Framing devices are typically based on politicians’ moral and ideological preferences, not empirical realities. Hagan’s analysis of framing devices adds to a small but important literature on government speech about crime and its influence. Studies of political rhetoric about crime highlight the ways in which politicians try to influence how people think and talk about issues (see, for example, Beckett Reference Beckett1994). An analysis of speeches from four presidents—Richard Nixon, Ronald Reagan, George H. Bush, and Bill Clinton—shows a consistent pattern in their description of drug use and selling as the most serious problems threatening the United States, in calling for an intensification of penalties and an increase in law enforcement funding to address them, and in implying that young, impoverished Black men are mostly responsible for crime (Norris and Billings Reference Norris and Billings2017).
Politicians hope their speeches will influence a number of audiences: their political allies and adversaries, the media, various government bodies, and, perhaps most important, the public (Hill and Marion Reference Hill and Marion2016). Several studies show a strong association between public perceptions and political speech. Research finds a positive relationship between public concerns about drug use and crime and the number of drug-focused speeches and statements by federal state actors in the 1960s through the 1990s, net of crime rates, and media coverage of crime and drugs (Beckett Reference Beckett1994; however, see Hill, Oliver, and Marion Reference Hill, Oliver and Marion2012). Other research finds a similar pattern between presidential State of the Union speeches and public concerns about drugs (Oliver, Hill, and Marion Reference Oliver, Hill and Marion2011). Collectively, these studies support politicians’ beliefs that their rhetoric influences public attitudes and support for their policies.
The War on Drugs and Civil Asset Forfeiture
President Nixon introduced the phrase “war on drugs” in a 1971 speech to the US Congress (Rosino Reference Rosino2021). The phrase aptly reflected more than a half-century of domestic and foreign policies directed against drug production, distribution, and use (Provine Reference Provine2011); however, Nixon had a bifurcated policy toward drug use. He repealed the mandatory minimum federal sentence for possession of marijuana and provided funding for drug treatment but used calls for “law and order” and drug arrests as a way to win support of White voters and to associate drug use with street crime more broadly and with Black Americans and other minorities. The Reagan administration built on the more punitive parts of Nixon’s policy and effectively orchestrated media and public concerns about illegal drugs. President Reagan was not the first US president to make crime policy a central plank of his administration; however, as Hagan (Reference Hagan2012) notes, he was particularly successful in manipulating the media and the public to support policies and practices that reflected his administration’s ideological interests and to disregard data that contradicted them.
According to Hagan (Reference Hagan2012), President Reagan had successfully used a law-and-order framing to win the governor’s race in California. In this early campaign, Reagan’s focus was mostly on White Americans’ fears of violent crime; he expanded his framing to include drug crimes for his presidential campaign. As we show below, Reagan used a drug crisis narrative that had several components, including claims that a drug epidemic was decimating America and that the drug trade primarily involved organized crime. Similar to most other post-civil right politicians, President Reagan did not explicitly connect drugs to Black communities; instead, he used phrases like “law and order” and references to the need for more police, which, as Hagan (Reference Hagan2012) argues, indirectly reach people concerned about perceived threats to the racial order. These terms are code word for Black communities and their residents (Rosino Reference Rosino2021) and, as Ian Haney-López (Reference Haney-López2014) underscores, obscure their racial roots. Haney-López argues that President Reagan used code words in his normative framing as a way to link race to crime “surreptitiously” and to appeal to those who eschewed explicitly racial rhetoric (36); however, President Regan also used them as a “strategically” racist strategy to connect with overtly racist voters (46). And there were times when President Reagan was less opaque, such as, for example, in a speech to police chiefs, when he remarked: “We must never forget the jungle is always there waiting to take us over. … I commend you for manning the thin blue line that holds back a jungle which threatens to reclaim this clearing we call civilization” (Reagan Reference Reagan1981; emphasis added).
In a 1982 speech, President Reagan said his administration would focus on harsh penalties for offenders and particularly for the “syndicate or organized criminals” responsible for the drug trade. He argued that the public supported this approach: “[N]ine out of ten Americans believe that the courts in their home areas aren’t tough enough on criminals” (Reagan Reference Reagan1982). In a 1984 weekly address to the nation, he criticized the US Congress for failing to support his administrations’ policies and used fear of crime as a way to enlist public support for them: “Shouldn’t we have the right as citizens of this great country to walk our streets without being afraid and to go to bed without worrying the next sound might be a burglar or a rapist? Of course we should. But in reality we don’t” (Reagan Reference Reagan1984). President Reagan referred directly to CAF in this address, arguing that it (and his other drug policies) “would be a severe blow to the crime czars” and rhetorically asking: “Why should any right-minded person oppose it?”
President Reagan continued his crisis narrative in his second administration. In a 1986 Address to the Nation, with Nancy Reagan, he told Americans:
Drugs are menacing our society. They’re threatening our values and undercutting our institutions. They’re killing our children. From the beginning of our administration, we’ve taken strong steps to do something about this horror. Tonight I can report to you that we’ve made much progress. … Last year alone over 10,000 drug criminals were convicted and nearly $250 million of their assets were seized by the DEA, the Drug Enforcement Administration. (Reagan Reference Reagan1986)
In the same speech, President Reagan vilified drug users, charging that “[d]rug abuse is a repudiation of everything America is.” Nancy Reagan echoed her husband’s sentiments, making it clear that the war on drugs policies was not intended to focus only on high-level drug dealers: “Now we go on to the next stop: making a final commitment not to tolerate drugs by anyone, anytime, anyplace” (emphasis added).
President Reagan drew on questionable reports and advice from law enforcement officials in his comments about crime (Benson and Rasmussen Reference Benson and Rasmussen1994; Hagan Reference Hagan2012). For example, in the early 1980s, only a very small proportion of surveyed Americans—3 percent—described drugs as the nation’s most important problem (Beckett Reference Beckett1994), yet President Reagan enthusiastically increased drug enforcement funding—for example, from eighty-six million dollars to one billion dollars for the Drug Enforcement Agency (Haney-López Reference Haney-López2014). He also expanded the use of mandatory minimum sentences, adding twenty-nine for drug offenses. As a result, incarceration for drug offenses more than doubled in the 1980s, contributing to the mass incarceration that would characterize US penal practices for a half-century (Caulkins and Chandler Reference Caulkins and Chandler2006). Drug arrests disproportionality targeted young Black and Brown men and women and their communities. According to Hagan (Reference Hagan2012, 64), these patterns are influenced by “prejudicial and discriminatory laws and law enforcement [that] make minority group members more vulnerable to drug arrest and imprisonment.” As a result, drug laws and racial oppression in the United States are inextricably connected (Rosino Reference Rosino2021).
Civil Asset Forfeiture
Asset forfeiture has a long history; its current incarnation is rooted in the Comprehensive Drug Abuse Prevention and Control Act passed in 1970 by the US Congress. The 1970 Act focused mostly on drugs and the vehicles used to transport them (Jensen and Gerber Reference Jensen and Gerber1996; Karis Reference Karis2002); a 1978 expansion added drug trade profits and assets purchased with them (Stahl Reference Stahl1992). In 1984, President Reagan introduced the Comprehensive Crime Control Act, which allowed law enforcement to seize assets, and have them declared forfeit, that they suspected were connected to illegal activity. Federal CAF required a low burden of proof (that is, probable cause as opposed to reasonable doubt), did not require an arrest or conviction, and placed the burden on the owner to demonstrate that the seized asset was not connected to illegal activity (Barnet Reference Barnet2001). It is the asset, not its owner, that was suspect (in rem) and that was not protected by rights related to unreasonable search and seizure, double jeopardy, right to counsel, or excessive fines.
Most states—and many municipalities (Pimentel Reference Pimentel2018)—subsequently adopted their own CAF laws (Edgeworth Reference Edgeworth2004; Williams et al. Reference Williams, Holcomb, Kovandzic and Bullock2010). California established its state CAF in 1989, revised it in 1994, and again in 2016 (Karis Reference Karis2002). In the analysis we present later in this article, we focus on CAF processed under California state law from 2002 through to 2020. For most of these years, a case for CAF in California involving personal property valued under twenty-five thousand dollars only required “clear and convincing evidence” and not a criminal conviction.Footnote 2 Advocates for CAF in California used rhetoric similar to that used by President Reagan. Dan Lungren, for example, was an ardent CAF supporter. As a Republican congressional representative, Lungren was the principle sponsor of President Reagan’s federal CAF program and made sure of its success in congress (Newton Reference Newton1992). As California’s attorney general, he advocated for increasing the scope of CAF in California when it came up for renewal in the early 1990s. He argued, for example, that expanding state CAF was the “single most important issue facing law enforcement” (Jacobs Reference Jacobs1992). He described CAF as law enforcement’s most powerful weapon, akin to “taking a dagger to the heart of the drug trade” (Jacobs Reference Jacobs1992). Similar to President Reagan, Attorney General Lungren emphasized that CAF focused on high-level offenders—and not regular residents—claiming it “strip(s) drug dealers of their ill-gotten gains and thwart(s) their efforts to turn drug profits into large amounts of cash, expensive cars, boats and other high-priced toys” (Jacobs Reference Jacobs1992).
CAF Research
Most research on CAF has examined the extent to which law enforcement use forfeited property to fund their activities, pursue CAF to the neglect of other law enforcement responsibilities, and focus more on drug users and low-level sellers rather than upper-level drug dealers (see, for example, Benson et al. Reference Benson, Kim, Rasmussen and Zhehlke1992; Bishopp and Worrall Reference Bishopp and Worrall2009; Holcomb et al. Reference Holcomb, Williams, Hicks, Kovandzic and Bisaccia Meitl2018; Goldstein, Sances, and You Reference Goldstein, Sances and Young You2020; Kantor, Kitchens, and Pawlowski Reference Kantor, Kitchens and Pawlowski2021). A small number of studies have examined the use of CAF in minority communities (Baicker and Jacobson Reference Baicker and Jacobson2007; Worrall and Kovandzic Reference Worrall and Kovandzic2008; Helms and Costanza Reference Helms and Costanza2009), but these concern revenue generation and the use of federal versus state programs to process forfeitures. A report by the American Civil Liberties Union on CAF in California provides some initial evidence of possible police bias in its use (Doctoroff et al. Reference Doctoroff, Margaret Dooley-Sammuli, Lopez and Vieyra2016). It notes that, in 2013 and 2014, more than 85 percent of federally adjudicated CAF claims were from agencies that policed communities in which “people of color” constituted more than half of the population (Doctoroff et al. Reference Doctoroff, Margaret Dooley-Sammuli, Lopez and Vieyra2016, 6). Lower-income communities also bore a heavier burden than did others.
Racial Threat Theory and Policing
The possibility that law enforcement will use CAF disproportionately against minority groups resonates with ideas that Blalock (Reference Blalock1967) posited in his group on racial threat theory. Drawing on work in the conflict tradition (for example, Blumer Reference Blumer1958), Blalock argued that a dominant racial group uses a variety of resources to preserve its dominance over subordinate groups and guard against a variety of macro-structural threats. Blalock focused primarily on two threats—economic and political—while subsequent work extended his ideas to symbolic threats (Dollar Reference Dollar2014; Chiricos, Pickett, and Lehmann Reference Chiricos, Pickett, Lehmann, Chouhy and Cochran2020). Economic threat mostly concerns competition for jobs, wages, and occupational status, and so it is political and symbolic threats that are most relevant to our study. Blalock (Reference Blalock1967, 118–19) argued that by the 1960s the power to punish, the use of force, and “police power” were the key resources left for the dominant White population in the United States to use in its control of others. He maintained that pressure resources like these require “continuous application and close surveillance” (119). Blalock theorized that, in order to preserve the resources and privileges that domination provides, the White population, and its representatives (for example, politicians and law enforcement) would use pressure resources in discriminatory ways to retain political power.
Racial threat theory allows for racial animus and individual discrimination but focuses on instrumental discrimination by a dominant group. Police power is a basic tool for discrimination because it communicates the power of the dominant group to punish, and it uses this power and the threat of its application to control. According to the theory, the positive relationship between the use of threat-based discrimination, such as various forms of policing, and the percentage of Black residents would be nonlinear, curving upward with an increasing slope, and thus best estimated with a logged measure (sometimes called a power-threat hypothesis, distinguishing it from hypotheses of a linear relationship or a relationship that is initially positive before turning negative when a minority group reaches parity with the dominant one). This relationship should be evident in static analyses that compare the size of the Black population relative to White residents across areas as well as in dynamic analyses that examine increases in the population of Black residents relative to the population of White residents.
Allen Liska and Mitchell Chamlin (Reference Liska and Chamlin1984) added to Blalock’s thesis, arguing that dominant groups could use a symbolic threat that connected minorities to crime as the basis for discrimination (Chiricos, Pickett, and Lehmann Reference Chiricos, Pickett, Lehmann, Chouhy and Cochran2020). As we noted earlier, politicians have encouraged the perception that crime, and particularly drug crime, is concentrated in Black communities. These perceptions foster support for the use of an array of tactics to police minorities; minorities perceived as posing a political threat. According to this thesis, the percentage of Black residents in an area would be positively associated with policing independent of the level of crime; there is, however, uncertainty about whether this relationship is linear or curvilinear in part because law enforcement may introduce discriminatory practices independent of any influence from the dominant group (Holmes Reference Holmes, Martinez, Hollis and Stowell2018).
There are now a number of reviews of the many studies—upwards of a hundred—that examine racial threat theory and criminal justice outcomes (Dollar Reference Dollar2014; Feldmeyer and Cochran Reference Feldmeyer, Cochran, James, Shaun and Chouhy2018; Holmes Reference Holmes, Martinez, Hollis and Stowell2018; Stults and Swagar Reference Stults, Swagar, Martínez, Hollis and Stowell2018; Chiricos, Pickett, and Lehmann Reference Chiricos, Pickett, Lehmann, Chouhy and Cochran2020). These reviews note that racial threat research has used an array of measures of threat, examined a variety of criminal justice outcomes, explored a diversity of units of analysis, and examined linear and nonlinear, mediating, and moderating relationships. We cannot do justice to this complexity here and focus instead on broad conclusions about minority group size and law enforcement.
Overall, there is strong evidence of the predicted relationship between the percentage of Black residents in an area and the amount of money dedicated to law enforcement and the number of law enforcement officers (Dollar Reference Dollar2014; Feldmeyer and Cochran Reference Feldmeyer, Cochran, James, Shaun and Chouhy2018; Holmes Reference Holmes, Martinez, Hollis and Stowell2018; Stults and Swagar Reference Stults, Swagar, Martínez, Hollis and Stowell2018; Chiricos, Pickett, and Lehmann Reference Chiricos, Pickett, Lehmann, Chouhy and Cochran2020). Most, but not all, studies also find that the percentage of Black residents in an area is positively associated with excessive use of force and fatal shootings by police (Holmes Reference Holmes, Martinez, Hollis and Stowell2018; Stults and Swagar Reference Stults, Swagar, Martínez, Hollis and Stowell2018). Some early research on these topics focused on linear relationships, but more recent studies examine nonlinear relationships, typically with a logged variable (see, for example, Carmichael and Kent Reference Carmichael and Kent2014) but sometimes with linear and quadratic measures (see, for example, Smith and Holmes Reference Smith and Holmes2014). There is less research on stops and searchers; some studies find that these are associated with the percentage of Black residents, but this research has also not consistently explored which form best represents the relationship (see, for example, Hannon Reference Hannon2020). Although some early studies found a positive, non-linear relationship between arrest and the percentage of Black residents, the current consensus is that there is little evidence of this relationship (Chiricos, Pickett, and Lehmann Reference Chiricos, Pickett, Lehmann, Chouhy and Cochran2020).
Although Blalock focused on White American’s domination of Black Americans, his thesis may apply to an array of dominant subordinate relationships in which the size of a minority group—and its potential to acquire a greater share of political power—is perceived as threatening to the majority. In recent years, scholars have voiced concerns that the dominant White population may increasingly see the percentage of Latinx residents as a threat to their power. There is, however, relatively little research that explicitly uses racial threat theory to examine this relationship, and the results from this research are inconclusive (Chiricos, Pickett, and Lehmann Reference Chiricos, Pickett, Lehmann, Chouhy and Cochran2020). The increased use of criminal justice financial penalties—fines, fees, and other monetary punishments—has raised concerns that the legal system uses these things in discriminatory ways. Most analyses of these legal financial obligations (LFOs) use individual-level data; a notable exception is Kasey Henricks and Daina Harvey’s (Reference Henricks and Cheyenne Harvey2017) analysis of LFOs in communities that have a population of at least 650,000 residents. They find positive associations between LFOs and the percentage of Black and foreign-born individuals (but not the percentage of Latinx), net of crime, and other population attributes. These findings are consistent with the thesis that revenue extraction in the criminal justice system disproportionately targets minorities, but the relevance for racial threat theory is limited because the study only examines linear relationships.
In sum, racial threat theory and research suggest that the percentage of Black residents has an accelerating association with several, but not all, aspects of policing. These findings raise the question of the form of the relationship, if any, between the percentage of Black residents and the use of CAF. Racial threat theory raises the possibility that CAF may be used as a tool to preserve power arrangements that benefit White residents relative to Black residents whom they see as a political or symbolic threat. A similar pattern may occur for other minority groups. Critics of CAF argue that Black, Latinx, and poor residents have disproportionately endured the worst of CAF (Doctoroff et al. Reference Doctoroff, Margaret Dooley-Sammuli, Lopez and Vieyra2016), but there is, to our knowledge, no systematic analysis that addresses these claims. We examine them with a department-based analysis of nineteen years of CAF data from the annual reports of the California Attorney General’s Office.Footnote 3
DATA AND METHODS
Data
This project used four sets of data. The first is law enforcement agency based and contains yearly information on state-based CAF from 2002 to 2020. There are 521 unique law enforcement agencies in California, 486 of which provided CAF data in our study period (visual examination of missing agencies suggest that they are mostly those with a restricted scope, such as those located in colleges and universities). Three additional data sets contain jurisdiction-level information where agencies are located; these provide demographic data, crime rates, and contextual information. We built an agency-jurisdiction dataset with cases of agency-year pairs, such that there was one case for a department for each year that it appeared in the data. We added contextual information for each agency at the jurisdiction level. For police departments, our jurisdiction data are for the city or town where the headquarters were located; for sheriff offices, the jurisdiction data are for the county where they were stationed. We excluded any data point whose coefficient of variation (CoV) exceeded 40 percent (a large CoV signals a large standard error).
Dependent Variable: Number of Civil Asset Forfeitures
The California Department of Justice publishes yearly portable document format (PDF) reports of state-based CAF. We extracted data from these reports on the number of yearly seizures for which an agency received revenue from 2002 to 2020 (2002 is the earliest year that these reports are currently available). There were 257,694 CAF cases in this period. We used Bonferroni’s p-value to identify outliers and removed any case with a p-value lower than 0.05 (n = 380). We built a system to extract information from the PDF reports and convert it to analyzable tabular data. We used the R language and the following steps to extract the data (R Core Team 2017). First, we defined the bounds of each year’s report (these shifted slightly in some years) and used the predictable formatting to generate columns from regions on the page. Second, we ran optical character recognition to translate images into PDFs with electronic text for years that did not provide machine-readable reports (we used the R implementation of Google Tesseract for this task). Third, we examined random samples of report pages and scraper output to test for errors. We selected, within years, a random page in the original report or a row in the resulting data frame and then checked with the corresponding input/output. We conducted 640 checks and found nineteen errors (3 percent); we then adjusted the tool code to correct them.
Independent Variables
We measured our key independent variables, logs of the percentage of residents in a law enforcement agency’s jurisdiction who identified as Black and the percentage who identified as Latinx, with data from the American Community Survey’s five-year estimates (ACS5), grouping years into chunks for analyses (2020–16, 2015–11, 2010–19, and the 2000 census).
Control Variables
Racial segregation adds another layer of complexity to the relationship between policing and race. As Malcolm Holmes (Reference Holmes, Martinez, Hollis and Stowell2018) notes, segregation may reduce the threat of a minority population by isolating it from the dominant group; alternatively, the symbolic threat of a minority group may be intensified when it is segregated. There is some evidence that the hyper-segregation of Black residents in the United States is associated with more frequent and intensive policing (Holmes Reference Holmes, Martinez, Hollis and Stowell2018). Thus, segregation of a racial minority, rather than its size, may be the more important factor. Several tests of racial threat theory have included a measure of segregation, but researchers have used an array of measures of segregation, and the results are inconsistent (Feldmeyer and Cochran Reference Feldmeyer, Cochran, James, Shaun and Chouhy2018; Holmes Reference Holmes, Martinez, Hollis and Stowell2018). We included Peter Blau’s (Reference Blau1977) diversity index as a measure of racial segregation. The Blau index is an estimate of the probability that two individuals chosen at random from a law enforcement agency’s jurisdiction will be of different race or ethnicity. It ranges from zero to one, with zero indicating a completely homogeneous jurisdiction, while one is perfectly heterogeneous.
Several other control variables that may contribute to the number of CAF seizures are based on ACS5 data: the percentage of residents whose household income fell below the poverty level (we considered including household income, but it was collinear with the percentage of poor people); the percentage of residents who owned their home; the percentage of people who said they were born outside the United States; and the percentage of male residents aged eighteen to twenty-four. We also included two controls for crime. The first focuses on violent crime as defined by the Federal Bureau of Investigation’s (2020) Uniform Crime Reports (UCR): murder and non-negligent manslaughter, rape, robbery, and aggravated assault. We obtained these data from California’s Open Justice Crimes and Clearances, which has better coverage than the UCR in California. Our second measure—drug arrests—is from California’s Open Justice Arrests. These data were available only for the county level, which works fine for county-based law enforcement but is a proxy for drug arrests in agencies that are based on smaller units within counties. We standardized the yearly measures of violent crime and drug arrests by the number of residents (per ten thousand) in a jurisdiction.
We controlled for the economic situation of the jurisdiction where an agency was located with data on the dollar value of the jurisdiction’s revenue. This measure is based on California city and county revenue (for example, taxes) collected by a jurisdiction in a fiscal year. CAF research has used agency-operating budgets from the Law Enforcement Management and Administrative Statistics (LEMAS) and the Census of State and Local Law Enforcement Agencies (CSLLEA). Our measure is highly correlated with the LEMAS and CSLLEA measures (r = 0.94 for matching years) but, unlike them, is available for each year in our study. We have revenue data for 89 percent of the agencies in our study. Combining our measures from the various datasets required a consistent identifier for matching. We started with the Law Enforcement Agency Identifiers Crosswalk, which contains agency location information and common identifiers (for example, the Originating Reporting Agency Identifier (ORI) number, agency type, and geo-location). There are several gaps in the crosswalks, especially for small agencies or agencies in special jurisdictions (for example, law enforcement agencies housed in schools).
We used agency names as a second way to match across data sources. We standardized names by converting all text to lower case, standardizing spaces, expanding all contractions, unifying terms like department and office, and replacing phrases like “department of public safety and welfare” with the more common term “police.” We then matched individual datasets by agency name to the crosswalks using string distance matching. String difference is a numerical score describing the difference (or distance) between two strings of characters. This method allowed us to match the bulk of our agency names by finding minimally different strings. We visually inspected the remaining strings to assure good matches. We used entries from previous or subsequent years when an agency was missing an identifier (for example, the ORI number). We repeated this process for every new dataset, each matching onto a compiled dataset. We did all matching in code, so it is reproducible from the raw data.
Methods
We used a Poisson distribution generalized linear model with clustered standard errors to examine associations. This model is appropriate because forfeitures is a count variable that is heavily skewed toward zero with a seventy-fifth percentile value of thirteen but a maximum of 588. Examining regression diagnostics such as the residual versus fitted values, quantile-quantile plots, standardized residuals, and Cook’s distance supports a good model fit. We clustered the standard errors by agency and year because our cases are agency-year pairs. The clustered standard errors account for the correlation caused by a single agency appearing repeatedly over the years (that is, County A 2016, County A 2017, and so on). Clustering has no impact on the coefficient of a variable, but typically enlarges standard errors, making the model more conservative in its demarcation of statistical significance.
We explored but decided against using multiple imputation to address the sparsity of some of our data points. Multiple imputation tripled the number of cases in the model, but it did not substantively change the direction or significance of our coefficients. Further, the model with imputed data had higher model fit scores compared to the unimputed data (for example, Akaike Information Criterion scores of 12,344 and 7,414 respectively). Instead, we linearly interpolated between known data points to fill gaps in the dataset
RESULTS
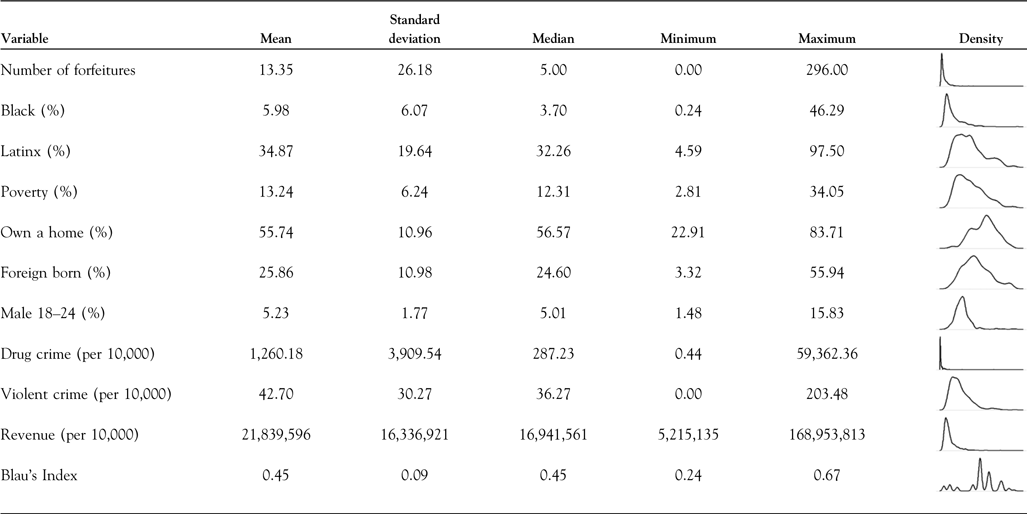
Table 1 provides a summary of our primary variables for our study period (2002–20). There is significant variation in our dependent variable, the number of forfeitures, given that they cover jurisdictions from Vernon City (in 2009, the population was sixty-three with one seizure) to Los Angeles (in 2009, the population was 3,796,840 with 485 seizures). There is also notable variation in our key independent variables. The percentage of Black residents in California jurisdictions ranges from 0.2 percent (for example, Watsonville) to about 46 percent (for example, Inglewood) with an average of just under 6 percent. The percentage of Latinx residents ranges from 5 percent (for example, Beverly Hills) to about 97 percent (for example, Maywood). Data on the percentage of people living below the poverty line show California’s stark economic inequality: some jurisdictions have only 3 percent poor (for example, Pleasanton), whereas almost 66 percent live below the poverty line in other jurisdictions (for example, Barstow). On average, about 13 percent of residents did not earn enough to lift them out of poverty. Meanwhile, the percentage of the population that was born outside of the United States ranged from about 4 percent (for example, Ione) to 56 percent (for example, San Gabriel), with a mean of 26 percent.
Data summary, asset forfeitures, and jurisdiction attributes, California, 2002–20

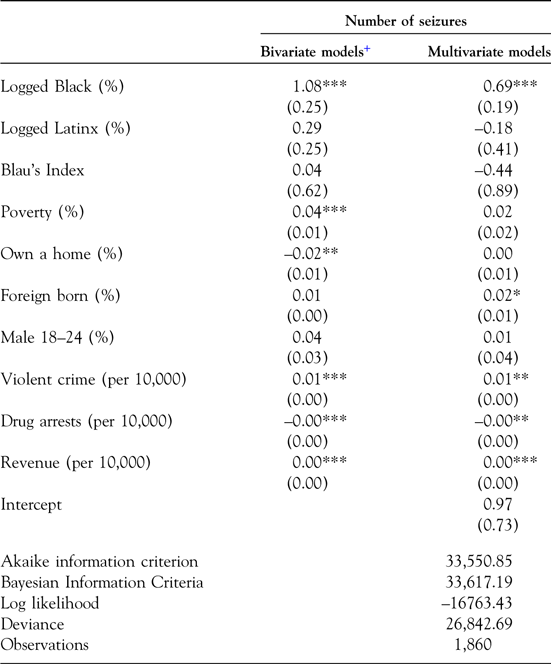
We begin our analysis with a review of bivariate regression coefficients (Table 2, column one). There are several notable associations. Consistent with racial threat theory, the number of forfeitures is positively associated with the logged measure of the percentage of Black residents. It is also positively associated with the percentage of poor residents in a jurisdiction, violent crime, and jurisdiction revenue. It is negatively associated with the percentage of residents who own their home and the number of drug arrests. There is no evidence of a relationship between the number of forfeitures and a logged measure of the percentage of Latinx residents. The other variables we examined—the Blau index, the percentage of residents who are foreign born, and the percentage who are males aged eighteen to twenty-four—are also not significantly associated with CAF.
Poisson regression, number of asset forfeitures, and jurisdiction attributes, California, 2002–2020

Notes:
*** p < 0.001; ** p < 0.01; * p < 0.05.
+ Unstandardized coefficients, clustered standard errors in parentheses.
Our multivariable results (Table 2, column two) show that the positive, significant relationship between the number of forfeitures in a jurisdiction and a logged measure of the percentage of Black residents is robust to a diverse set of controls, including crime. There is also evidence of a significant relationship between the number of forfeitures and the percentage of foreign-born residents. This pattern was not evident at the bivariate level. Consistent with the bivariate results, CAF is significantly and positively associated with the percentage of residents born outside the United States, violent crime, and revenue and is negatively related to the number of drug arrests.
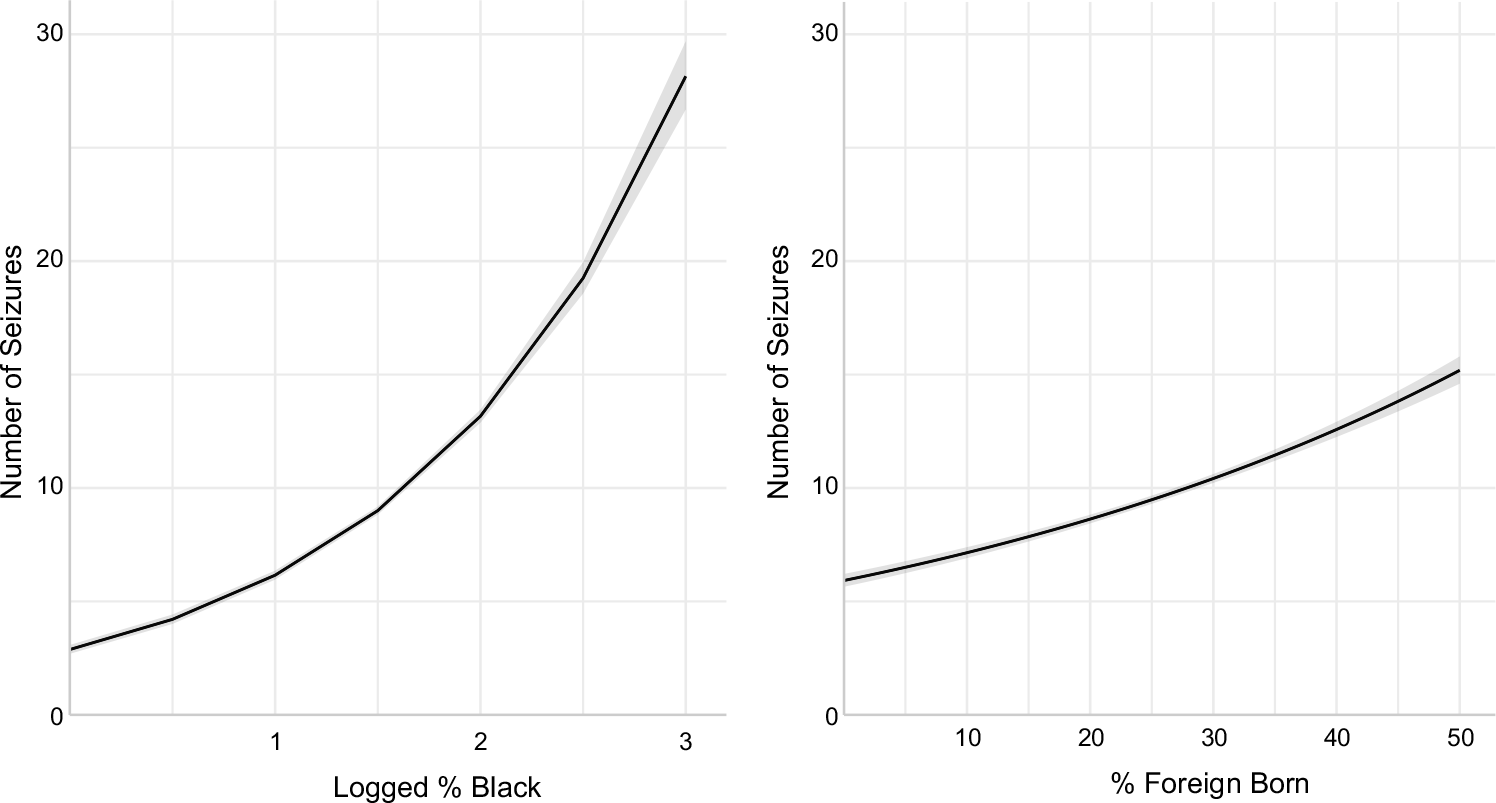
We used marginal effects to plot the relationships between the number of CAF seizures and the logged percentage of Black residents and the percentage of residents who were born outside the United States (see Figure 1). These plots show the predicted values of the number of seizures (Y axis) for various values of these variables (X axis). The grey shaded area shows the 95 percent confidence interval for the predicted values. The values for variables not plotted are held constant at their means.
Marginal effects according to number of seizures.

The marginal effects put into sharp relief the associations we described earlier. A jurisdiction where the logged percentage of the population that identified as Black was zero would expect 6.16 forfeitures, increasing to 28.15 when the logged percentage of Black residents reaches two. A jurisdiction in which everyone was born in the United States could expect 5.92 forfeitures, whereas a jurisdiction where 20 percent of the population was foreign born could expect 8.63. Our final analysis examined the possibility that the number of CAF seizures was jointly influenced by the percentage of Black and poor residents in a jurisdiction. There is no evidence of this positive interaction effect in our data. Instead, the coefficient for this interaction (b = – 0.00; se = 0.00; p < 0.05) indicates a shallower slope between the number of seizures and the percentage of Black residents as the percentage of poor residents increases.
DISCUSSION
At is inception, politicians championed CAF as a tool that law enforcement would use to seize the ill-gotten gains of organized criminals. But, as John Hagan makes clear in Who Are the Criminals?, political claims about crime and criminal justice policy are often a framing device grounded in political ideology and interests rather than in reality. President Reagan, and other advocates for CAF, argued that law enforcement would use CAF to punish drug czars who profited from their ill-gotten gains. Given this framing, President Reagan could easily ask the rhetorical question in championing CAF (and other drug policies): “Why should any right-minded person oppose it?”
Many states, including California, followed the federal government’s lead and introduced their own CAF programs. Critics have charged that, in California (as well as in other places), law enforcement has used CAF to target racial minority and poor communities (Doctoroff et al. Reference Doctoroff, Margaret Dooley-Sammuli, Lopez and Vieyra2016). In support of this claim, our analysis of nineteen years of California CAF data shows a robust association between the number of CAF seizures and a logged measure of the percentage of Black residents in a jurisdiction. This pattern is consistent with racial threat theory’s prediction that aggressive policing is associated with the perceived political and symbolic threat of Black residents; it also matches other research findings about the percentage of Black residents and the amount spent on law enforcement and the disproportionate use of various police tactics such as fines and fees and excessive force.
Our analysis also raises doubts about the claim that CAF is used primarily as a tool to address drug crime. We find that drug arrests have a significant but minuscule negative association with the number of CAF seizures. Thus, we found no evidence that drug crime explained the use of CAF. This pattern calls into question one of the primary arguments used to justify CAF. We did not find any evidence of a relationship between CAF and a logged measure of the percentage of Latinx residents in a jurisdiction. However, we did not explore other possible relationships between these variables—linear and quadratic, for example—and we did not investigate factors that may condition such relationships.
Further work needs to build on our study’s findings and address its limitations. We have focused on direct relationships, ignoring the various factors that may mediate the relationship between policing and the size of a racial minority. Other work has used surveys to assess resident concerns about crime, support for policing, and the size of a minority population. Such data would clarify the role of views about the extent of the political or symbolic threat of a racial minority and show whether a perceived threat is linked to views about crime and policing. Our model does not include measures of the attributes of law enforcement agencies or their policies, variables that are associated with other types of policing.
Our police agency data lacked clear geospatial boundaries, and the definitions of jurisdictions that we used are approximate. Analyses with better geospatial data will provide results that are more precise and should be able to address the modifiable areal unit problem. The patterns we observe at the jurisdiction level may differ at the census block or tract level. Future research should also consider different units of analysis when examining CAF. The increased availability of law enforcement records may soon make it possible to connect CAF data to unique locations allowing for community- or neighborhood-level analyses. At some point, law enforcement may also share information about the individuals from whom they seize assets.
CONCLUSION
President Reagan, and other politicians, framed the drug crisis using timeworn patterns of fear mongering and racial undertones illuminated by Hagan’s research. In the shadow of this crisis, political leaders portrayed CAF as a powerful, common-sense tool that law enforcement would use to undermine drug czars who were behind a drug crisis that they claimed was ravaging the United States. Yet, after decades of reform and adjustments, the application of CAF seems similar to the use of other aggressive law enforcement tactics; it is used more often in communities with large populations of Black residents, relative to the dominant White population. While policies spawned from the “war on drugs” have come under increasing scrutiny in recent history, CAF is only starting to be examined in detail. This study makes clear that CAF is not the “common-sense” tool politicians portrayed it to be. Its application is, at best, measurably unequal and at worst weaponized to harass vulnerable populations, especially those who live in communities in which many residents identify as Black.