


Since 1970, housing prices in the top quintile of the price distribution have dramatically increased, with real prices doubling in New York City and Los Angeles while nearly tripling in San Francisco (Glaeser and Gyourko Reference Glaeser and Gyourko2018; Glaeser, Gyourko, and Saks Reference Glaeser, Gyourko and Saks2005a). Driving this appreciation is an inability of the supply of new homes to keep up with demand, causing the price of existing homes and apartments to rise. Even accounting for the cost of materials (Glaeser and Gyourko Reference Glaeser and Gyourko2018; Glaeser, Gyourko, and Saks Reference Glaeser, Gyourko and Saks2005b; Gyourko and Saiz Reference Gyourko and Saiz2006) and geographic constraints (Saiz Reference Saiz2010), the dominant factor behind the decoupling of supply from demand is policy regulation, from limits on the density of new homes to caps on the number of permits issued (Glaeser and Ward Reference Glaeser and Ward2009; Ihlanfeldt Reference Ihlanfeldt2007; Mayer and Somerville Reference Mayer and Somerville2000; Quigley and Raphael Reference Quigley and Raphael2005). Historically, these restrictions have been limited to majority-homeowner suburbs where most residents favor the rising prices (Danielson Reference Danielson1976; Fischel Reference Fischel2001; Frieden Reference Frieden1979). However, the restrictions have now expanded to majority-renter central cities, where high prices threaten the well-being of not only most residents, but the nation’s economy as a whole.
Why has housing become so hard to build in these traditionally development-friendly cities? And do these restrictions reflect majoritarian preferences? On one hand, residents may not want more housing in their city, meaning the supply restrictions are in line with majoritarian preferences. On the other hand, residents may support more housing, so long as that housing is not built in their own neighborhood. This “Not In My Back Yard” (NIMBY) opposition (Dear Reference Dear1992; Schively Reference Schively2007) creates a collective action problem for the housing supply. Despite supporting supply citywide, residents individually have an incentive to “defect” and block new housing proposed for their own neighborhood. If the permitting process allows individual residents to defect from a group interest of more supply, then NIMBYism will not only lead to less new housing overall, but to a level of supply below majoritarian preferences. This ability of NIMBYism to undermine collective action extends beyond housing to an array of land uses, from clean energy facilities (Stokes Reference Stokes2016) and landfills (Lake Reference Lake1996) to homeless shelters and social service centers (Dear Reference Dear1992). So long as the costs are spatially concentrated, even broadly supported land uses will face NIMBY opposition.
For housing, the effects of NIMBYism on supply and prices are meaningful for not only those living within these cities and but also those priced out. Today, one in four renters spends more than half of their income on housing, with growing rents expected to outpace income over the next ten years (Charette et al. Reference Charette, Herbert, Jakabovics, Marya and McCue2015). For renters, rising prices lead to instability, including the looming financial, physical, and emotional distress of eviction (Desmond Reference Desmond2016). Meanwhile, the benefits of higher prices accrue disproportionately to the affluent, driving the nation’s widening wealth inequality (Rognlie Reference Rognlie2015).Footnote 1 Beyond residents paying burdensome rents, those priced out of these cities are denied opportunity: higher rates of skill acquisition (Glaeser and Maré Reference Glaeser and Maré2001; Rosenthal and Strange Reference Rosenthal and Strange2008), longer life expectancies (Chetty, Stepner, and Abraham Reference Chetty, Stepner and Abraham2016; Singh and Siahpush Reference Singh and Siahpush2014), and greater levels of intergenerational upward mobility (Chetty et al. Reference Chetty, Hendren, Kline and Saez2014; Chetty and Hendren Reference Chetty and Hendren2015) compared to more affordable alternatives. As evidence of this pricing out, low-wage workers are for the first time no longer migrating to high-wage cities—a breakdown causally attributed to stricter land use regulations (Ganong and Shoag Reference Ganong and Shoag2017).
These individual effects reverberate to national consequences. With only high-income workers able to afford the cost of living, incomes across states are no longer converging, entrenching regional inequality (Ganong and Shoag Reference Ganong and Shoag2017). More so, this decrease in labor mobility slows national economic growth. Hsieh and Moretti (Reference Hsieh and Moretti2017) argue that restrictions on new supply decreased U.S. economic growth by more than 50% from 1964 to 2009, whereas lowering restrictions in just New York, San Francisco, and San Jose to those of the median city would raise GDP by 9%. The slowdown’s symptoms can be seen in individual cities as well. By limiting the density of new housing, supply regulations threaten local economic productivity (Ciccone and Hall Reference Ciccone and Hall1996; Glaeser and Maré Reference Glaeser and Maré2001) and innovation (Rauch Reference Rauch1993; Carlino, Chatterjee, and Hunt Reference Carlino, Chatterjee and Hunt2007). Finally, when cities cannot grow up, they grow out, consuming ecosystems and increasing greenhouse gas emissions per capita (Glaeser and Kahn Reference Glaeser and Kahn2010; Jones and Kammen Reference Jones and Kammen2014). These effects are pervasive, and they are path dependent. Once these development patterns are set, they tend to be enduring.
Given these consequences, why have housing restrictions leapt from homeowner-dominated suburbs to majority-renter central cities? Much of what we know about housing and NIMBYism explains suburban homeowner behavior but fails to describe the current affordability crisis. Unlike homeowners, there has been little research on the attitudes and political behavior of renters who compose the majority of these cities’ electorates.Footnote 2 Furthermore, despite media attention, there are neither experimental evaluations nor individual-level empirical measurements of NIMBYism toward housing. To address these challenges, I conducted two surveys. To capture voting behavior and attitudes, I leveraged the 2015 San Francisco municipal election, where the ballot contained four measures directly related to the housing supply and prices. By sampling voters as they exited polling locations, my survey of 1,660 respondents captured the opinions of politically active voters after a months-long campaign with housing as a primary issue. To assess the generalizability of these findings, I conducted a national survey of over 3,000 respondents from 655 municipalities. The national survey consisted of housing policy proposals and a conjoint experiment to test policy preferences. Together, these surveys provide not only widely generalizable data on the attitudes of homeowners and renters, but the first experimental measurements of NIMBYism toward housing.Footnote 3
From these data, I find that while homeowners exhibit a constant level of NIMBYism across all housing markets, renters do not. Instead, renters on average express high support for new housing citywide and no sensitivity to the nearness of new development. However, in cities where housing prices are high, renters display NIMBYism toward market-rate housing at a level on par with homeowners. This renter NIMBYism is strongly correlated with concerns over high housing prices, suggesting that renters feel economically threatened by new nearby developments. Nevertheless, NIMBY renters still support large increases in their city’s housing supply. Simply put, these renters support new housing, but not in their own neighborhood. Because these preferences vary between the neighborhood scale and the city scale, how city institutions approve new housing is likely to affect how much housing gets built. If NIMBY residents are able to selectively block nearby developments, less housing is likely to be approved overall than if the same residents voted on supply citywide. When policy preferences vary by spatial scale, the scale of decision-making matters.
NIMBYism
From siting energy facilities to homeless shelters, the politics of any land use operate within a geographic domain. For housing, that domain is the municipality, which exercises the greatest control over the amount, location, and aesthetic of housing permitted. Within that land use’s domain, its costs and benefits vary by spatial scale. Some effects are felt in direct proportion to their proximity. For example, the noise, congestion, and aesthetic change that comes with new housing is felt most intensely by those living nearby. Because these externalities affect only a subset of the domain’s population, they operate at the microscale. In contrast, other effects are felt uniformly across the domain. For housing, an increased tax burden generated by the new units is shared among all residents of the municipality regardless of how close they live to the new development. These uniform externalities operate at the macroscale, encompassing the entire domain.Footnote 4
Because costs and benefits vary across scales, so do voter preferences. When the costs of land use are more spatially concentrated than the benefits, those living closer to the use are more likely to oppose it than those living farther away. This shift from support or indifference toward the use at the macroscale to opposition at the microscale is known as NIMBYism for “Not In My Back Yard.” Originally coined for the protest of landfills, trash incinerators, and power plants (Dear Reference Dear1992; Fischer Reference Fischer1993; Schively Reference Schively2007), the term has expanded in scope to almost any land use opposed by local residents, including new housing development. Regardless of its application, NIMBYism describes macroscale support that does not carry over to the microscale, meaning the preferences are scale-dependent.Footnote 5
When preferences are scale dependent, how decisions are made can lead the same voters to different policy outcomes. Think of two cities with identical residents. These residents support new housing citywide, but oppose it in their own neighborhood. In City A, decisions about housing are made at the city level (macroscale) through a majority vote, similar to a ballot initiative. In City B, housing decisions are made neighborhood by neighborhood (microscale), with each neighborhood able to reject or accept new housing. In City A, if the majority of residents support an increase in the housing supply, that increase will occur, keeping supply in tandem with majoritarian preferences. In City B, however, each individual neighborhood is given the opportunity to defect and reject new housing proposed for their neighborhood. Given NIMBY opposition to housing nearby, the amount of new housing permitted in City B will fall short of majoritarian preferences for housing citywide. Together, NIMBYism combined with institutional design makes housing harder to build in City B than in City A.Footnote 6
This stylized example is grounded in institutional shifts that have occurred over the past 40 years. Following the slum clearance, urban renewal, and highway development of the mid-twentieth century, citizen groups began clamoring for a larger say in city planning (Angotti Reference Angotti2008; Rohe and Gates Reference Rohe and Gates1985; Stone et al. Reference Stone, Stoker, Betancur, Clarke, Dantico, Horak, Mossberger, Musso, Sellers, Shiau, Wolman and Worgs2015). This mobilization matched a larger wave of federal efforts to enhance citizen participation, beginning with Lyndon Johnson’s Community Action Program which put the local level at the forefront of the war on poverty (Berry, Portnoy, and Thomson Reference Berry, Portnoy and Thomson1993). Specifically for urban development, the Model Cities Program of 1966 began the requirement of citizen participation in the planning process to receive federal funding. In 1974, the Community Development Block Grant program codified this neighborhood voice, mandating that cities “provide residents of the community with adequate opportunity to participate in the planning, implementation and assessment of the program” (Rohe and Gates Reference Rohe and Gates1985). While initially considered superficial and weak (Berry, Portnoy, and Thomson Reference Berry, Portnoy and Thomson1993), these mandates foreshadowed today’s citizen review processes and neighborhood planning boards, institutions designed to empower local residents to express opinions and negotiate with developers over nearby proposals.Footnote 7
NIMBYism and shifts of power to the microscale help explain why housing has become increasingly difficult to build in many cities. But testing the NIMBY mechanism starts with identifying who holds scale-dependent preferences. Doing so would advance our understanding of local political economy where the housing supply has been largely viewed as either outside the influence of voters (Peterson Reference Peterson1981; Tiebout Reference Tiebout1956), at the behest of suburban homeowners (Fischel Reference Fischel2001), or dictated by growth-centric elites (Logan and Molotch Reference Logan and Molotch1987). Missing is an understanding of how spatial scale affects support for public policy.Footnote 8
Macroscale
At the macroscale, new housing has a negative effect on prices.Footnote 9 By moderating prices, new supply provides lower rents for renters and more affordable opportunities for first-time home buyers. New housing may also benefit current residents via economic growth, wherein local business owners gain customers and cheaper labor through a more affordable cost of living.
But while pleasing to renters, lower housing prices tend to trouble homeowners. Not only is the home typically one’s largest asset, but it has been increasingly viewed as an investment vehicle for wealth creation (Fischel Reference Fischel2016). Consequently, lower prices threaten the long-term expectation that one’s home value will increase above the rate of inflation. As another threat to home values, the new residents that follow development tend to be less wealthy than current residents, meaning they are likely to consume more in city services than they generate in tax revenue (Peterson Reference Peterson1981; Tiebout Reference Tiebout1956). This combination leads to both higher taxes and lower home values for current residents. Though all residents suffer if new development strains public goods, homeowners pay doubly as this decrease in quality of life is capitalized into lower home values (Oates Reference Oates1969), whereas renters at least benefit from a lower cost of living.
Microscale
Along with the macroscale, new supply may also lower prices at the microscale through localized externalities. Nearby development causes physical disruptions, blocking natural light and views. With new housing comes new residents, meaning more noise, congestion, and competition for nearby public goods, such as parking spaces and local parks.Footnote 10 This decrease in quality of life is capitalized into lower home values for units nearby. Finally, residents may be concerned about the demographics of the new arrivals themselves. Housing that is more affordable than the current stock will attract less wealthy and likely more racially diverse residents. Concerns about “outsiders” unfamiliar with neighborhood norms may stem from either direct racism or a belief that diversity itself will lower property values (Danielson Reference Danielson1976).
But local externalities do not always depress property values. Occasionally, new housing is believed to “upgrade” a neighborhood. To many, investment by a developer sends a positive signal about a depressed neighborhood’s economic trajectory. New apartments may replace existing blight, such as an empty lot or vacant building, improving nearby home values and encouraging neighboring property owners to renovate their untis (Autor, Palmer, and Pathak Reference Autor, Palmer and Pathak2014). At the same time, this positive effect on prices has been framed as harmful to renters, with new developments and renovations accused of spurring the economic and cultural gentrification of a neighborhood (Angotti Reference Angotti2008; Betancur Reference Betancur2002; Hackworth and Smith Reference Hackworth and Smith2001). Because of this supply-induced gentrification, an individual may simultaneously believe that new housing lowers prices citywide, but that any specific development would increase nearby prices.
Homeowners and Renters
To map these macro- and microscale effects onto politics, residents can be divided into homeowners and renters due to the two groups’ fundamentally opposing attitudes. Homeowners typically want housing prices to increase whereas renters want prices to decrease. On the macroscale, homeowners tend to oppose new housing citywide, given the new supply threatens their home value through supply-and-demand market forces while also potentially increasing their tax burden. On the microscale, homeowners again typically oppose new development. Not only is the home their largest asset, but it is geographically fixed and difficult to sell quickly. These constraints make homeowners exceptionally risk averse to nearby change, instead preferring the status quo (Fischel Reference Fischel2001).
In contrast, renters seek lower housing prices, leading them to largely support new housing at the macroscale.Footnote 11 While renters’ macroscale support is straightforward, support at the microscale is theoretically less clear. On one hand, if new housing lowers neighborhood prices as feared by homeowners, renters will benefit. On the other hand, if the lower rents come at the expense of quality of life, renters may oppose the new supply. Finally, if renters believe that new housing will gentrify their neighborhood, attracting new residents and increasing demand, they may oppose the development out of fear of increasing local rents. Because of these conflicting signals, predictions of renter opposition at the microscale have weak priors (see Table 1).
Expected Support for New Housing Development by Spatial Scale (Macroscale v. Microscale).

While policy attitudes form through many pathways, housing has several traits that may cause voters to weigh support in terms of self-interest (Sears and Funk Reference Sears and Funk1990).Footnote 12 As a policy, new housing is tangible and visible, making it easy to connect to personal well-being. As discussed above, new housing’s consequences are potentially severe, affecting a homeowner’s largest asset and the renter’s largest expense. Moreover, the severity of the threat is heightened by its ambiguity. Current residents know neither who will move into the new units nor exactly how the changes will alter their daily lives. This uncertainty creates a knowledge vacuum easily filled by imagined threats and rumors. Combined with the lack of partisan politicizing around individual developments, attitudes toward housing often come down to how it affects one individually.Footnote 13 Specifically, I argue that housing attitudes are primarily driven by economic self-interest, with homeowners protecting their home values and renters seeking lower housing costs. Beyond self-interest, competing explanations include larger concerns about quality of life or a preservation of the status quo. I detail how these theories compare against the paper’s findings in the Discussion.
This homeowner-renter typology sufficiently explains why housing is so hard to build in homeowner-dominated suburbs. Not only are homeowners the majority of suburban voters, but they tend to be socioeconomically homogeneous and geographically stationary, facilitating mobilization (DiPasquale and Glaeser Reference DiPasquale and Glaeser1999; McCabe Reference McCabe2016; Oliver and Ha Reference Oliver and Ha2007). Likewise, the limited scope of suburban policy leads politics to largely revolve around protecting home values (Fischel Reference Fischel2001; Nguyen-Hoang and Yinger Reference Nguyen-Hoang and Yinger2011). Where these existing theories do not translate is to majority-renter central cities where the housing supply has grown increasingly inelastic. In cities like San Francisco and New York, not only do homeowners make up fewer than one-third of the population, but they do not enjoy the same benefits of homogeneity and “home-value focused” politics as their suburban counterparts. Still, cities once viewed as growth-focused (Logan and Molotch Reference Logan and Molotch1987; Peterson Reference Peterson1981; Stone Reference Stone1989) have seen a slowdown of housing construction despite rising demand.Footnote 14 Though variation in new supply within New York City has been linked to the homeownership rate of individual neighborhoods (Been, Madar, and McDonnell Reference Been, Madar and McDonnell2014), why housing has grown increasingly difficult to build in majority-renter cities is poorly explained by current political economy theory. The following surveys unpack the attitudes behind this unexplained trend, a first step to understanding the larger behaviors behind NIMBYism.
CITY-SPECIFIC TEST
To understand why majority-renter cities have increasingly restricted their housing supply, I surveyed 1,660 voters during the San Francisco municipal election in November 2015. The exit poll provided a rare opportunity to capture attitudes and behaviors toward housing among voters. First, respondents voiced their opinions on actual policies with real consequences if passed. Second, these policies were debated over several months of campaigning, allowing respondents to form considered opinions rather than “top of the head” responses (Zaller Reference Zaller1992). Third, many argued that housing was the dominant issue of the election (Brooks and Pickoff-White Reference Brooks and Pickoff-White2015; Diaz Reference Diaz2015; Green Reference Green2015),Footnote 15 leading the voting population to be particularly aware, informed, and interested in the survey topic. This awareness coupled with the time and resources spent voting in an off-cycle election suggest that the sampled population was similar to those willing to attend a planning meeting or influence housing policy outside of the voting booth, heightening the findings’ external validity in nonballot cities. Finally, though San Francisco is not the average American city, this survey was designed to unpack housing attitudes within other highly regulated urban cores, such as Los Angeles and New York City. The left-lean of these other inelastic cities improves the generalizability of the San Francisco results.Footnote 16
On Election Day, 65 pollsters were stationed outside of 26 polling locations. Over 45% of voters approached agreed to complete the survey, totaling 1,660 surveys. Respondents were asked their vote choice on four of the ballot propositions as well if they would support a 10% increase in the city’s housing supply.Footnote 17 The purpose of this survey was not to estimate the exact share of San Francisco voters supporting each policy, but rather to see how attitudes toward housing shift across demographic covariates.Footnote 18
To measure support for new housing citywide (macroscale), I asked respondents if they would vote in favor of a 10% increase in the city’s housing supply:
“If there were a proposition to build 10% more housing in San Francisco, how would you vote on that proposition?”
Among the sampled voters, 73% of homeowners and 84% of renters supported a 10% increase in the city’s housing supply. Not only are both shares exceptionally large, but the effect of homeownership was not statistically significant when controlling for demographics (Appendix Table A.3).
To measure support in one’s own neighborhood (microscale), I leveraged Proposition I, which proposed to halt the development of new housing in the gentrifying Mission District for at least 18 months (Budget and Leglislative Analyst's Office 2015).Footnote 19 Under this proposition, new housing would only be permitted if it consisted of fewer than six units or were composed entirely of units set aside for low- and middle-income residents. For proposition supporters, these requirements would slow gentrification by securing remaining land for affordable housing. To opponents, the proposition would only accelerate price appreciation by cutting off new supply. I leveraged this proposal to measure support for housing at the microscale by offering respondents the opportunity to pass a similar ban in their own neighborhood:
“If a similar ban were proposed for your neighborhood, how would you vote?”Footnote 20
Given the literature on NIMBYism, homeowners should seize this free opportunity to block new housing in their own neighborhood (Fischel Reference Fischel2001). Thus, I not only expected a high level of support among homeowners, but that homeowners would show a far greater level of support than renters. Instead, only 40% of homeowners chose to support a neighborhood ban compared to 62% of renters. Put differently, 30% more renters supported the neighborhood ban than homeowners. This gap between homeowners and renters holds to nine points when controlling for demographics including income, ethnicity, and ideology (Appendix Table A.3). Even dividing respondents by their support for the 10% increase in supply citywide, 37% of “pro-supply” homeowners supported the NIMBY ban compared to 52% of pro-supply renters, a gap that also holds with demographic controls (Figure 1).
Support for a Neighborhood Ban on New Development by Support for a 10% Increase in the City’s Housing Supply

These results are surprising and highly counterintuitive. Not only does neighborhood opposition among renters outpace that of supposedly NIMBY homeowners, but the same renters show greater support for new housing citywide. Why does renter opinion differ so dramatically when asking about the macroscale versus microscale? One reason may be a fear of supply-induced gentrification, a spatial threat of nearby individual developments. Imagine you are a renter in a city with high housing prices, living in one of the few remaining affordable neighborhoods. On your street, a new market-rate condominium is proposed. Generally, you believe that new supply helps to mitigate rising prices. However, this one condominium would be a minuscule addition to the overall supply, making it unlikely to appreciably lower prices citywide. Instead, the new building is more likely to signal to other developers that your neighborhood is an undervalued investment. Your landlord may see the new building and consider selling or renovating her own, leading to higher rents or even eviction. In short, the long-run benefit of more supply is eclipsed by the immediate, short-run threat of displacement.
While the level of renter NIMBYism was the most striking finding, both homeowners and renters in the exit poll showed scale-dependent preferences. For these voters, housing presents a collective action problem: broad support exists for housing citywide, but new development is unpopular in the respondent’s own neighborhood. Accordingly, San Francisco’s permitting process may yield contrasting levels of support for new housing depending on scale of decision-making. Still, the exit poll results are limited to one city. Testing these theories requires a more diverse sampling frame, as well as experimental methods to directly measure the effect of spatial proximity. Likewise, a second survey would show whether the exit poll findings replicate across samples.
NATIONAL SURVEY
To test these theories across diverse environments, I conducted a 3,019-respondent national survey of attitudes, capturing residents of 655 municipalities across 47 states.Footnote 21 Administered by the online data collection firm GfK, this national survey sampled respondents from 4,068 ZIP codes in which the local government both has clear control over housing policy and no other local governments are nested within.Footnote 22 From these ZIP codes, respondents received a survey composed of a conjoint experiment and policy proposal similar to that found in the San Francisco exit poll. The order of these items was randomized.Footnote 23
A form of survey experiment, a choice-based conjoint experiment, is a series of tasks where respondents are presented with two options and asked which of the two they prefer (Hainmueller, Hopkins, and Yamamoto Reference Hainmueller, Hopkins and Yamamoto2014). For this survey, the two options presented were hypothetical housing developments proposed for the respondent’s city/town. Each development was described by a set of seven attributes, such as the building’s height and number of units. While the same attributes were included in all proposals, the attribute levels were randomly drawn from a set of potential levels. For instance, the height of each proposed building randomly varied between two and twelve stories (see Figure 2 for an example of the conjoint task).
Example of the Conjoint Task

For this conjoint, seven attributes were chosen to provide information that residents often use to decide whether they support a proposed development.Footnote 24 For example, to measure support for affordable housing, the share of units set aside as affordable to low-income residents varied between 0% and 100%. NIMBYism was tested by varying the distance from the proposal to the respondent’s home. Other attributes included community support, the current site conditions, and whether the tenants would be homeowners or renters. Table 2 contains the complete list of attributes and attribute levels used in the experiment.Footnote 25
Attributes and Levels

By having respondents choose between two randomly generated buildings, I can estimate the effect of changing a specific building attribute on the support a building would receive. To capture variation across demographic groups, I subset the sample by respondent characteristics, such as homeownership status. Together, the conjoint design’s bundling of treatments not only allows for the experimental testing of multiple hypotheses, but also reduces social desirability bias by providing many potential reasons for supporting or opposing a proposed development.Footnote 26
Along with the conjoint experiment, respondents answered questions pertaining to a 10% increase in their city/town’s housing supply. For concreteness, I used each respondent’s ZIP code to pipe in their municipality’s name, the number of existing housing units in their city/town, and the number of new units that would be permitted with a 10% increase in supply.Footnote 27 Respondents were asked their support for this citywide supply increase on a seven-point scale from “strongly oppose” to “strongly support.” To measure support for a neighborhood ban on development, respondents were also asked:
“Would you support a ban on the construction of new housing (homes and apartments) in your neighborhood?”
Again, support was measured on a seven-point scale from “strongly oppose” to “strongly support.”
NATIONAL RESULTS
NIMBYism
Starting with the macroscale, renters are expected to be more supportive of increases in the citywide housing supply than homeowners. To resemble a ballot initiative similar to the exit poll, I convert the seven-point scale to a binary variable of support.Footnote 28 Within the national survey, homeowners show a 31 percentage-point decrease in support for new supply compared to renters, with 28% of homeowners supporting the citywide policy compared to 59% of renters. This effect holds to a 21-point difference with the inclusion of demographic controls and municipal fixed effects (Appendix Table B.2).
Shifting to the microscale, homeowners are expected to exhibit NIMBYism whereas renter attitudes are unclear. To measure NIMBYism, I use the conjoint’s spatial proximity attribute: “How far is the building from your home?” Because of the stigma associated with affordable housing (Danielson Reference Danielson1976; Tighe Reference Tighe2010), I separate buildings containing some share of affordable housing (“affordable”) from those without any units set aside for low-income residents (“market rate”).Footnote 29
Figure 3 shows the effect of proximity on support for these two types of buildings among homeowners. Each attribute level’s effect can be thought of as the change in support for a building compared to the baseline level. For proximity, the baseline of two miles away is presented at the top of the chart with a point estimate of zero.Footnote 30 Moving down, the point estimates and 95% confidence intervals show the effect of each attribute level compared to this baseline.Footnote 31
Effect of Proximity on Homeowners by Affordability of Proposed Housing

For homeowners sampled, moving a building from two miles away to one mile away decreases support by a few percentage points for affordable housing, but the change is not statistically significant at α = .05. However, moving from two miles away to a half mile away lowers support by approximately five points for both types of housing and is statistically significant. The largest effect is found at an eighth of a mile away, where market-rate housing experiences an eight-point drop in support while affordable housing has a twelve-point drop in support, all else equal.Footnote 32 This spatial sensitivity to development matches homeowners’ NIMBY reputation and remains consistently around ten points across demographic groups, including income (Appendix Figure C.1) and ideology (Appendix Figure C.2).
But while homeowner NIMBYism is well theorized, renter NIMBYism is not. Despite the surprising exit poll results, Figure 4 shows that renters do not in aggregate exhibit NIMBYism toward new housing. If anything, renters show a positive YIMBY (“Yes In My Backyard”) attitude toward affordable housing, with support increasing the closer the building is to their home. Supporting this microscale gap between homeowners and renters is the more blunt NIMBY measure of banning new development in the respondent’s neighborhood:
Effect of Proximity on Renters by Affordability of Proposed Housing

“Would you support a ban on the construction of new housing (homes and apartments) in your neighborhood?”
Unsurprisingly, homeowners show greater support for this NIMBY ban than renters, with 42% of homeowners supporting the ban compared to 35% of renters, a gap that holds when controlling for demographics (Appendix Table B.4 and Table B.5).
NIMBYism across Markets
But if renters in aggregate are not sensitive to spatial proximity, why were the renters in San Francisco more NIMBY than homeowners? Missing from these national results is the effect of context, where the respondent lives, and their housing market. San Francisco’s NIMBYism may be limited to similarly high-rent cities where renters are anxious about prices and displacement. Of course, a respondent’s context can be defined by either the macro- or microscale. On one hand, ZIP code as context provides an estimate of the renter’s immediate neighborhood. On the other hand, a renter in an expensive ZIP code likely has more affordable options should she become priced out of her current neighborhood. In contrast, a renter in an expensive city will likely have fewer affordable alternatives to choose from, heightening the threat of displacement. Thus, while the ZIP code provides precision, the city as context better captures the gentrification threat behind renter NIMBYism.Footnote 33
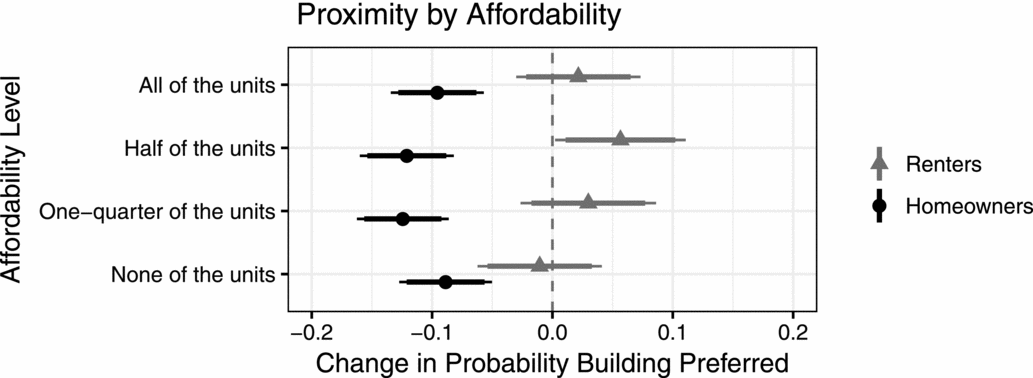
To gauge the role of context, I group renters into quintiles using June 2016 Zillow estimates for average rent citywide, allowing me to identify housing markets that resemble San Francisco.Footnote 34 Figure 5 shows NIMBYism by isolating the change in support from two miles away to an eighth of a mile away for each quintile of citywide rent. For affordable housing, renters do not exhibit NIMBYism in any quintile. But for market-rate housing, renters in the top quintile display NIMBYism (twelve-point decrease in support) on par with that of homeowners (ten-point decrease in support). This renter NIMBYism also exists when grouping renters by ZIP code average rent (Appendix Figure C.5) as well as when examining each level of affordability separately rather than compressed into affordable and market-rate categories (Appendix Figure C.4). In comparison, homeowner NIMBYism does not vary across quintiles (see Appendix Figure C.6), demonstrating the unique relationship between renters and their housing market at the microscale.
Effect of Proximity on Renters by Affordability of Proposed Housing, Grouped by Average Rent Citywide. Displayed Effect is Shift from Two Miles Away (Baseline) to an Eighth of a Mile Away. Quintile Cutpoints for Average Rent by City at $1,217, $1,480, $1,936, and $2,247

This renter NIMBYism is meaningful not just because of its size or systematic nature, but because renters in expensive cities do not show a decrease in support for new housing at the macroscale. Returning to the proposal for a 10% increase in supply, renter support does not decrease in more expensive cities compared to more affordable ones (Figure 6).Footnote 35 In other words, while renters in high-rent cities still support new housing at the macroscale, they resemble homeowners when facing market-rate housing at the microscale.
Renter Support for a 10% Increase in Their City/Town’s Housing Supply, by Average Rent Citywide

To test my mechanism, I gauge the role of gentrification in NIMBYism by asking respondents about their perspective on citywide housing prices.
“Think about the best interest of [CITY/TOWN]. Would it be best for average housing prices in [CITY/TOWN] to increase, decrease, or stay the same over the next five years? Assume that [CITY/TOWN]’s economy would stay the same.”Footnote 36
From a seven-point scale of responses, I categorize renters supporting lower prices as “price anxious,” while those supporting stable or higher prices as “price neutral.” Figure 7 shows that NIMBYism toward market-rate housing is prominent among price-anxious renters but not present among price-neutral renters. The same divergence does not occur when comparing these groups’ preferences for affordable housing (Appendix Figure C.7). This link between NIMBYism and price anxiety supports the theory that renters in expensive cities view new market-rate housing as a gentrification threat. More so, if nonfinancial factors like traffic, noise, and competition for parking spaces were the primary concerns among these renters, NIMBYism would not vary between affordable and market-rate housing as the conjoint controls for all other development attributes. Instead, renter NIMBYism is directly targeted toward market-rate housing and is strongly correlated with anxiety over housing prices.
Effect of Proximity on Renters Toward Market-Rate Housing by Attitude Toward Housing Prices Citywide

Outside of the conjoint experiment, the survey also proposed a blanket ban on all development in the respondent’s neighborhood. Support for this ban does not significantly vary with market context. For homeowners, this lack of variation matches the conjoint’s stable level of NIMBYism. For renters, the lack of variation may stem from their general support for new housing, including mixes of market-rate and affordable units in the same proposal. Instead, renter NIMBYism appears exclusively reserved for market-rate housing.
DISCUSSION
I have presented the first empirical measurements of housing NIMBYism at the individual levelFootnote 37 and the first experimental tests of NIMBYism by varying the spatial proximity of the land use, all else equal.Footnote 38 By comparing support for housing citywide to opposition in one’s own neighborhood, I have shown how spatial scale directly affects policy support. Specifically, renters in high-rent cities support housing in aggregate but exhibit NIMBYism on par with homeowners when facing market-rate housing in their own neighborhood. These scale-dependent preferences are reserved for market-rate housing, not affordable housing, and are correlated with anxiety over housing prices, signaling that renters are responding to the spatial threat of gentrification.
While I have framed NIMBYism in terms of economic self-interest, there are competing explanations. For instance, respondents may oppose nearby housing to limit noise, congestion, and other neighborhood changes that would harm their quality of life.Footnote 39 Unfortunately for the study of homeowners, quality of life factors are reflected in a home’s value. Consequently, these results cannot separate the influence of preserving quality of life from protecting one’s home value in homeowner NIMBYism. However, for renters, the NIMBYism observed can be attributed directly to economic self-interest for two reasons. First, were renters concerned exclusively about quality of life, I would expect to observe NIMBYism toward both market-rate and affordable housing, all else equal. However, because the conjoint experiment measures the effect of price across all other traits, the experiment shows that renters only express NIMBYism toward market-rate housing, not units with affordable housing, which would have the same noise, congestion, and quality of life effects as the market-rate housing. Second, within the entire conjoint sample, renter NIMBYism is strongly correlated with price anxiety, the belief that it would be best for housing prices to decrease citywide. This relationship matches the mechanism of gentrification fears discussed above. Were renters responding to quality of life concerns, I would not expect a relationship between NIMBYism and housing price concerns nor one that responds only to market-rate housing.
One question that emerges from these findings is why would homeowners in high-rent cities oppose housing that renters think may increase nearby housing costs? This tension comes from both groups’ risk aversion. Any new development presents a downside risk. For homeowners, that is the risk of lost equity, for renters in high-rent cities it is the risk of displacement. Given the behavioral tendency to overemphasize losses compared to gains (Kahneman and Tversky Reference Kahneman and Tversky1979), homeowners are unlikely to accept this downside risk, especially in an environment where the status quo is already rewarding. While counterintuitive, Fischel (Reference Fischel2001) describes homeowner risk aversion as a focus not on the expected effect of the development, but on the variance.Footnote 40 My theory extends this risk aversion from suburban homeowners to not only all homeowners, but to renters in high-rent cities. This risk aversion leads renters to support housing at the macroscale, but to oppose it at the microscale due to the threat of gentrification.
Be it homeowners or renters, these scale-dependent preferences matter because of the decision-making process. When institutions shift power from the macroscale to the microscale, they empower NIMBY opposition. Neighborhood planning boards provide a forum where local opponents with much to lose from each project often outnumber citywide supporters with little to gain from any one development. Even if most residents support new supply citywide, the ability to oppose specific developments grows when microscale institutions do not have a macroscale counterweight. These shifts of influence to the microscale risk the “local trap,” where increases in microscale democracy ignore their macroscale consequences (Purcell Reference Purcell2006). Similar consequences exist at the metropolitan level, where the decisions of any one municipality to block new housing spillover to the next, driving a regulatory race throughout the region (Brueckner Reference Brueckner1995, Reference Brueckner1998). Be it the neighborhood within the city or the municipality within the metropolitan area, scale-dependent preferences plus microscale institutions foster collective action problems. Although this paper is limited to observing NIMBYism at one point in time, future research should work to capture longitudinal variation in NIMBYism. In theory, as more cities experience rising prices, renter NIMBYism may spread, causing a policy feedback further constraining supply.Footnote 41 Likewise, for the institutional mechanism, future work should test the effects of shifting decision-making from the macro- to the microscale on permitting over time.
But if support for new housing exists citywide, why are existing citywide institutions like the city council unable to build a coalition for new housing? Be it a lack of strong local parties (Schleicher Reference Schleicher2013) or the localized incentives of ward-based elections (Banfield and Wilson Reference Banfield and Wilson1963; Clingermayer Reference Clingermayer1993, Reference Clingermayer1994; Schneider and Teske Reference Schneider and Teske1993), structural factors have been blamed for discouraging legislators from pursuing such citywide goals with spatially concentrated costs. In response, solutions that diminish neighborhood voice, such as a stronger centralized body or at-large elections, are politically problematic. Not only are at-large elections argued to dilute minority representation (Jones Reference Jones1976; Welch Reference Welch1990), but advocacy groups continue to use the Voting Rights Act to successfully challenge at-large systems (Childress Reference Childress2013; Fernandez Reference Fernandez2017). Coupling this momentum with the legacy of top-down urban renewal, voters are likely to see any reform limiting neighborhood voice as a step backward.
Instead, reforms could harness citywide support for new housing through ballot initiatives and citywide campaigns, expanding the scope of conflict (Schattschneider Reference Schattschneider1960). Proposals like the 10% supply increase suggest that citywide support exists, particularly among more liberal voters (see Table B.5 in the Appendix). And while NIMBYism may be appropriate in some cases, using macroscale support to set a budget of development citywide would allow the macroscale institution to weigh the costs and benefits of building in one location versus the other (Hills and Schleicher Reference Hills and Schleicher2011). But while citywide supply may succeed at the ballot, implementation would be challenging. Residents may support supply in aggregate because it is difficult to visualize compared to the individual developments used in the conjoint experiment. If true, then support for housing may evaporate as soon as individual neighborhoods and streets are selected for the new buildings. A balance may come from the macroscale institution defining of how much each neighborhood has to build. Then, a microscale institution would be given control over where their share of housing goes in their neighborhood. This plan not only limits NIMBY defection and free-riding, but also preserves neighborhood influence in how the allocation is met. Likewise, the small size and homogeneous nature of most neighborhoods would limit the power imbalances usually found in citywide debates over where new housing should be built.
Finally, space should exist to debate the merits of NIMBYism. The high stakes of local change spur political mobilization. This paper has highlighted the risks of NIMBYism to the housing supply. However, NIMBY protests were also able to spare countless neighborhoods from midcentury highway development (Altshuler and Luberoff Reference Altshuler and Luberoff2003). Indeed, some housing developments may also be inappropriate for their context. More broadly, there may be times the microscale should have veto power over a land use. Or, the microscale should be compensated by other jurisdictions that are able to free-ride. Efforts to design institutional reforms will have to address these normative aspects of NIMBYism, including historic inequality, which has led to the clustering of low-income and minority communities least able to resist locally unwanted land uses (Massey and Denton Reference Massey and Denton1993).
CONCLUSION
In response to the deepening affordability crisis, this paper measures the effect of spatial scale on policy support. Doing so, I have not only conducted the first experimental tests of housing NIMBYism, but also created a framework for thinking about the macro- and microscale of other spatially based policies, from siting energy facilities to social service centers. For housing, macroscale support does not always translate into microscale support, particularly in cities that need new housing the most. When combined with increases in microscale political power, these scale-dependent preferences set up political failure: the undersupply of a resource supported in aggregate. For policies to match majoritarian preferences, institutions should be designed to account for the spatial imbalance of costs and benefits. When preferences are scale-dependent, the scale of decision-making matters.
SUPPLEMENTARY MATERIAL
To view supplementary material for this article, please visit https://doi.org/10.1017/S0003055418000035.
Replication material can be found on Dataverse at: https://doi.org/10.7910/DVN/CRPAA8.
A SAN FRANCISCO
Rent Control
To test if rent-controlled tenants behaved differently than non-rent-controlled tenants, I recontacted 152 of the exit poll respondents from San Francisco and asked about their rent control status. Of the 118 renters, approximately half were covered by rent control. Controlling for ethnicity, income, and ideology, the closest rent control had to having a statistically significant association was on one of the four propositions, Proposition D for the Mission Rock development with a twelve-point increase in support (p = 0.12) compared to non-rent-controlled tenants. The proposition set aside 33% of the new units as affordable, and passed with 74% of the vote. For a NIMBY ban on market-rate development, rent-controlled tenants showed a ten-point decrease in support, but the estimate is very noisy (p = 0.37). For the 10% increase in the housing supply, the point estimate for rent control is near zero. In all, while rent control is likely an important component of housing attitudes broadly, there is limited evidence that rent-control-insulated renters in the exit poll from the pressures of the San Francisco housing market.
Descriptive Statistics, San Francisco Sample
Note: All tables generated using the stargazer package for R (Hlavac Reference Hlavac2018).
Descriptive Statistics, San Francisco Sample

Proposition Vote Share, San Francisco Sample

Policy Proposals, San Francisco Sample
Policy Proposals, San Francisco Sample

Recontacted Conjoint, San Francisco Sample
Effect of Proximity on Recontacted San Francisco Renters Toward Market-Rate Housing by Support for Hypothetical Ban on Market-Rate Housing in own Neighborhood

B NATIONAL SURVEY
Descriptive Statistics, National Survey
Descriptive Statistics, National Sample

10% Supply Increase, National Sample
Support for 10% Supply Increase

Support for 10% Supply Increase—Seven-Point Scale

Neighborhood Ban, National Sample
Support for Ban on Neighborhood Development

Support for Ban on Neighborhood Development—Seven-Point Scale

C CONJOINT RESULTS, NATIONAL SAMPLE
Homeowner Spatial Sensitivity by Household Income. Above Median Income > $80,000, Below Median Income ≤ $80,000

Homeowner Spatial Sensitivity by Ideology

Effect of an Eighth-Mile Away Compared to Baseline of Two Miles Away for Each Level of Affordability, by Homeownership Status
Renter Spatial Sensitivity toward all Affordability Levels, by Citywide Average Rent

Renter Spatial Sensitivity toward Affordability Levels, by ZIP Code Average Rent

Homeowner Spatial Sensitivity to all Affordability Levels, by Citywide Average Rent

Renter Spatial Sensitivity toward Affordable Housing, by Price Anxiety. Note Lack of Divergence between “Price Anxious” and “Price Neutral” Compared to Preferences toward Market-Rate Housing (Figure 7)

Policy Support by Quintile, National Sample
Renter Support for a 10% Increase in Their City/Town’s Housing Supply, Grouped into Quintiles by ZIP Code Average Rent

Homeowner Support for a 10% Increase in City/Town’s Housing Supply, by Citywide Average Rent




Comments
No Comments have been published for this article.