The 1846 Repeal of the Corn Laws in Great Britain has attracted enormous attention in economics, history, and political science.Footnote 1 The explanation of this famous episode is still contested, for the Corn Laws were repealed in 1846 by a Conservative government that was backed by a sound majority of Conservatives and aristocratic landowners in Parliament. Repeal therefore seemingly eludes standard theoretical accounts of the formation of commercial policy, which put political survival, pressure groups, and the median voter at center stage.Footnote 2
Up to the 1980s much research interpreted repeal as the result of the force of ideas.Footnote 3 The quantitative analysis of repeal by William Aydelotte in the 1960s proved that voting behavior in the House of Commons could not be explained by reference to personal pecuniary interests of the representatives.Footnote 4 Repeal seemed a clear case of the influence of ideas on economic policy formation. William Grampp pointed to the declaration of Parliament in 1820, which introduced free trade as the guiding principle of commercial policy. The subsequent changes in commercial policy were nothing more than the execution of that principle.Footnote 5 Charles Kindleberger, in turn, found that all European governments used free trade as a reaction to different stimuli between 1820 and 1870, while after 1873 they all reacted differently to the industrial crisis and decreasing agricultural prices. He therefore contended that around 1850 the countries of Europe “moved to free trade for ideological or perhaps better doctrinal reasons.”Footnote 6 Douglas Irwin maintained that since Prime Minister Robert Peel had a pivotal role in repeal, his sympathy for political economy made economic ideas important for repeal itself.Footnote 7
The last twenty years have been marked by a renewed interest in Corn Law Repeal by political scientists who test whether repeal can be explained by economic interests by using sophisticated statistical methods of roll-call analysis, as well as qualitative and quantitative research on the parliamentary proceedings and the principle actors involved. Two authors have pointed to the insufficiency of economic interests. In 1989 Timothy McKeown complemented Aydelotte's data set with independent measures of the economic makeup of constituencies. McKeown concluded that rapid economic changes created a situation where a majority could support Corn Law abolition. But economic changes did not lead directly to a shift in public policy, for the Corn Laws were abolished by the accession to the anti-protectionist group of the Peelites and Irish representatives, whose constituencies had not undergone any dramatic change. McKeown thus points to broader political concerns playing a part in repeal.Footnote 8 Like McKeown, Iain McLean and Camilla Bustani conclude that mainstream public choice is insufficient to explain repeal. Having measured the influence of interests and ideology (defined as an attitude towards religion) on the voting behavior of the Conservatives, they argue that interests were important, but ideology exercised even more influence. Based on an analysis of the letters and memoranda of the most important politicians, they pointed in particular to the role of Peel, who had lost faith in the Corn Laws and used the Irish famine as a political strategy to change debate over the Corn Laws from a purely economic issue to a political one.Footnote 9
In a series of recent publications, Cheryl Schonhardt-Bailey revived an explanation of repeal based on public choice. First, she rightly showed that the capital portfolios of the landed elite were diversified by investments in industry, lessening their penchant for protectionism.Footnote 10 She also measured the combined effects of interest, party affiliation, and MPs' personal ideology in a single model. Schonhardt-Bailey depicted the Conservative party as a coalition between two interest-based alliances, with a shared concern for retaining protectionism. Non-Peelite Conservatives mostly represented agricultural districts and had no incentive to follow Peel's move for repeal. The Peelites, however, represented districts with comparatively more free trade leaning interests. Before 1846 Peelites voted according to a general Conservative protectionist ideology, but in 1846 they were set free by Peel to follow the median voter of their district, who was leaning towards free trade.Footnote 11 Thus it was not ideology that made repeal possible, but rather the liberation from ideology.
In this article, we evaluate the adequacy of economic interests to explain the liberalization of agricultural trade in the middle of the nineteenth century, using the Belgian case. The question is whether economic change necessarily leads to a shift in economic policy, as George Stigler argued for the British repeal: “If Cobden had spoken only Yiddish, and with a stammer, and Peel had been a narrow, stupid man, England would have moved toward free trade in grain as its agricultural classes declined and its manufacturing and commercial classes grew.”Footnote 12 For the Belgian situation, Johan F. M. Swinnen, Anurag N. Banerjee, and Harry De Groter have analyzed the correlation between variations in prices and changes in agricultural protection after 1875.Footnote 13 Yet for them, the mechanism connecting prices and tariffs remains a theoretical black box based on economic interests. It is exactly this black box that we want to open using data on the individual votes of Belgian representatives in the years 1834–1873.
The Belgian case is interesting for several reasons. First, the Belgian shift to free trade takes place at roughly the same time as the British one, and our analysis is the first ever of the Belgian roll-call votes. The comparison is all the more interesting since Belgium was the first country in continental Europe to industrialize. In the regions of Mons, Charleroi, and Liège, coal mining and metallurgical industry flourished. In Verviers, which was called the Manchester of the continent, a mechanized woolens industry was established.Footnote 14 The provisional results of the historical national accounting project show that the share of agriculture in GDP decreased from 30 percent in 1810 to 18 percent in 1870. The share of industry on the other hand increased from 16 percent to 40 percent in the same years.Footnote 15 The step to free trade in foodstuffs around 1850 then seems logical. The political scientist Pascale Delfosse indeed argued that the discussions on Belgian agricultural protectionism were the result of a clear-cut opposition between landed elites defending their interests in a rapidly changing economy and representatives of the new industrial and urban society.Footnote 16
The second reason the Belgian case is interesting is because of the extraordinarily detailed economic data available for the electoral districts. In 1846 the Belgian Central Statistical Bureau organized a census of population, agriculture, and industry. This data allows for a much more precise economic characterization of the constituencies than in the British case. Schonhardt-Bailey and McLean and Bustani had to use quantifications of broad verbal descriptions to characterize the economic profile of each constituency. McKeown had to settle for agricultural variables from the year 1866, 20 years after repeal. Moreover, his data are often at county rather than at constituency level. Our detailed variables are gathered at the constituency level and are chronologically consistent.
Finally, especially in the work of Schonhardt-Bailey, ideas become a specific factor alongside interests and parties. They are seen as a residual, which cannot be explained by public choice or party politics. But this residual collects all unobserved individual variation as well as measuring errors, and it seems inappropriate to label this as ideology or ideas. The Belgian case, by contrast, allows us to clearly establish (but not measure) the importance of economic ideas as a component of interests. That is more in line with literature on the relation between interests and ideas by Robert Keohane, Judith Goldstein, Mark Blyth, and John K. Jacobsen, who point to the complexity of society and actors' resulting uncertainty about the right policy choices.Footnote 17 Interests are the result of an economic position mitigated by an interpretation of that position, which is in turn colored by ideas. It is therefore difficult, if not impossible, to separate ideas from interests. The large number of roll calls on the Corn Laws in Belgium and the extensive debates in Parliament between 1834 and 1873 make it possible to trace changes in representatives' perception regarding the economic interests of their districts.
We will first review the development of Belgian corn tariffs between 1834 and the step to complete free trade in corn in 1873. We will next present the econometric analysis of representatives' voting behavior. The issue will then be the role that ideas played in the evolution towards free trade.
FROM AGRICULTURAL PROTECTION TO FREE TRADE IN BELGIUM, 1834–1873
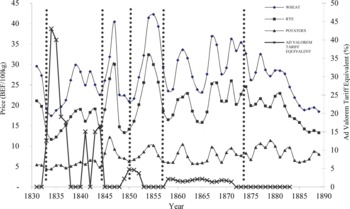
Figure 1 depicts the evolution of the yearly price averages of wheat, rye, and potatoes for the period 1830–1890, as well as the dates of the votes on the Corn Laws under consideration (dotted vertical lines).Footnote 18 From this figure, it appears that the Belgian legislators did not simply react to price changes. The law of 22 February 1850 is particularly intriguing because it buried the protectionist sliding scale law at a time when prices were low. The price dip around 1865, however, did not automatically produce any legislation. Figure 1 also includes the ad valorem tariff equivalent of the specific tariffs that were in force.Footnote 19 While the tariffs of the Belgian sliding scale law, expressed as ad valorem equivalents, were lower than the British ones, the evolution is comparable.Footnote 20
PRICE EVOLUTION, AD VALOREM TARIFF EQUIVALENT, AND YEARS OF IMPORTANT VOTES

After Belgian independence in 1830 the prices of wheat and rye started to fall because of good harvests, sparking demands for agricultural protection.Footnote 21 The protectionist law of 31 July 1834 introduced a sliding scale inspired by the British Corn Law of 1828, with an increasing import tariff as the prices of wheat and rye declined. When the price reached 19 Belgian francs (BEF) per 100 kg, the highest tariff of 7.5 BEF was imposed (39 percent ad valorem), and if the prices dropped below 15 BEF, imports were banned. At the other extreme, imports were free when prices exceeded a certain threshold, and in the case of extremely high prices, exports were prohibited. The idea behind the sliding scale was to guarantee agricultural producers a minimum price that was considered remunerative. In 1844 the prices of wheat and rye once more descended to an alarmingly low level, sparking calls for a more restrictive protectionist law. In February 1845, 21 members of the House of Commons introduced a bill that became known as the “Law of Famine.” It had the intention of guaranteeing corn producers even higher prices than the 1834 law by introducing two new scales.
However, this pinnacle of agricultural protectionism was never promulgated because of the subsistence crisis of 1845–1848. The failure of the potato crop in 1845 and of the rye harvest in 1846 produced extremely high prices until 1848 (see Figure 1), causing hardship for a large majority of the population. The suffering was compounded by an outbreak of cholera in 1848.Footnote 22 The government suspended the sliding scale law in September 1845, and temporary measures left the import of foodstuffs free until 1850. The yearly renewable measures also prohibited the export of foodstuffs between 1845 and 1848.
After the end of this severe subsistence crisis, the temporary laws were replaced by the law of 22 February 1850, which fixed the new agricultural tariffs for an indefinite period. The law was an important step towards free trade, but also showed many signs of a compromise. The genesis of this law was long and complex. When the prices began to descend at the end of 1848, the Liberal government of Charles Rogier wanted to extend the temporary measures until the consequences of British repeal (which took effect in February 1849) became clear.Footnote 23 At the end of 1849, Rogier proposed a new bill that prolonged the temporary measures for two years, but by that time the prices of wheat and rye had once more descended to such alarmingly levels that the agricultural protectionists were goaded into action. The parliamentary commission studying the bill argued that agriculture should receive protection as long as industry remained guarded from competition.Footnote 24 Lengthy discussions in the House of Representatives then led to the law of 22 February 1850. It brought the tariff for wheat to 1 BEF per 100 kg, which amounted to a duty of 4.8 percent relative to the average price of 1850.
The law of 22 February 1850 was a mixed triumph. It ended the sliding scale of 1834 and is therefore the equivalent of British repeal. Yet many proponents of free trade voted against the law because they thought that the tariff of 1 BEF was too high. Many protectionists also opposed it because they hoped for the return of a protectionist sliding scale.
Belgium's tariff history became even more complicated thereafter, because the “permanent” law of 1850 did not last long. A new subsistence crisis struck between 1853 and 1857, because of bad harvests from 1853 to 1855 and difficulties with the imports of foodstuffs during the Crimean War (1854–1856). Prices rose even higher than in 1845–1848.Footnote 25 The government reverted to the typical temporary crisis measures of free imports and export prohibition in yearly renewable laws. The Catholic Prime Minister Pieter De Decker, a known free trade proponent,Footnote 26 moved for a new permanent law at the end of 1856. According to contemporary economists, the resulting legislation—the law of 5 February 1857—inaugurated an era of free trade in Belgian corn tariffs.Footnote 27 But the law did leave a tariff of 0.5 BEF for 100 kg of wheat (1.7 percent ad valorem at the high prices of 1857).
The law of 5 February 1857 functioned until a new period of high prices in 1871–1873, when a Catholic government removed all remaining duties on foodstuffs. The law of 2 January 1873 was accepted unanimously in the House of Representatives.
AN ECONOMETRIC ANALYSIS OF REPRESENTATIVES' VOTING BEHAVIOR
Our empirical analysis seeks to disentangle the relative importance of representatives' personal economic interests, their party affiliation, and the economic interests of their constituents in explaining their votes on the Belgian Corn Laws in the period 1834–1873. We study voting on five laws: the sliding scale law of 1834, the law of famine of 1845, the Repeal law of 1850, the law that lowered the tariff to 0.5 BEF in 1857, and the removal of all remaining tariffs in 1873.Footnote 28 The first four roll-call votes will be analyzed quantitatively. Because the removal of tariffs in 1873 was unanimous, it is analyzed qualitatively in the next section.
Data
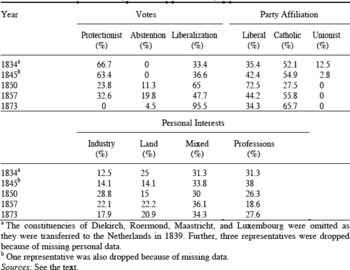
The votes of the MPs in the roll-call votes are collected in the published parliamentary procedures.Footnote 29 Only votes actually cast are considered, while absentees are disregarded. Table 1 shows the percentages of votes, party affiliation, and personal interests in the roll-call votes under consideration.
DISTRIBUTION OF VOTES, PARTY AFFILIATION, AND PERSONAL INTERESTS

aThe constituencies of Diekirch, Roermond, Maastricht, and Luxembourg were omitted as they were transferred to the Netherlands in 1839. Further, three representatives were dropped because of missing personal data.
bOne representative was also dropped because of missing data.
Sources:
See the text.
The party affiliations of the MPs were collected from the main published biographical dictionary of the members of Belgian Parliament.Footnote 30 Party formation in Belgium revolved about differences over the role of the church and religion that pitted Catholics against Liberals.Footnote 31 Party affiliation is represented by three dummy variables: CATH, LIB, and UNION. The first two dummies stand for the respective attachment to the Catholic and Liberal party. UNION stands for a political current of Unionists, which strived for cooperation among the central political parties in the first years of independence. The Unionists are of limited importance for our analysis and they disappeared as tensions between Catholics and Liberals mounted in the 1840s. In line with British literature, we expect Catholic representatives (Conservatives) to favor agricultural protection more than the Liberals.
Representatives' personal economic interests are derived from biographical dictionaries of Belgian Parliament and similar biographical sources for other political institutions.Footnote 32 Large landowners are found in the list of persons eligible for the Senate. Eligibility was conditional on paying a high level of taxes, which required owning a large amount of land.Footnote 33 Laureyssens' list of board members was employed to find representatives involved in the industry.Footnote 34 The personal economic background of representatives is captured by four mutually exclusive dummy variables: PERLAND indicates eligibility for the Senate because of landownership, PERIND indicates membership on the board of industrial and financial companies, PERBOTH indicates a combination of landownership and interests in industrial and financial companies. As in Britain, portfolio diversification was a reality in Belgium, with industrial classes investing in property and landowners investing in the financial and industrial sectors.Footnote 35 Finally, PERFREE indicates activity as lawyer, military officer, civil servant (before 1848), notary, doctor, journalist, university professor, or engineer (with no large landownership or interests in industrial or financial companies). We expect landowners to favor agricultural protection and industrialists to prefer free trade because this would allow for lower wages.
The economic and geographic characteristics of the constituencies come from data for the year 1846, but the economic and demographic structure did not change much over the period of the analyzed votes (1834–1857).Footnote 36 The population and industrial censuses of 1846 allow us to capture the urbanization (the share of the population living in cities) and industrialization of the constituencies. The general demographic structure of the constituency is captured by its area (area) and population (population), and their ratio, the population density (popdensity). The variables popcitrel and needyrel are the percentage of the population living in cities and the percentage officially recognized as needy. The number of needy people is an indicator for poverty and potential political instability (food riots). Industrialization is measured by the percentage of the population working in sectors in which (private) firms employed on average more than 100 people (indrel100).
We also have two variables that measure changes in the franchise that may have affected support for free trade. One of them measures the percentage of voters living in cities before the law of 12 March 1848 (cityvoterel7) and the other the percentage of voters living in cities after the law of 12 March 1848 (cityvoterel8).Footnote 37 The law of 12 March 1848 lowered the amount of taxes payable to obtain voting rights.Footnote 38 It increased the number of voters living mainly in more urban constituencies and can thus be part of the explanation of the shift to free trade. For measures of constituents' stake in agriculture, we used the agricultural census, which provided the percentage of farmland sown in wheat and rye (wheatryerel) and in potatoes (potatoerel); the number of livestock (dairy cows of more than two years old plus pigs older than two months), the percentage of agricultural land worked by owner operators (propratio) as opposed to tenants; and the percentage of farms over ten hectares large (farm10ha). We expect representatives whose constituencies specialize in wheat and rye to favor agricultural protection. We also expect more support for protectionist measures if more land is leased rather than owned, because large landowners would expect protectionism to raise their rental incomes and they would be more effective lobbyists. The preference of constituents in districts that specialize in livestock production is harder to predict: as consumers of cereals they gain from lower cereal prices, but the laws under consideration in 1850 and 1857 also incorporated tariffs on livestock.Footnote 39
We also measure the influence of the subsistence crisis, because we expect that representatives from constituencies where the subsistence crisis struck hard would be more likely to support agricultural trade liberalization. The impact of the subsistence crisis is captured by a dummy variable (POTATOCRIS), which is one if the fraction of the needy exceeded 25 percent of population and if at least 4 percent of the agricultural land was used to grow potatoes.Footnote 40 This variable is one for 14 (out of a total of 41) constituencies, which are grouped in two geographical clusters: East and West Flanders and a smaller region east of Brussels. The first cluster was particularly severely hit. Most farms in this region were very small, intensively worked, and leased for a high rent. The typical household here combined cottage industry with farming.Footnote 41 When the potato crop failed, these agricultural producers became dependent on the market—or charitable institutions—for food.
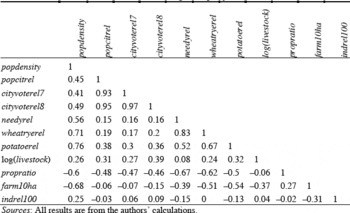
CORRELATION MATRIX (all districts weighted equally)

Sources:
All results are from the authors' calculations.
Table 2 displays the correlations of these variables. Note how population density correlates positively with the percentage of the population living in cities and with agricultural specialization in cereal and potato production. More densely populated constituencies also tend to have less land owned by the farmers and fewer farms over ten hectares. Because the percentage of the population in cities and the fraction of voters in cities are almost perfectly correlated, we use only the fraction of the voters in cities in our analysis. Because the share of the population that is needy was measured in 1846, at the height of the subsistence crisis, it is positively correlated with cereal and potato production.
General Analysis
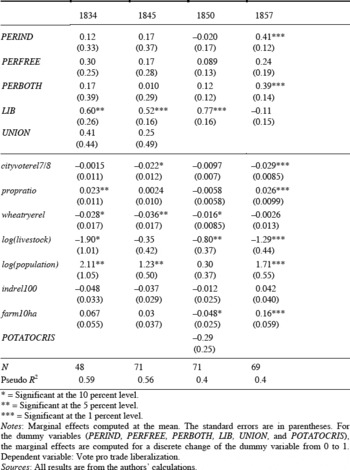
After eliminating nine abstentions in the 1850 vote and seventeen in the 1857 vote, we can analyze the roll-call votes of 1834, 1845, 1850, and 1857 as a binary variable.Footnote 42 We apply probit analysis to each vote separately to allow for maximal flexibility and account for differences in the content of the laws. General differences in historical circumstances are, as far as they are orthogonal to our variables, absorbed into the constants of the regressions. Table 3 presents the marginal effects of each explanatory variable in a probit regression.Footnote 43
These marginal effects represent the change in the probability of a vote for trade liberalization due to a unit increase in the relevant variable, while all other explanatory variables are set equal to their mean values. For dummy variables, the marginal effect is calculated by changing membership from the reference group to the group indicated by the dummy. For logarithmic variables, it concerns a one percent increase.
The representatives' personal economic background only affects voting in a statistically significant way in 1857. Representatives with industrial interests are, other things being equal, 41 percent more likely to vote for liberalization in 1857 than great landowners and 39 percent more likely to vote yes if they also own land in addition to their industrial holdings. But in the other votes, the representatives' personal economic interests had no significant effect.Footnote 44 Party affiliation, by contrast, is the most important variable in terms of its magnitude and its statistical significance, except for the 1857 vote, when both the Catholic and Liberal parties were divided. All other things being equal, a Liberal representative was in 1834, 1845, and 1850 some 60, 52, and 77 percent more likely to support agricultural trade liberalization than a Catholic representative.
As for the constituency background, a higher share of agricultural land leased does increase—as expected—the probability of a protectionist vote in 1834 and 1857. Livestock and wheat and rye production boost the likelihood of a protectionist vote. The effects of industrialization and the potato crisis, however, are not significantly different from zero Surprisingly, the probability of a protectionist vote is higher if a greater share of voters live in the cities, which suggests that the increased prominence of city voters due to the law of 12 March 1848 was not a factor in Belgium's move towards agricultural trade liberalization. Perhaps some representatives of urbanized constituencies believed that the protectionism of the sliding scale was in the best interests of their constituents, because it would also restrict exports in times of scarcity. Furthermore, the scale of urbanization was relatively limited in Belgium, even though it was increasing rapidly. Brussels, for instance, only counted 123.874 inhabitants in 1846 and even in the most urbanized constituencies a majority of the population still lived in the countryside.
MARGINAL EFFECTS PROBIT ESTIMATION

* = Significant at the 10 percent level.
** = Significant at the 5 percent level.
*** = Significant at the 1 percent level.
Notes:
Marginal effects computed at the mean. The standard errors are in parentheses. For the dummy variables (PERIND, PERFREE, PERBOTH, LIB, UNION, and POTATOCRIS), the marginal effects are computed for a discrete change of the dummy variable from 0 to 1. Dependent variable: Vote pro trade liberalization.
Sources:
All results are from the authors' calculations.
Additional Analysis of the Votes in 1850 and 1857
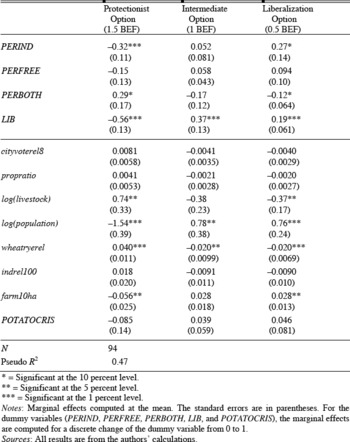
The vote on the law of 22 February 1850 was, as we have noted, a compromise that was not completely acceptable for all parties. A number of radical free trade supporters and protectionists rejected the compromise, which obviously influences the analysis of the 1850 vote. We can get a better sense of what was happening by examining the votes on three amendments to the bill. On 2 February 1850 all present members of the House of Representatives voted for one of the three tariff options proposed by amendments representing the free trade position (a tariff of 0.5 BEF on wheat), the compromise position (a tariff of 1 BEF), and the protectionist position (a tariff of 1.5 BEF). The tariffs amounted to respectively 2.4 percent, 4.8 percent, and 7.2 percent ad valorem at the average prices prevailing in 1850.Footnote 45 The marginal effects at the mean of an ordered probit analysis of the votes on the amendments to the 1850 bill are presented in Table 4.
In contrast to the vote on the final compromise, the representatives' personal economic background did affect their votes on the amendments. All other things equal, representatives with industrial interests are 32 percent less likely to vote for the protectionist amendment and 27 percent more likely to prefer the 0.5 BEF amendment than landowners. Representatives with a professional background show a similar, but less pronounced preference for liberalization. Representatives with a mixed background in land and industry are significantly more likely than those whose interests are in land alone to vote for the protectionist option.
Livestock and wheat and rye production in the constituencies are still an important factor in producing support for the protectionist amendment. But as before, party affiliation has the most significant effect: Liberal representatives were 56 percent less likely to vote for the protectionist option, and respectively 37 percent and 19 percent more likely to vote for the middle and liberalization options than Catholic representatives. The ordered probit on the amendments allows one to conclude that the underlying variables still work in the same direction in 1850 as they did in 1834 and 1845. However, during the voting on the amendments in 1850, the representatives had more room to take their personal interests into account.
MARGINAL EFFECTS OF ORDERED PROBIT ANALYSIS 1850 AMENDMENT VOTE

* = Significant at the 10 percent level.
** = Significant at the 5 percent level.
*** = Significant at the 1 percent level.
Notes:
Marginal effects computed at the mean. The standard errors are in parentheses. For the dummy variables (PERIND, PERFREE, PERBOTH, LIB, and POTATOCRIS), the marginal effects are computed for a discrete change of the dummy variable from 0 to 1.
Source:
All results are from the authors' calculations.
That leaves the vote in 1857 as an apparent enigma. The strongest variable of the previous years, party affiliation, stopped functioning in 1857, while personal economic background and the characteristics of their constituencies take on a much greater importance than before (Table 3). To understand this, we need to examine the discussions on corn tariffs in the years immediately preceding 1857, when corn prices were extremely high (Figure 1). The protectionists had based their demands for agricultural protection on the idea of justice, and not so much on any economic theory.Footnote 46 The leader of the protectionists during the 1850s, the Catholic Barthélemy Dumortier, was very explicit that he and his partisans always wanted to defend that part of the population that was suffering. During periods of high prices, they wanted to protect consumers with free imports and an export prohibition. But when prices were low, the protectionists wanted protectionist measures for the agricultural sector. By using this rhetoric, Dumortier hoped to reinstate the sliding scale of 1834.Footnote 47 But Prime Minister De Decker pushed for free trade in 1856/57 when the corn prices were still very high, which explains why the free trade law made it through Parliament. In these circumstances, many protectionists could not oppose free imports because of their own rhetoric about defending consumers. In the end, De Decker played a role a bit like Peel's. De Decker was a leading member of the Conservative party, but he had opposed previous protectionist legislation. The bill he brought forth completely split the Catholic and the Liberal parties during the vote. This political confusion generated a large number of abstentions (19.8 percent of all votes) and allowed a significant number of representatives to follow their personal economic interests and the interests of their constituencies.
INTERPRETATION OF THE UNANIMOUS 1873 VOTE
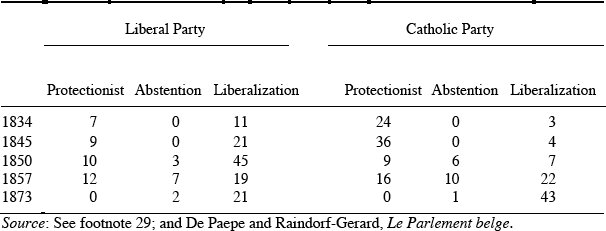
In 1873 the remaining agricultural tariffs were removed. All representatives irrespective of their party affiliation or constituency now voted for free trade, except for three abstentions. Opposition to free trade had been on the wane since the 1850 vote. As Table 5 shows, party affiliation, the strongest explanatory variable in the 1834, 1845, and 1850 votes, lost its force in 1857 and 1873. Abstentions also rose in 1850 and 1857, a sign of growing hesitation on the part of both Liberals and Catholics. The Liberals, who had in general favored trade liberalization, were divided in 1857, but in 1873 they all supported liberalization. The Catholics, who were outright protectionist in 1834 and 1845, began to defect to the free trade side in growing numbers, starting in 1850, and in 1873 all Catholics voted for free trade. During the short debate on the 1873 law in the House of Representatives, the Catholic Minister of Finance Jules Malou claimed that free entry of foodstuffs was now generally accepted. That was in itself a major change as Malou was one of the 21 representatives who had proposed the protectionist “Law of Famine” in 1845 and had voted against the free trade bill of De Decker in 1857. Only one Catholic representative, Léon T'Serstevens, pleaded in favor of agricultural protection. But no one else supported this position, a sign that free trade was now seen as in everybody's interest. Malou replied that “the honorable Mr. T'Serstevens seemed to me to be out of touch as far as our economic system is concerned.”Footnote 48
VOTES BY PARTY

Source:
See footnote 29; and De Paepe and Raindorf-Gerard, Le Parlement belge.
How then can we explain this development towards universal support for free trade in agricultural products? It is tempting to invoke the rising share of the industrial sector in GDP, but industrialization cannot explain the universal preference for free trade by 1873 because industry was geographically concentrated in five or six constituencies, leaving many agricultural constituencies untouched by industrialization until the last quarter of the century. In other districts, industrialization did occur, but it remained limited to small industrial islands in an immense agricultural sea.Footnote 49 Nor did agriculture change much between 1850 and 1873: it remained largely traditional until 1880, when agricultural imports and the introduction of new technologies started a very slow process of transformation that was only completed after World War II.Footnote 50
What then is the explanation? As many authors have argued in the case of the British repeal, other factors besides economic interests have to be taken into account, and the econometric analysis has to be supplemented with a qualitative analysis of the press and the parliamentary debates. Ideas were important and could affect the votes on agricultural trade liberalization. By 1873 almost every representative, regardless of personal interest, party, and constituency, was in favor of free trade. It is certainly not the case that they were all voting against their own or their constituents' interests.Footnote 51 It was their perception of these interests that had changed. The representatives came to think that free trade was to their advantage and (more importantly) to the advantage of their constituency. In Belgium, ideas were driving a shift in the perception of interests. That is radically different from Britain where research makes a clear distinction between interests and ideas.
How did Belgian opinion shift? As McLean and Bustani have argued for Britain, we maintain that the subsistence crisis of 1845–1848 played a part in shaking up the old ideas in Belgium. Previously, Belgium, and Flanders in particular, was thought of as an advanced agricultural economy. The American Henry Colman, who visited Europe in the 1840s, was impressed by Flemish agriculture, which he considered to be the best in Europe.Footnote 52 Even King Leopold I remarked on the advanced state of agriculture in his 1843 speech before Parliament, two years before the subsistence crisis: “Belgium, so renowned for its agricultural progress.”Footnote 53 But the subsistence crisis changed this perception for many politicians. The censuses of 1846 had the same effect. The year after the census, its architect, Adolphe Quetelet, concluded that Belgian agriculture simply could not feed the growing population.Footnote 54
Quetelet's interpretation remained contested for ten more years, but the subsistence crisis sparked a search for solutions.Footnote 55 One of the proposed solutions was free trade. But free trade was not a vague idea floating in the air. It was supported by a powerful nation, the United Kingdom, and very active pressure groups. The Repeal of the Corn Laws in the United Kingdom changed the status of political economy. Before repeal, the idea of free trade was considered a theoretical chimera by many Belgian representatives.Footnote 56 Once the economic hegemon of the time chose free trade, it seemed the right policy on the way to industrialization for the young Belgian nation. The British repeal inspired a number of Belgian economists backed by industrialists from the Verviers district to start a campaign for free trade.Footnote 57 The young engineer and economist Adolphe Le Hardy de Beaulieu formed the Association Belge pour la Liberté Commerciale, which organized meetings that resembled those of the British Anti-Corn Law League. The association was backed by a small, but very vocal, group of representatives to the House. Free trade economists infiltrated the Société Centrale d'Agriculture, the most prominent learned agricultural society, which counted many members of Parliament in its ranks. The economist and journalist Gustave de Molinari commented continuously on Belgian economic policy in his journal L'Économiste Belge (1855–1868).Footnote 58 These economists sought to forge coalitions with agriculturalists, industrialists, and the chambers of commerce in order to put pressure on the government.
The opinion that Belgium was confronted with a structural shortage in food production became more difficult to deny for the protectionists when a new subsistence crisis in 1853–1857 again pushed prices to worrying heights and led to food riots.Footnote 59 The Société Centrale d'Agriculture, which began supporting free trade in the second half of the 1850s, confirmed the structural character of the shortage in food production in 1854: “A sad truth, a truth full of dangers, is experienced by the people every day. No one contests it, it is officially recognized. What the economists, who were thought to be theorists and dreamers, had dared to proclaim, is now proved by governmental statistics: the growth of food production is not keeping pace with the increasing population.”Footnote 60 The most thorough analysis of the situation (with references to the works of British political economists) was written by Edouard Ducpétiaux, a Catholic social scientist and member of the Central Statistical Commission, who estimated the average shortage in wheat production to be about one-tenth of the harvest.Footnote 61 Faced with this evidence, more and more representatives came to believe that the subsistence crisis had become endemic and that Belgian agriculture did not produce enough food, even in the case of good harvests, to feed the growing population.Footnote 62 In 1855 Prime Minister De Decker acknowledged this as a fact.Footnote 63 The defense of protectionist corn tariffs became a difficult task in these circumstances, since free traders could depict tariffs as an unacceptable taxation on an already dear primary product.
The awareness of the structural shortage in corn production, British repeal, the actions of the Belgian economists, and De Decker's strategy all opened the way for free agricultural trade in Belgium. In the 1860s front-rank economists confirmed that free trade was the best policy choice for Belgium. Auguste Orts, a Liberal representative and professor of political economy at the University of Brussels, told his students that “The absolute liberty of trade has brought the results you can observe today.”Footnote 64 Emile de Laveleye, professor of political economy at the University of Liège, wrote that economic facts had proved that free trade yielded prosperity. The British example was telling in his mind.Footnote 65 The prominence of the British economy was acknowledged in Parliament: “If England, which in the past recognized our superiority, has surpassed us today, this is because for a long time she has rejected the old doctrine of Protection and Subsidies.”Footnote 66
CONCLUSION
Models based on narrow economic interests cannot explain the politics of the adoption of free trade in the middle of the nineteenth century. British Repeal of 1846 is a notorious example. Political scientists and economists studying repeal have had a hard time making their models fit. Many authors have pointed to other factors, including ideas, institutions, and political strategy. Only Schonhardt-Bailey has succeeded in explaining repeal using economic models of decision making. But in order to make her interpretation of 1846 work, she had to acknowledge that the Corn Laws had survived votes in the immediate years before 1846 because of Conservative ideology.
The Belgian case adds to the evidence that interest-based explanations of the liberalization of corn trade should not be taken at face value. The corn tariffs were a hotly debated issue in Belgian Parliament in the first three decades after independence. During these long discussions, a protectionist law was voted in 1834 and tightened in 1845. But in 1850, after the subsistence crisis, the sliding scale of tariffs was abolished, and in 1857 the tariffs for corn were lowered to a purely “fiscal” level. After 1857 debate over the issue subsided and by 1873 all representatives had come to accept agricultural free trade.
We conducted an econometric analysis of the roll-call votes on these tariff laws. Using biographical material and the 1846 censuses, we were able to construct detailed variables to measure the influence of party affiliation, of representatives' personal pecuniary interests, and of the economic characteristics of their constituencies. Representatives' personal interests explain little of the policy shift. The economic characteristics of the constituencies do more and partially explain tariff formation in 1834, 1845, 1850, and 1857. A constituency background with a high population, many leaseholders, and much cereal acreage and livestock increases the probability of a protectionist vote.
As for party affiliation, it is the most significant variable in 1834, 1845, and 1850. In those years a Catholic (Conservative) party affiliation increases the probability of a protectionist vote. But the effect of party affiliation disappeared in 1857 and in the unanimous 1873 vote in favor of free trade. We therefore share the view of McKeown and McLean and Bustani that other political factors should be taken into account, in particular ideas. When the subsistence crisis was redefined in Malthusian terms as a structural shortage in food production, protectionism became difficult to defend. The economic ideas of economists and the successful example of Great Britain all pointed to free trade in corn as the best policy option. Political strategy also came into play in Catholic Prime Minister De Decker's decision about the timing of the 1857 vote, a decision that made his role comparable to that of Peel.
In contrast to research on British repeal, we chose not to model ideas in our econometric analysis. Measuring ideas is difficult, and a decision to view ideas as either an attitude toward religion (McLean and Bustani) or as a residual (Schonhardt-Bailey) raises many questions. Like many scholars in international political studies, we think it is difficult to separate ideas from interests. An interest cannot always be simply deduced from social-economic facts, without references to the ideas the actor holds of his place within the economy. As complexity of modern society rises, rational agents do not possess all necessary information, and so interests are not self-evident. One needs an interpretative framework that guides self-interest. The long research perspective of this article allows us to document that the interpretation of interests changed after 1857, leading to the unanimous 1873 vote. That shift occurred even though the economic characteristics of most constituencies did not change radically between the debates on corn tariffs in 1845 or 1850 and the complete liberalization of these tariffs in 1873. This shift in opinion caused agents to reinterpret their interests, and that has to be taken into account.