Implications
Here, we report the results of an experiment designed to ascertain the effects of commonly experienced concentrations of atmospheric ammonia, high levels of background noise and low lighting levels on the social behaviour of growing pigs. We found that pigs kept in rooms with representative ammonia (20 ppm) and lighting levels (40 lux) showed higher incidence of aggression in the early stages of exposure to the treatment conditions (1 week). These data suggest that environmental conditions commonly experienced in UK indoor pig production may be exacerbating aggression in growing pigs, with consequent implications for their welfare. We recommend in particular that levels of light and ammonia should be considered carefully by farmers in management and design of pig production systems.
Introduction
Domestic pigs (Sus scrofa) can discriminate group mates from an early age and typically develop stable social groups (Ewbank et al., Reference Ewbank, Messe and Cox1974). The successful formation of these groups is necessary to prevent high levels of agonistic encounters among littermates, which may ultimately compromise welfare and productivity (Giersing and Andersson, Reference Giersing and Andersson1998; Drickamer et al., Reference Drickamer, Arthur and Rosenthal1999; Pitts et al., Reference Pitts, Weary, Pajor and Fraser2000; Turner et al., Reference Turner, Horgan and Edwards2001; Andersen et al., Reference Andersen, Naevdal, Bakken and Boe2004). Growing pigs can distinguish familiar and unfamiliar conspecifics using visual, olfactory and auditory cues, either independently or in conjunction with one another (Kristensen et al., Reference Kristensen, Jones, Schofield, White and Wathes2001; McLeman et al., Reference McLeman, Mendl, Jones and Wathes2008). This ability, however, may ultimately be compromised by environmental factors relating to indoor commercial production systems, where high concentrations of aerial pollutants (e.g. ammonia), low light (LL) intensity and high levels of background noise are commonplace (Algers et al., Reference Algers, Eskebo and Stromberg1978; Wathes et al., Reference Wathes1997; Talling et al., Reference Talling, Lines, Wathes and Waran1998a). The potential for these environmental conditions to affect successful social group formation and behaviour is at present unclear.
An inability to show appropriate submission or to detect social cues in a suboptimal physical environment (i.e. by signal interference), as well as the number of times individuals may encounter one another (i.e. familiarity), may serve to disrupt the processing of social information and alter social behaviour (Turner et al., Reference Turner, Horgan and Edwards2001; Turner and Edwards, Reference Turner and Edwards2004). Difficulty in determining conspecific intent and communicating an appropriate response may also lead to avoidable aggression and stress. Even if alternative ways of maintaining social stability and reducing aggression are adopted, such as animals recognising status symbols rather than individuals (Pagel and Dawkins, Reference Pagel and Dawkins1997; Turner et al., Reference Turner, Horgan and Edwards2001; Turner and Edwards, Reference Turner and Edwards2004), a corresponding loss either of stimulation or positive interactions (which occur only in stable relationships between individuals that perceive one another as familiar) may result. Understanding the mechanisms involved in social interaction and how they may be disrupted would be valuable, not just to avoid negative state but also to promote positive well-being (Yeates and Main, Reference Yeates and Main2007).
Current legislation requires that pigs are kept at a minimum light intensity of 40 lux for 8 h/day (Council Directive 2001/93/EC; code of recommendations for the welfare of livestock: pigs; defra, 2007). This intensity does not appear to be inherently aversive; pigs show no preference for, or avoidance of, higher intensities in preference tests (Taylor et al., Reference Taylor, Prescott, Perry, Potter, Le Sueur and Wathes2006). In addition, reducing light intensity is a method sometimes employed by farmers in order to reduce incidence of abnormal behaviour (e.g. tail-biting) in pigs (van Putten, Reference van Putten1969; Blackshaw, Reference Blackshaw1981). Little is presently known about pigs’ visual abilities in lower light conditions, and previous studies have been hampered with methodological difficulties (e.g. Koba and Tanida, Reference Koba and Tanida2001; Zonderland et al., Reference Zonderland, Cornelissen, Wolthuis-Fillerup and Spoolder2008). If pigs’ general visual discriminatory ability is affected by low levels of light, this may have implications for accurate detection of visual cues from conspecifics. The extent to which LL affects the stability of social groups is not known. Given that pigs primarily use visual (Jensen, Reference Jensen1982) and olfactory (McGlone, Reference McGlone1985) cues to signal aggression and submission during social interactions, it is plausible that the processing of visual cues associated with social interactions is affected by low light.
There is no legislation specifying the maximum acceptable levels of aerial ammonia to which pigs can be exposed in indoor systems (Groot Koerkamp et al., Reference Groot Koerkamp, Metz, Uenk, Phillips, Holden and Sneath1998). For humans, however, the current occupational exposure standard for ammonia sets a limit of a maximum of 8 h exposure to 25 ppm ammonia in any 24 h period (UK Health and Safety Executive, 2001). The Welfare of Farmed Animals (England) (Amendment) Regulations (2003) specify that farms should ensure ‘effective ventilation’ in order to reduce ammonia concentration. Despite this, concentrations of aerial pollutants such as ammonia exceeding 25 ppm are commonly reported in pig farms (Wathes et al., Reference Wathes1997). Ammonia is a respiratory and gastrointestinal irritant, and chronic exposure at exceptionally high concentrations (i.e. ⩾100 ppm) has been associated with increased risk of respiratory disease in pigs (Drummond et al., Reference Drummond, Curtis, Simon and Norton1980). Concentrations of atmospheric ammonia approaching or exceeding these levels are unrepresentative of modern pig farms (Wathes et al., Reference Wathes, Demmers, Teer, White, Taylor, Bland, Jones, Armstrong, Gresham, Hartung, Chennells and Done2004). However, far lower concentrations of aerial ammonia (5 to 10 ppm) have been associated with increased risk of pigs developing atrophic rhinitis (Hamilton et al., Reference Hamilton, Roe and Webster1996), though this disease is now controlled by vaccination rather than environmental manipulation. Given the choice between ammoniated and fresh air environments, pigs preferentially choose the latter and actively avoid atmospheres with an aerial ammonia concentration ⩾20 ppm (e.g. Jones et al., Reference Jones, Burgess, Webster and Wathes1996 and Reference Jones, Wathes and Webster1998; Wathes et al., Reference Wathes, Jones, Kristensen, Jones and Webster2002).
Chronic or acute exposure to high concentrations of ammonia (40 ppm) may interfere with or impair olfactory perception (Jones et al., Reference Jones, Wathes, Persaud, White and Jones2001) and thus alter perception of social cues and social behaviour. Hence, effective group formation may be constrained by chronically elevated levels of aerial ammonia. Again, however, these levels are somewhat higher than those typically reported in indoor commercial pig farms, and the effects of more commercially relevant levels are not well understood.
Forced ventilation and other mechanical systems in pig farms cause a high level of background noise; EC directive 91/630/EEC permits noise levels for pigs of up to 85 dB(A). Within the range of auditory frequencies pigs perceive (0.4 to 40 kHz; Heffner and Heffner, Reference Heffner and Heffner1989), noise pressure levels can reach 65 to 80 dB(A) in fattening units (Algers et al., Reference Algers, Eskebo and Stromberg1978; Talling et al., Reference Talling, Lines, Wathes and Waran1998a). Noise stimuli of this magnitude are not sufficiently aversive to pigs to control responding in an operant avoidance context (Stephens et al., Reference Stephens, Bailey, Sharman and Ingram1985). Despite the stressful nature of sudden, continuous, high or high pitched noise (Algers et al., Reference Algers, Eskebo and Stromberg1978; Spensley et al., Reference Spensley, Wathes, Waran and Lines1995; Talling, Reference Talling1996; McAdie et al., Reference McAdie, Foster and Temple1996; Talling et al., Reference Talling, Waran, Wathes and Lines1998b), it is plausible that pigs would habituate to constant background noise, even at levels approaching 85 dB (Talling, Reference Talling1996; Talling et al., Reference Talling, Waran, Wathes and Lines1998b). However, nursing sows can differentiate their own piglets from auditory stimuli (Blackshaw et al., Reference Blackshaw, Jones and Thomas1996), even in the absence of other (i.e. visual/olfactory) discriminative cues, and sound pressure levels (SPL) at or approaching, those reported may interfere with auditory communication and recognition (Algers, Reference Algers1984; Algers and Jensen, Reference Algers and Jensen1985). The ability of growing pigs to discriminate conspecifics using only auditory stimuli has also recently been shown (McLeman et al., Reference McLeman, Mendl, Jones and Wathes2008). However, the effects of chronically high levels of background noise on the perception and interpretation of porcine auditory social cues, and the potential for this to affect social interactions, remain to be elucidated.
The present experiment was designed to examine the effects of chronic exposure to LL intensity (∼40 lux 12 h: 12 h dark photoperiod), elevated ammonia (∼20 ppm 24 h atmospheric) and high background noise (∼80 dB(A) Leq24 h) on the social behaviour and social cognition of growing pigs. As well as examining the rest and activity patterns of groups of pigs, social behaviour was operationally defined as the frequency, nature and duration of social interactions, and social cognition as discrimination between pen-mates and unfamiliar conspecifics. The physiological and production and health responses of the pigs to the same environmental conditions are reported in an accompanying paper (O’Connor et al., Reference O’Connor, Parker, McLeman, Demmers, Lowe, Cui, Davey, Owen, Wathes and Abeyesinghe2010). We predicted that ammonia, LL and noise would interfere with social interactions, owing primarily to the disrupted transmission of olfactory, visual and auditory social cues, respectively. There are two mechanisms by which such interference can manifest: (i) damage to sensory receptors that may be transient or permanent; and (ii) interference with normal function by masking of the input signals. In addition, it is plausible that indirect effects of the environment on social behaviour may occur, for example, through reduced activity associated with environmental stress or via aversion to engaging in costly behaviour (such as fighting), in less than optimal environments. Interference with social interactions could potentially alter social stability within the group, and thus behaviour at the group level was also investigated through rest and activity patterns and cohesion.
Material and methods
Subjects, housing and husbandry
Two batches of 112 4-week-old hybrid gilts (50% Pietrain, 25% white Duroc, 12.5% Large White, 12.5% Landrace) were obtained at weaning from a commercial indoor pig farm (PIC, Carlisle, Cumbria, UK). The first batch was obtained in May 2008 and the second in September 2008. A further 14 pigs per batch were concurrently obtained to provide the same age and source stimuli for later testing. All pigs were tail-docked as part of normal commercial practice before their arrival at our facility. Each batch comprised is less than or equal to five piglets from each of up to 33 sows, such that experimental groups could be formed from unrelated animals. To ensure that littermates were randomly allocated to different treatments, each piglet was bilaterally ear-tagged with its allocated treatment number, individual ID and herd number before weaning. On arrival, piglets were also marked with stock marker on their backs (and weekly thereafter) to allow identification via room cameras. The mean weight of the pigs on arrival at the facility was 7.8 ± 0.1 kg and 7.3 ± 0.1 kg for the two batches, respectively (Pharmweigh Junior, Bury St. Edmunds, UK). On arrival, unrelated piglets were allocated, in groups of 14, to each of the eight treatment rooms (and one identical room of 14 pigs not participating in the study, but later used in social discrimination trials) with access to electrolyte solution (Pigilyte, Norbrook, UK) in cube drinkers. Environmental treatments (see below) were applied immediately. The stocking density of 14 pigs in each experimental room allowed 1.4 m2 of space per pig, complying with defra regulations (defra, 2007), which specify that pigs must have at least 0.15 m2 of unobstructed floor area when their average weight is 20 kg or less (as the pigs were at the start of the experiment) and 0.55 m2 if their average weight is greater than 50 kg, but less than or equal to 85 kg (as the pigs were at the end of the experimental period).
Pigs were habituated to human contact (‘gentled’), as a group, for 10 min/day, for the first week after arrival. This involved humans entering the rooms, sitting on the floor and allowing the pigs to explore them. This procedure was carried out in order to facilitate saliva sampling in the parallel study (O’Connor et al., Reference O’Connor, Parker, McLeman, Demmers, Lowe, Cui, Davey, Owen, Wathes and Abeyesinghe2010). The temperature was kept at the recommended level for pigs housed on straw (defra, 2007) commencing at 28°C on day 1 of the experiment and gradually falling to an average of 19.6 ± 0.05°C for batch one and 18.5 ± 0.06°C for batch two. Rooms were ventilated artificially at a minimum rate of six air changes per hour and soiled straw was removed and replenished with clean bedding daily. Fluorescent lighting was provided on a 12:12-h cycle of light/dark with lights on at 0730 h and a respective dawn and dusk period of 30 min, the light intensity of which was proportional to the treatment. Within each room, various loose and hanging materials (ropes, chains and drinker-pipe) were provided as enrichment. The pigs had ad libitum access to water and dry feed (A1 creep, Primary Classic, Delta wean 12, 35, 50; ABN, Peterborough, UK). They were reared for 15 weeks before transport to a commercial abattoir for slaughter. The live weight of the pigs at the end of the experimental period was (mean ±s.e.m.) 80.4 ± 0.6 kg (batch 1) and 81.9 ± 0.7 kg (batch 2). This work was regulated under the United Kingdom Animals (Scientific Procedures) Act (1986).
Experimental design
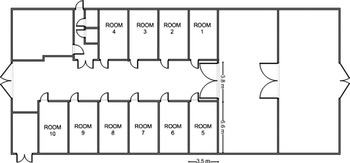
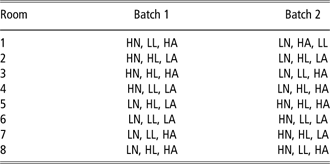
Eight rooms (3.5 m × 5.6 m; rooms one to eight, Figure 1) were allocated each to one of eight experimental treatments in a 23 multifactorial arrangement. The ninth room under low ammonia, high light (HL) and low noise conditions housed 14 pigs for later use in social discrimination trials, which were carried out in the tenth room. Table 1 shows the treatment allocation across batches. Each treatment comprised high or low levels of light intensity (nominally 200 v. 40 lux 12 h photoperiod), atmospheric ammonia concentration (nominally 20 v. <5 ppm, 24 h) and broadband noise, band pass filtered to approximate the spectrum of mechanical noise produced by the fans (nominal level 80 v. <60 dB(A) Leq24 h). The rooms were allocated at random with the restriction that, given the layout of the building (Figure 1) and the limited sound attenuation of its construction, all high noise treatments were restricted to one side of the building, different in each batch. This ensured maximum distance and minimum sound leakage between low noise and high noise treatments. Ammonia concentration and light intensity were controlled independently in each room; therefore, the levels of these factors were allocated randomly.
Building layout comprising rooms one to nine for animal accommodation. Rooms one to eight were treatment rooms, Room nine housed 14 pigs for social discrimination trials (kept in high light, low ammonia and low noise), and Room 10 was used for behavioural testing. The floor area of each room was 19.6 m2.

Treatment allocation across rooms and batches

HN = high noise (∼80 dB (A)); LL = low light intensity (<5 lux); HA = high ammonia (∼20 ppm); HL = high light (∼200 lux); LA = low ammonia (<5 ppm); LN = low noise (∼53 dB (A)).
Treatments
The values of the light and noise levels tested were chosen based on the current code of recommendations for the welfare of livestock: pigs (defra, 2007). As there is currently no legislation pertaining to ammonia levels, these were chosen to reflect typical commercial conditions (Groot Koerkamp et al., Reference Groot Koerkamp, Metz, Uenk, Phillips, Holden and Sneath1998). Full light surveys were conducted at the start of each batch; light intensities were measured using a calibrated hand-held light meter (Testo 545, Testo Ltd, Alton, UK) at nine equidistant points in each room to provide nominally 40 ± 5 lux and 200 ± 5 lux at 0.5 m from the floor, in agreement with current recommendations (defra, 2007). Spot checks of the light intensity at 0.5 m from the floor in the centre of each room were conducted five times a week throughout the trial using the same light meter. The mean light intensities for batch one were 41.54 ± 0.92 lux in the LL rooms and 172.04 ± 6.26 lux in the HL rooms. In batch two, the mean light intensity was 37.70 ± 1.31 lux in the LL rooms and 152.91 ± 5.83 lux in the HL rooms. Ammonia gas was supplied, prediluted with compressed air, to the air inlets of each of the elevated ammonia treatment rooms to ensure correct dosage of ∼20 ± 5 ppm, averaged over a 24-h period. Dosage via electronic mass flow controllers was manipulated using a feedback loop that adjusted the dosage rate based on the measured ventilation rate and the measured ammonia concentration (NOx chemiluminescence analyser: Thermo Scientific, Berkshire, UK, combined with stainless steel ammonia converters: Mattheus Milieu Techniek, Wageningen, The Netherlands). Control concentrations of <5 ppm of ammonia were maintained through rapid ventilation. Hand-held ammonia meters (Pac III, Dräger Safety Inc., PA, USA) were used as a further confirmation of atmospheric concentration across the rooms (ammonia concentrations: batch one, low 3.2 ± 0.1 ppm, high 18.0 ±0.4 ppm; batch two, low 3.7 ± 0.1 ppm, high 19 ± 0.3 ppm). For noise exposure, a custom built pink noise generator was used to re-create fan noise; its frequency distribution was shaped by a High Definition Dual 15 Band Precision Graphic Equalizer (ART, UT, USA) to approximate the spectrum of the ventilation system running at 100% capacity. This signal was fed to audio amplifiers (RMX850, QSC, CA, USA), high speakers and subwoofers (Electrovoice, MN, USA, models SX80 and SB122, respectively) located on the ceiling of each high noise treatment room. Dummy high speakers and subwoofers were constructed from high density foam and fixed in the same positions in the low noise rooms, both to minimise room differences and to control for any effects on air circulation. The SPL in each room was modulated separately via a sound level control system (AVC-D, Formula Sound, London, UK) to maintain a constant SPL of ∼80 ± 5 dB(A), such that extraneous variation from ventilation rate and ambient noise did not cause the SPL to exceed this target. The noise levels in the low noise rooms were determined by the ventilation system. Noise surveys were conducted in each room using a calibrated sound meter (Cirrus CR:831B Noise Meter, Cirrus Research plc., North Yorkshire, UK) shortly before the arrival of the pigs (SPLs: batch one, low 53.8 ± 3.3 dB(A), high 77.7 ± 0.4 dB(A); batch two, low 53.0 ± 0.7 dB(A), high 80.7 ± 0.4 dB(A)). With occupied rooms, actual SPLs were likely to have fluctuated slightly due to the noise created by the pigs.
Behavioural observations
Behavioural observations were carried out on recorded footage, which facilitated a detailed analysis and did not disturb the animals. A CCTV overhead camera system (Milestone XProtect Remote Client, Milestone Systems, Ripley, UK) was used to record behaviour in the rooms in two ways during the photoperiod 1 day/week: (i) a 20-s recording every 10 min 0730 to 1930 hfor scan sampling of activity, rest and synchrony; (ii) one 15-min recording for focal sampling of social interactions (1530 to 1545 h; this was selected on the basis of greatest activity in a pilot study with two groups of 14 pigs kept under high light, low ammonia and low noise conditions and identical lighting schedule). The purpose of behavioural observations was to investigate the effects of the physical environment on social behaviour at a group level (diurnal rest and activity patterns and group cohesion) and at an individual level through the frequency, nature and duration of social interactions.
Social interactions
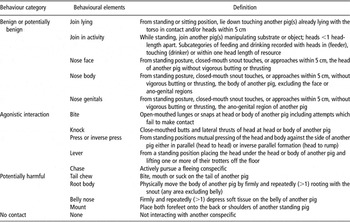
Focal sampling was conducted on the 15-min footage from 1 day/week over a 4-week period, commencing on the 6th day following weaning and mixing (at 4 weeks old). No entry to the rooms occurred during this time to ensure that the behaviour was undisturbed. Four focal individuals per group were selected at random, but thereafter remained the same across all sampling periods. Individuals were independently tracked for a 15-min period and all the social interactions that they initiated and received were recorded in respect of time of onset, duration, actor and recipient identities and recipient response(s). Before analysis, interactions between focal individuals were identified and adjusted such that each interaction was only represented once in the data set, to avoid pseudoreplication (this was only necessary for calculating the total number of social interactions observed). Behavioural elements were recorded for each focal animal according to an established ethogram (Jensen, Reference Jensen1980). These observations encompassed all physical contacts and were categorised as follows: actor: benign (or potentially benign), agonistic or potentially harmful (Table 2); respondent: benign, aggressive or submissive (head tilt/flee; see Table 3). The recipient response was recorded if it occurred within 5 s of the actor’s behaviour; if no change in recipient behaviour occurred within 5 s, this was recorded as ‘benign’ (see Table 3). Recipient responses allowed us to characterise the proportion of interactions that ended neutrally, with submission or with aggression. End times were recorded when actor behaviour ceased, that is, commencement of an alternative behaviour or when either an actor or recipient moved away, whichever came first. Play behaviour was examined separately as part of a parallel study (O’Connor et al., Reference O’Connor, Parker, McLeman, Demmers, Lowe, Cui, Davey, Owen, Wathes and Abeyesinghe2010) and was not considered for analysis here. Social interaction observations were carried out by two observers. The CCTV playback system was set up such that no discernible difference between the HL and LL rooms could be perceived on the video playback system so as to alert the observers to treatment allocations. Ten percent of the total number of observation sessions was scored by both observers to check for consistency, with respect to the frequency, nature and duration of social interactions; the agreement between the observers was within acceptable limits (α > 0.7).
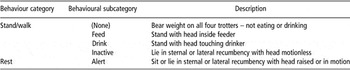
Behavioural states recorded during continuous sampling

Ethogram of response behaviour. If more than one response is evident, all responses occurring within 5 s of actor behaviour are recorded in the sequence in which they occurred

Activity, rest and group synchrony
We were interested in looking at the effects of the treatments on group synchrony, and conceptualised this (in a commercially relevant way) as the proportion of active animals that were contiguously feeding during the day (Hsia and Wood-Gush, Reference Hsia and Wood-Gush1983; Keeling and Hurnik, Reference Keeling and Hurnik1996). Further, tolerance of other animals during feeding in particular is likely to be consistent with group stability. Therefore, the proportion of scan sample points (n = 72/week) during which 50% or more of the pigs were active at any one time was examined for weeks 1, 2, 3, 4, 7 and 14. At each (10 min) interval, the number of pigs resting, lying or sitting alert, active (standing or walking), drinking or eating was noted (Table 4) in order to establish diurnal patterns of activity and rest.
Ethogram of activity recorded by scan sampling

Social discrimination testing
To examine effects on social discrimination without involving a labour-intensive and prolonged learning task (unfeasible within experimental constraints), a simple familiar v. unfamiliar preference test was employed (McLeman et al., Reference McLeman, Mendl, Jones and Wathes2008). From 9 weeks old (i.e. week 5 of the experiment), the four focal pigs from each environmental treatment were tested for social discrimination between one of their own pen-mates (excluding the other focals, each focal was assigned a unique stimulus pig) and an unfamiliar pig (one of the 14 pigs kept separately for this test; room nine; Figure 1). The trials were scheduled such that no stimulus pigs experienced more than three trials per day and were not used in successive tests. To determine chronic and acute treatment effects on simple discrimination, each treatment pig was tested under both their respective treatment conditions, as well as in low noise, HL and low ammonia (i.e. control conditions) in a counterbalanced order in consecutive weeks. The same familiar and unfamiliar stimuli were used in both tests to control for individual differences; thus, unfamiliar stimuli were only truly novel to the test pig in the first test. However, as the exposure was relatively brief and there were 7 days between tests one and two, the unfamiliar pig should have remained unfamiliar, relative to the familiar, group member. Each of the 14 pigs from the high light, low noise, low ammonia group was tested in high light, low noise and low ammonia, and one of the seven remaining treatment conditions (n = 2 per batch) in an otherwise identical manner, to establish any acute effects of physical environmental treatment conditions on social discrimination.
Tests were conducted in a separate test room (room 10; Figure 1) with identical dimensions to the home pens, but two stimulus stalls (1.75 m × 1.75 m), separated by a 1-m high solid barrier. The door of each stall, facing the test pig choice arena, held a wire-mesh viewing panel, positioned at pig height to allow reciprocal inspection. A small quantity of clean straw was placed in each stall before testing. For each test, the familiar stimulus pig and then the unfamiliar stimulus pig were independently herded from their respective home pens into the test room and placed into their allocated stimulus stalls. The side to which each stimulus pig was allocated was balanced between trials/treatments. Once the stimuli were in place, the test pig was herded into the test room and held in a starting pen (3.5 m × 1.5 m) for 15 min (regardless of treatment to control for the potentially confounding effects of time spent in an unfamiliar environment) to allow acclimatisation of all animals to the environmental conditions in the room (principally dictated by dark adaptation to LL intensity).
Following acclimatisation, the test pig was released into the preference arena through a drop-door in the centre of the room and allowed to roam freely for 5 min (following exit from the start box). Behaviour was remotely recorded via an overhead camera, triggered on release of the test pig using a micro-switch attached to the drop-door. Test pig latency to leave the start box, latency to visit each stimulus pig, number of visits, visit duration, total time spent near and total time seeking contact (ascertained by behaviour directed towards each stimulus-pig) were recorded.
Immediately following each trial, the pigs were individually herded back to their home pen (test animal, then familiar, then unfamiliar) to prevent inadvertent contact with another animal that might affect behaviour in subsequent test(s). The room was swept clean of straw and faeces and mopped with a solution of biological washing powder to remove any biological odours. Any areas of the stimulus pens and start box that had been touched by the test pig were also wiped down with this solution.
Data preparation and statistical analysis
Data were collated in Microsoft Excel (2000) and prepared for analysis. Social interaction data were organised into categories according to their frequency (all social interactions), nature (agonistic, submissive and benign) and whether they were performed by the actor or recipient, for each of the four focal pigs in each room. Data pertaining to the nature of social interactions were transformed into proportions of total bouts of each behavioural element to control for differences in total numbers of interactions between sessions. These measures were examined across the four observation weeks to ascertain any possible change across time either as a function of treatment or otherwise. (The CCTV system failed in the 2nd week of batch two and therefore observations from this week were missing from the analysis for batch two.) The ratios of benign/non-agonistic and submissive responses, as well as reciprocated aggression to initiated agonistic behaviour (all calculated as proportions of total aggressive acts), were examined again across weeks. Finally, the duration of each behavioural bout was determined. We were interested primarily in the duration of agonistic encounters, as once a stable social group is established, the duration of fight bouts should decrease as a function of time (Ewbank et al., Reference Ewbank, Messe and Cox1974). In addition, if the environmental conditions were affecting social signals, it was possible that submission signals were missed or misinterpreted leading to prolonged fight bouts.
Social discrimination was conceptualised as whether the pigs showed any choice preference for either the familiar or unfamiliar pig. This was specifically examined using the number of visits to each of the stimulus pigs (N vis) related to a discrete choice between the stimulus pigs, and the number of contact-seeking bouts observed (N seek) indicating persistence in seeking contact from a specific individual. Both choice values were calculated as:

such that a positive value represented a choice for the familiar pig, and a negative score indicated a choice for the unfamiliar pig. To confirm that they made a significant choice between the two stimulus pigs, the choice ratios of all test pigs were tested against 0, which would indicate that they made no choice (one sample t-test).
The frequency, nature and bout duration of all social interactions were analysed using either general or generalised linear mixed models (GLMM; SAS 9.2, SAS Institute, Cary, North Carolina, USA) with normal, binomial and log error distributions as appropriate. GLMMs partition variance in a response variable attributable to both fixed and random factors. Fixed effects are generally experimentally determined levels of a given factor where the interest lies in estimating the mean of each level, whereas random effects are factors where the interest lies in quantifying variation among them as opposed to between specific levels of each (Littell et al., Reference Littell, Milliken, Stroup, Wolfinger and Schabenberger2006; Bolker et al., Reference Bolker, Brooks, Clark, Geange, Poulsen, Stevens and White2009). The models were constructed with room and room*batch entered as a random factor to control for non-independence of pigs within rooms and rooms across batches. The fixed effects were ammonia, light and noise, as well as all two- and three-way interactions between these factors. Batch was also added into the model as a fixed effect for all response measures, but was only included as an interaction term to check for batch differences if the main effects were significant. In models where change over time was relevant, week was entered as a covariate (linearity was assumed in all cases). Degrees of freedom (d.f.) were calculated using the Kenward–Roger method, which is appropriate for unbalanced data with multiple random effects (Kenward and Roger, Reference Kenward and Roger1997). Wald-type adjusted F statistics were used to test null hypotheses, and least squares (LS) means output from the GLMMs was used to examine interactions.
The type-1 error rate for all main effects and interactions was specified at α = 0.05. All interactions and main effects greater than the specified α-level were sequentially dropped from the model using backwards elimination. Descriptive statistics are reported as means ± s.e., unless otherwise stated.
Results
General activity patterns and group synchrony
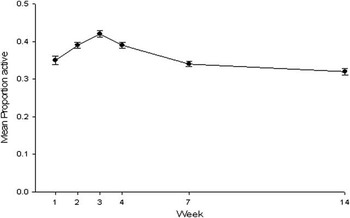
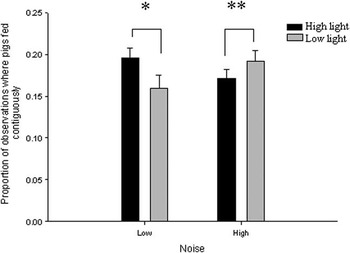
There was a main effect of week on activity over rooms (F 1,79 = 27.4, P < 0.01; Figure 2), with activity levels generally increasing over the first three weeks and decreasing thereafter. There were no main effects of any of the treatments on activity (all P s > 0.06). In terms of contiguous feeding, there were no significant main effects of week, light or noise (F s < 1). However, there was a small effect of ammonia, with active pigs in the elevated ammonia concentration showing less time involved in contiguous feeding (0.16 ± 0.008) than pigs in the low ammonia concentration (0.19 ± 0.008; F 1,12 = 4.9, P = 0.05). There was also a noise–light interaction (F 1,8 = 6.3, P = 0.04; Figure 3): when noise levels were low, pigs tended to eat together more in HL than in LL (LS means P = 0.03); however, when the noise levels were high, pigs tended to eat together more in LL than in HL (LS means P = 0.01).
Mean (±s.e.m.) proportion of pigs active (stand, walk, run, feed and drink) during the day across weeks, pooled across treatments.

Interaction between the effects of light and noise on the mean ( ± s.e.m.) proportion of pigs feeding contiguously. *P < 0.03; **P < 0.01.

Frequency of social interactions
There were no main effects for any of the treatments relating to the frequency of social interactions (all F s < 1), and nor were there any interactions between the treatments (P s > 0.05).
Nature of social interactions
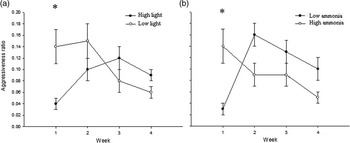
The nature of social interactions was assessed with relation to various aspects of aggression, submission and benign actions and responses. The mean proportion of encounters that were aggressive over the treatments and over the four observation weeks was 0.09 ± 0.007. There were small effects on aggression ratios for light, with pigs in LL (0.09 ±0.01) more aggressive than those in HL (0.08 ± 0.01; F 1,26 = 17.9, P < 0.01), and ammonia, with pigs in elevated ammonia concentration (0.09 ± 0.01) more aggressive than those in low ammonia concentration (0.08 ± 0.01; F 1,45 =17.3, P < 0.01), but not for noise level (F < 1). There was a significant week*light interaction (F 1,174 = 28.3, P < 0.01; Figure 4a); pigs in LL were initially more aggressive than those in high light. There was also a significant week*ammonia interaction (F 1,205 = 32.3, P < 0.01; Figure 4b); pigs were more aggressive in a high than a low ammonia concentration in the first week.
Change in mean (±s.e.m.) aggressiveness ratio (aggressive/total interactions) over the 4 weeks of observation according to light intensity (a) and ammonia levels (b). *P < 0.05.

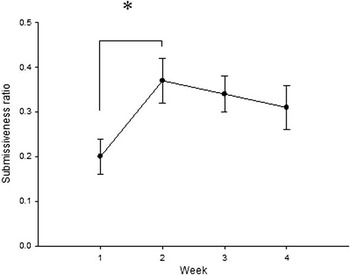
Submission ratios were calculated for all the animals as the ratio of submissive responses over all responses to aggressive acts (i.e. including aggressive or benign responses). There were main effects of time on submissiveness (F 1,207 = 3.83, P = 0.05; Figure 5), with a general increase between weeks one and two, which was thereafter relatively maintained, and of noise (F 1,14 = 4.65, P = 0.05), with pigs less submissive in a high (0.25 ± 0.03) than a low (0.36 ± 0.03) noise environment. There were no effects of light intensity (F 1,12 = 3.04, P = 0.1) or of ammonia concentration (F < 1). No interactions were found either across time or between treatments.
Mean (±s.e.m.) submissiveness ratio (proportion responses to aggressive interactions that were submissive as opposed to agonistic or benign) across the four observation weeks, across treatments. *P < 0.05.

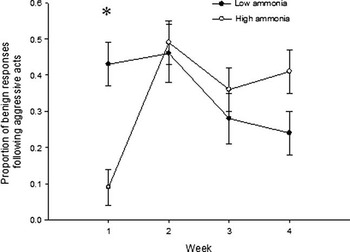
To investigate this further, we examined the equivalent response ratios (of total responses) of benign and aggressive responses to aggressive acts (i.e. reciprocated aggression). For the number of benign responses to aggressive acts, there were no main effects of week, light or noise (all F s < 1). However, there was a small effect of ammonia; pigs exposed to elevated ammonia (0.32 ± 0.03) showed a lower proportion of benign responses to aggressive acts than those in low ammonia (0.34 ± 0.03; F 1,202 = 17.9, P < 0.01). There was also a significant week*ammonia interaction, (F 1,209 =18.8, P < 0.01; Figure 6), characterized by pigs exposed to an elevated concentration of ammonia showing a lower proportion of benign response to aggressive acts in week 1.
Changes across weeks of mean (±s.e.m.) proportion of benign responses (of all possible responses) following aggressive acts in high v. low ammonia rooms. *P < 0.01.

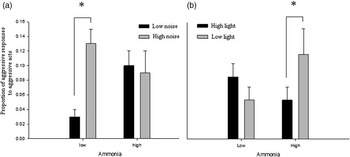
With respect to reciprocated aggression, we found no significant effect of week (F 1,210 = 2.6, P = 0.11), light intensity (F < 1), noise level (F 1,125 = 2.1, P = 0.15) or ammonia concentration (F 1,49 = 2.7, P = 0.11). However, there was a significant ammonia*noise interaction (F 1,47 =4.6, P = 0.04; Figure 7a), characterized by pigs exposed to a low ammonia concentration and a high noise level showing more reciprocated aggression than those in a low ammonia concentration and low noise level (LS means P < 0.05), but showing no difference in the elevated ammonia concentration, regardless of noise level (LS means P > 0.05). There was also an ammonia*light interaction (F 1,25 = 4.6, P = 0.04; Figure 7b), with pigs in an elevated ammonia concentration showing more reciprocated aggression when the light intensity was low (LS means P < 0.05), as compared to those in a low ammonia concentration, which showed no difference regardless of light intensity (LS means P > 0.05). Finally, we examined the proportion of aggressive responses of all responses to benign acts. There were no main effects of any of the treatments or week, and nor were there any significant interactions (F s < 1).
Interaction between ammonia and noise (a) and ammonia and light (b) for the mean (±s.e.m.) proportion of reciprocated aggression (of all recorded responses to aggression). *P < 0.05.

Duration of social interactions
The final measure of social interactions related to the duration of behavioural bouts as a function of treatment. The duration of positive bouts (benign behaviour) was excluded owing to pigs spending large proportions of time resting/sleeping, which artificially inflated the estimated bout durations. For this reason, we only analysed the duration of agonistic bouts of behaviour. In addition, this measure was more directly related to the research question, in that it would be predicted that pigs would display shorter aggressive bouts as a function of time. Bout duration of aggressive acts was entered into the model as the dependent measure. No main effects were found for any of the treatments (all F s < 1) or for week (F 1,145 = 2.2, P = 0.14); there were no significant interactions (F s < 1), suggesting that the duration of aggressive bouts was not affected by treatment, and nor did it change as a function of time.
Social discrimination
Pigs in all treatments showed no overt preference for familiar v. unfamiliar pigs (F < 1). To account for differences between individuals in social motivation, we altered the choice equation to show whether any discrimination had been made, that is, any specific preference for either of the stimulus pigs, regardless of whether they were familiar or unfamiliar. The two outcomes (N vis and N seek) were intercorrelated (ρ = 0.58, P < 0.01), suggesting that pigs persisted in seeking contact with the individual that it visited most. For N vis, the choice value was significantly different from zero (0.16 ± 0.02; one sample t-test, T 115 = 11.9, P < 0.01), indicating that the pigs were making a choice.
There was no main effect of test context (i.e. low noise, high light, low ammonia v. individual pigs’ treatment conditions; F < 1), but there was a significant main effect of light on N vis (F 1,114 = 4.5, P = 0.04) with pigs kept under HL (0.32 ± 0.04) showing greater discrimination than those kept in LL (0.26 ± 0.03). There were no other treatment effects or interactions (P s > 0.3). For N seek, there were no main effects of test context, light, ammonia concentration or noise level (P s > 0.08), and nor were there any significant interactions (P s > 0.3). No significant effects were found with respect to the acute effects of the treatments.
Discussion
The purpose of this multifactorial experiment was to establish the effects of commonly experienced, commercially relevant levels of ammonia, light and background noise on the frequency, nature and duration of social behaviour and social interactions of growing pigs. The study uncovered a number of findings relating to the environmental treatments, including a number of null findings that are somewhat at variance with current anecdotal and theoretical positions.
Pigs exposed to elevated ammonia concentration (20 ppm) showed higher rates of aggression, particularly in the early part of the experimental period. Those at a low ammonia concentration showed no significant change over time. This was specifically related to initiated aggressive acts; pigs in the ammoniated rooms did not show any increase in reciprocated aggression (responses), compared with other treatments, except when the light intensity was low. In fact, pigs kept in a high ammonia concentration showed a lower proportion of benign responses to aggressive acts (again primarily in the 1st week), and the ammoniated atmosphere did not appear to have any effect on submissiveness. At a group level, pigs exposed to ammonia showed marginally less group synchrony than those kept at a lower concentration. Taken together, these results suggest that exposure to an ammoniated atmosphere of ∼20 ppm made the pigs less tolerant of conspecifics. This may have implications for hypothesised alterations in social strategy in larger group sizes (Pagel and Dawkins, Reference Pagel and Dawkins1997; Turner et al., Reference Turner, Horgan and Edwards2001), potentially constraining behavioural flexibility.
Ammonia is known to be aversive to pigs, though in a previous study, pigs’ avoidance of ammoniated environments was delayed, even at high concentrations (up to 40 ppm; Wathes et al., Reference Wathes, Jones, Kristensen, Jones and Webster2002), suggesting that its effects may not immediately be perceived. An explanation for the adverse effects of ammonia exposure in this study may relate to disruption of the transmission of normal social cues between conspecifics, possibly through effects on olfactory perception. Pigs use olfactory and visual cues to signal aggression (Jensen, Reference Jensen1982; McGlone, Reference McGlone1985) and are able to use olfaction for group-mate recognition (McLeman et al., Reference McLeman, Mendl, Jones and Wathes2008). Ammonia may affect odour discrimination due to damage to olfactory receptors (Done et al., Reference Done, Gresham, Chennels, Williamson, Wathes, Demmers, Taylor and Armstrong2002a, Reference Done, Gresham, Chennels, Williamson, Wathes, Demmers, Taylor, Armstrong, Hicks and Terry2002b and Reference Done, Gresham, Chennels, Williamson, Wathes, Demmers, Taylor, Armstrong and Hunt2002c). Though it was not possible to examine the olfactory epithelium in this study, the levels of ammonia examined were unlikely to result in damage to receptors. A more likely explanation is the masking by ammonia of immediate odour cues (Jones et al., Reference Jones, Wathes, Persaud, White and Jones2001; Kristensen et al., Reference Kristensen, Jones, Schofield, White and Wathes2001), thereby affecting the perception of behavioural intention and group stability. The higher levels of submission and lower levels of benign (i.e. the latter indicating tolerance) responses to aggression observed in the ammonia group also support this assumption.
We found no measurable effect of ammonia on social recognition in the discrimination trials, perhaps because social motivation was elevated in the novel environment. However, our parallel experiment, using the same animals, showed that pigs from the ammoniated rooms had lower salivary cortisol and larger adrenal glands than pigs from the non-ammoniated rooms, suggesting a generalised stress response to 20 ppm ammonia (O’Connor et al., Reference O’Connor, Parker, McLeman, Demmers, Lowe, Cui, Davey, Owen, Wathes and Abeyesinghe2010). How this relates specifically to increased aggression is not clear. In line with these physiological stress indicators (and the early effects of ammonia on behaviour in this study), O’Connor et al. (Reference O’Connor, Parker, McLeman, Demmers, Lowe, Cui, Davey, Owen, Wathes and Abeyesinghe2010) also found that pigs kept in ∼20 ppm ammonia were initially less playful (non-social) than those in lower concentrations, suggesting a depression in energetic activities indicative of stress or possibly a shift in energetic behavioural activity away from play to aggression. It seems likely that the ammonia treatment was initially stressful for the pigs, either directly, that is, by causing physical discomfort (which might subsequently influence social behaviour), or indirectly, that is, by affecting olfactory cues (which might impose social stress). It was not possible, given the constraints of this study, to examine the mechanisms by which this apparent interaction manifested and future research on the chronic and developmental effects of ammonia on pigs may help to elucidate this. As the social interaction data reported in this paper refer only to the first 4 weeks following mixing, we can only speculate about what happened thereafter. However, when these results are considered in conjunction with those of O’Connor et al. (Reference O’Connor, Parker, McLeman, Demmers, Lowe, Cui, Davey, Owen, Wathes and Abeyesinghe2010), they suggest that the pigs adapted to the ammoniated conditions and that the effects of ammonia over the entire treatment period ameliorated, despite an initial adverse effect.
LL intensity also affected the social behaviour of the pigs, increasing the overall levels of aggression. As with the ammonia treatment, the effects of light intensity were transient, with pigs in LL intensity showing increased aggression relative to higher light in the early stages of the experiment only. As pigs show no specific aversion to LL (Taylor et al., Reference Taylor, Prescott, Perry, Potter, Le Sueur and Wathes2006), and evidence suggests that aggressive cues are processed visually as well as via olfaction (Jensen, Reference Jensen1982), the most likely interpretation of these data is that LL intensity interfered with discrimination of visually mediated social cues, resulting in an increase in aggressive interactions. The change in aggressiveness as a function of time suggests that this may have been particularly accentuated in the 1st week following mixing. Our findings indicated that LL intensity may also have exacerbated the effects of ammonia resulting in more reciprocal aggression. Further, and in support of visual interference, pigs kept in LL intensity showed less discrimination between familiar and unfamiliar pigs than those housed in higher light intensity. McLeman et al. (Reference McLeman, Mendl, Jones and Wathes2008) showed that pigs could be flexible in their sensory discrimination of conspecifics, and as such our data are suggestive of a preferred use of visual cues in our discrimination context. Regrettably, it was not possible within the constraints of this study to examine eye morphology. Light intensity interacted with noise level in respect of group synchrony: when noise levels were high, pigs in HL intensity showed less group synchrony than pigs in LL intensity. The reasons for this are unclear, but may again be indicative of trade-offs between perceptual cues as a function of the context in which the animals were housed (McLeman et al., Reference McLeman, Mendl, Jones and Wathes2008).
With respect to bout duration of social interactions, there were no treatment effects or interactions. Our expectation was that if interference in transmission of social cues occurred, behavioural bouts may increase as attempts to convey social information that might terminate interaction might be missed (e.g. submissive cues). Further, cues that might initiate interaction may be repeated until a response was obtained. Our findings, however, suggest that alterations in the frequency and nature of interactions in this context proved more sensitive indicators of social behavioural change.
High noise had less pronounced effects on pigs’ social behaviour than the other conditions. High levels of noise decreased the proportion of submissive responses to aggressive acts and increased the levels of reciprocated aggression, but only when ammonia concentration was low. Pigs are able to discriminate conspecifics using only auditory cues, albeit not as successfully as when using visual or olfactory cues (McLeman et al., Reference McLeman, Mendl, Jones and Wathes2008). It seems unlikely in this instance, however, that the high background noise was directly interfering with social communication or discrimination as it would be expected that this would have resulted in main effects of noise for the other measures. The effects observed are clearly subtle, and further work may be necessary to provide satisfactory explanation. However, a slight increase in irritability is plausible: certainly, constant noise is known to disrupt the quality of rest (Eberhardt, Reference Eberhardt1988).
In this and the parallel study (O’Connor et al., Reference O’Connor, Parker, McLeman, Demmers, Lowe, Cui, Davey, Owen, Wathes and Abeyesinghe2010) we were able to examine and, to some extent, disentangle the main effects (and the effects of combinations) of environmental conditions at commercially relevant levels on behaviour, physiology, health and production. Though more detailed information requires a precise analysis of singular factors, knowledge of combinations of environmental factors experienced by production animals may benefit from the type of investigation we have adopted. As conditions such as those tested here are not experienced in isolation, the knowledge generated from multifactorial studies of this kind can be of great value. In order to observe treatment effects in our study, we necessarily minimised the influences of extraneous and potentially confounding factors (such as humidity, subclinical disease, etc.) other than those under investigation and these were maintained at optimal levels. Thus, it is conceivable that additional challenges to stock experienced in practice may exacerbate the effects we have observed.
In conclusion, the results of this study extend current knowledge on social behaviour in growing pigs. There is now evidence for both farmers and policy makers that although performance measures are largely unaffected (O’Connor et al., Reference O’Connor, Parker, McLeman, Demmers, Lowe, Cui, Davey, Owen, Wathes and Abeyesinghe2010), commonly experienced concentrations of ammonia (⩾20 ppm) and LL intensities (⩽40 lux) can affect aggression in pigs, and are associated with stress, particularly in the critical weeks following mixing. Although further work is required to confirm underlying mechanisms, it is likely that increases in aggression in these environments occur through impeding vital social cues, and the findings reported here may have implications for the short-term welfare of farmed pigs.
Acknowledgements
This work was funded by the BBSRC. We are also grateful to staff at the RVC Biological Services Unit for animal husbandry as well as PIC and their associated farms for their help with preparing for this study.