Pubertal maturation is neither unitary nor uniform. There are actually multiple pubertal processes that occur in different people—and within the same person—at different ages and rates of development (Dorn, Dahl, Woodward, & Biro, Reference Dorn, Dahl, Woodward and Biro2006; Styne & Grumbach, Reference Styne, Grumbach, Pfaff, Arnold, Etgen, Fahrbach and Rubin2002). This variation is not an isolated phenomenon, moreover, but part of a larger developmental continuum. At early points on the continuum are upstream developmental factors and processes (e.g., nutritional history, energetic expenditures, family conflict, and cohesion) that influence the timing and tempo of puberty (reviewed in Ellis, Reference Ellis2004). At later points on the continuum are the downstream consequences of this variation, consequences that have substantial social and biological implications.
Epidemiologic evidence from ethnically diverse populations indicates that early-maturing girls, relative to their on-time or later developing peers, are at elevated risk for a variety of negative physical and mental health outcomes, including unhealthy weight gain, early initiation of substance use, early sexual initiation and pregnancy, emotional and behavioral problems, and mortality from cardiovascular disease and breast cancer (Bratberg, Nilsen, Holmen, & Vatten, Reference Bratberg, Nilsen, Holmen and Vatten2007; Colditz & Frazier, 1999; Deardorff et al., Reference Deardorff, Hayward, Wilson, Bryson, Hammer and Agras2007; Deardorff, Gonzales, Christopher, Foosa, & Millsap, Reference Deardorff, Gonzales, Christopher, Roosa and Millsap2005; Dick, Rose, Viken, & Kaprio, Reference Dick, Rose, Viken and Kaprio2000; Golub et al., Reference Golub, Collman, Foster, Kiimmel, Rajpert-De Meyts and Reiter2008; Jacobsen, Oda, Knutsen & Fraser, Reference Jacobsen, Oda, Knutsen and Fraser2009; Kelsey, Gammon, & John, Reference Kelsey, Gammon and John1993; Lakshman et al., Reference Lakshman, Forouhi, sharp, Luben, Bingham and Khaw2009; Vo & Carney, Reference Vo and Carney2007). This is particularly concerning given the ongoing trend toward younger age of breast development and menarche among girls in the United States (Euling et al., Reference Euling, Herman-Giddens, Lee, Selevan, Juul and Sorenson2008).
Beyond the effects of pubertal timing, pubertal tempo, which is the rate at which adolescents progress through puberty, has also been implicated in development of psychopathology and physical health problems. Changing levels of exposure to steroid hormones underpin changes in pubertal tempo, with associated emotional and behavioral sequelae (Parry & Newton, Reference Parry and Newton2001). A fast pubertal tempo not only causes maturational events to occur sooner, but may itself be psychologically challenging. Periods of faster pubertal maturation and rapid hormonal changes, including punctuated development of secondary sexual characteristics, negatively affect mood and adjustment in adolescents (Buchanan, Eccles, & Becker, Reference Buchanan, Eccles and Becker1992; Ge et al., Reference Ge, Kim, Brody, Conger, Simons and Gibbons2003; Slap, Khalid, Paikoff, & Brooks-Gunn, Reference Slap, Khalid, Paikoff and Brooks-Gunn1994; Warren & Brooks-Gunn, Reference Warren and Brooks-Gunn1989). In addition to the challenges of fast pubertal tempo, slow sexual maturation may also augment risk. Although research on physical health outcomes is limited, there is reason to believe that slowing of pubertal tempo may extend the window of vulnerability for breast carcinogenesis, given prolonged exposure to endogenous hormones during this period of high mammary cell proliferation and differentiation (Stoll, Vatten, & Kvinnsland, Reference Stoll, Vatten and Kvinnsland1994).
These links between the timing and tempo of puberty and psychiatric and biomedical outcomes underscore the need to delineate the life experiences and pathways that influence pubertal maturation. This delineation would have great relevance to the long-term goal of informing early intervention and prevention strategies for high-risk youth. Toward this end, the current study, which was guided by evolutionary models of reproductive development and biological sensitivity to context (BSC), examined the interactive effects of early family environments and psychobiologic reactivity to stress on timing and tempo of puberty. In addition, this paper advances a new methodological approach to assessing pubertal tempo using growth curve analysis.
An Evolutionary–Developmental Model of Pubertal Maturation
An important framework for analyzing psychosocial influences on pubertal processes is Belsky, Steinberg, and Draper's (1991) evolutionary theory of reproductive development, which focuses on the role of familial and ecological stressors in accelerating pubertal maturation. Drawing on life history theory in evolutionary biology, the theory posited that “a principal evolutionary function of early experience—the first 5–7 years of life—is to induce in the child an understanding of the availability and predictability of resources (broadly defined) in the environment, of the trustworthiness of others, and of the enduringness of close interpersonal relationships, all of which will affect how the developing person apportions reproductive effort” (p. 650). Belsky et al. theorized that humans have evolved to be sensitive to specific features of their early childhood environments, and that exposure to different environments biases children toward the development of different reproductive strategies. Ecological stressors in and around the family (e.g., scarcity or instability of resources) create conditions that undermine parental functioning and lower the quality of parental investment (such as by escalating marital conflict, increasing negativity and coercion in parent–child relationships, and reducing positivity and support in parent–child relationships). The theory posits that children respond to these familial and ecological contexts by developing in a manner that speeds pubertal maturation (i.e., provokes earlier onset of puberty or faster pubertal tempo leading to more advanced pubertal development at earlier ages), accelerates sexual activity, and orients the individual toward relatively unstable pair bonds. In contrast, children whose experiences in and around their families are characterized by relatively high levels of support and stability are hypothesized to develop in the opposite manner (Belsky et al., Reference Belsky, Steinberg and Draper1991). Either way, the theory postulates that children adaptively adjust pubertal development to match local conditions.
In a comprehensive review of the literature on Belsky et al.'s (1991) model, Ellis (Reference Ellis2004, p. 935–936) concluded, “Empirical research to date has provided reasonable, though incomplete, support for the theory.” The most reliable empirical phenomenon, documented across a number of methodologically sound studies, is that greater parent–child warmth and cohesion forecasts later pubertal development in girls (prospective, longitudinal studies: Ellis & Essex, Reference Ellis and Essex2007; Ellis, McFadyen-Ketchum, Dodge, Pettit, & Bates, Reference Ellis, McFadyen-Ketchum, Dodge, Pettit and Bates1999; Graber, Brooks-Gunn, & Warren, Reference Graber, Brooks-Gunn and Warren1995; Steinberg, Reference Steinberg1988; cross-sectional or retrospective studies: Kim & Smith, Reference Kim and Smith1998; Kim, Smith, & Palermiti, Reference Kim, Smith and Palermiti1997; Miller & Pasta, Reference Miller, Pasta, Rodgers, Rowe and Miller2000; Romans, Martin, Gendall, & Herbison, Reference Romans, Martin, Gendall and Herbison2003; Rowe, Reference Rowe, Rodgers, Rowe and Miller2000). Although less consistently documented in the literature, an emerging body of research also suggests that harsh parenting, paternal social deviance, and child maltreatment predict earlier pubertal development in daughters (Belsky et al., Reference Belsky, Steinberg, Houts, Friedman, DeHart and Cauffman2007; Costello, Sung, Worthman, & Angold, Reference Costello, Sung, Worthman and Angold2007; Tither & Ellis, Reference Tither and Ellis2008). Although these effects have proven replicable, effect sizes have been consistently small, with standardized regression coefficients typically around .20 or less.
BSC
These small overall effects sizes (i.e., main effects) may reflect that the children differ in whether, how, and how much they are affected by rearing experiences (reviewed in Belsky, Reference Belsky, Ellis and Bjorklund2005; Belsky & Pleuss, Reference Belsky and Pluess2009; Boyce & Ellis, Reference Boyce and Ellis2005; Obradović & Boyce, Reference Obradović and Boyce2009). Evolutionary–biological models posit that variation in susceptibility to environmental influence has been maintained by natural selection (Belsky, Reference Belsky, Ellis and Bjorklund2005; Boyce & Ellis, Reference Boyce and Ellis2005; Ellis, Jackson, & Boyce, Reference Ellis, Jackson and Boyce2006; Wolf, van Doorn, & Weissing, Reference Wolf, van Doorn and Weissing2008). An implication of this differential susceptibility, as articulated by Belsky (Reference Belsky, Rodgers, Rowe and Miller2000), is that the small main effects of parenting processes on pubertal timing may overestimate the impact of family environments in some children (low susceptibility, more fixed reproductive development) and underestimate it in others (high susceptibility, more plastic reproductive development). Boyce and Ellis (Reference Boyce and Ellis2005) have proposed that exaggerated autonomic and adrenocortical responses to psychosocial stressors may reflect a heightened biobehavioral susceptibility to environmental influences, or BSC. As measured in standardized laboratory assessments of stress reactivity, children displaying high BSC appear to have higher levels of mental and physical morbidities under harsh or stressful conditions but unusually low levels within supportive and protective conditions (Boyce & Ellis, Reference Boyce and Ellis2005; Obradović & Boyce, Reference Obradović and Boyce2009). The current research tests the hypothesis that the effects of family environment on pubertal timing and tempo will depend on (be moderated by) BSC. Specifically, we predict that the link between more supportive parent–child relationships and later/slower pubertal maturation will be stronger in children who display greater BSC.
A variety of studies, employing diverse designs and methods of operationalizing individual susceptibility, have emerged in recent years offering empirical support for a theory of BSC. As reviewed by Ellis, Boyce, Belsky, Bakermans-Kranenburg, and van IJzendoorn (Reference Ellis, Boyce, Belsky, Bakermans-Kranenburg and van IJzendoorn2011 [this issue]), the earlier work of Boyce, Ellis, and colleagues formed a provisional empirical foundation for the BSC theory and provided explicit tests of its defining hypothesis. Further work has expanded on this evidentiary basis by testing the differential susceptibility hypothesis in longitudinal and experimental designs. Thus, for example, Quas, Bauer, and Boyce (Reference Quas, Bauer and Boyce2004) used a random assignment design to examine the effects of cortisol reactivity and the supportiveness of the interviewer on the capacity of 4- to 6-year-olds to recall details of a fire alarm exposure 2 weeks prior. Relative to children with low hypothalamic–pituitary–adrenocortical (HPA) reactivity, children showing heightened cortisol responses to a set of standardized stressors had poorer memories for the exposure event when questioned by a nonsupportive interviewer but better memories when interviewed supportively. In a longitudinal test of the biological sensitivity theory, Boyce and colleagues (2006) studied degree of father involvement and maternal depression in infancy, autonomic reactivity at age 7 years, and presyndromal mental health outcomes at age 9. Among children with uninvolved fathers in infancy, the highest mental health symptom severity scores were found among 9-year-old children with depressed mothers and high autonomic reactivity, whereas the lowest scores were observed in those with low maternal depression and high reactivity. Finally, Obradović, Bush, Stamperdahl, Adler, and Boyce (Reference Obradović, Bush, Stamperdahl, Adler and Boyce2010) recently reported that parasympathetically reactive children showed either the lowest or highest rates of prosocial behavior in the context of kindergarten classrooms, depending upon the level of contextual adversity sustained at home. Taken together, these targeted extensions of evidence, using more advanced, noncross-sectional designs, offer deeper support for the BSC hypothesis. Extant research has been limited, however, by a focus on development of syndromal or presyndromal psychopathology rather than on normal developmental processes. The current research thus adds to the literature by examining the role of BSC in moderating a normative developmental outcome (puberty) with implications for health.
Assessment of Pubertal Tempo and Timing
Variation in timing of puberty is characterized by wide individual differences, such that the first signs of puberty may be evident anywhere between 7–13 and 9–13 years of age in girls and boys, respectively (Styne & Grumbach, Reference Styne, Grumbach, Pfaff, Arnold, Etgen, Fahrbach and Rubin2002). Pubertal tempo, or maturational velocity, also varies widely across individuals. Although it takes 4 years on average to advance to adultlike breast development, this interval may range from 1.5 to over 6 years (Marshall & Tanner, Reference Marshall and Tanner1969). Most boys will advance from childlike to adultlike genital development in 3 years, but again there is a wide range from 1.5 to over 4.5 years, depending on the child (Marshall & Tanner, Reference Marshall and Tanner1970).
Although pubertal tempo has been measured in a variety of ways, what is common to the different methods of assessment is derivation of a score that represents how long it takes to complete pubertal development (or some portion thereof). One such method gauges the length of time between when an individual first exhibits signs of pubertal onset until full development (e.g., Tanner Stage 2–5; Biro et al., Reference Biro, Huang, Crawford, Lucky, Striegel-Moore and Barton2006). Alternatively, for girls, tempo has been assessed by calculating the time span from pubertal onset to peak height velocity, attainment of adult height, or menarche (e.g., Llop-Vinolas et al., Reference Llop-Viñolas, Vizmanos, Closa Monasterolo, Escribano Subías, Fernández-Ballart and Martí-Henneberg2004; Pantsiotou et al., Reference Pantsiotou, Papadimitriou, Douros, Priftis, Nicolaidou and Fretzayas2008). Duration of puberty for boys has been assessed using the time period from attainment of testicular volume of 4 ml to final height (Bundak et al., Reference Bundak, Darendeliler, Gunoz, Bas, Saka and Neyzi2007). Maturational velocity has also been measured by simply calculating the difference in an individual's pubertal stage at two identified points in time (e.g., Laitinen-Krispijn, van der Ende, Hazebroek-Kampschreur, & Verhulst, Reference Laitinen-Krispijn, Van der Ende, Hazebroek-Kampschreur and Verhulst1999; Slap et al., Reference Slap, Khalid, Paikoff and Brooks-Gunn1994).
An inherent limitation of these time-based measures is that pubertal tempo is indexed as a single score; however, the velocity of pubertal maturation may vary substantially within individuals, with different, even opposite, tempos characterizing earlier versus later stages of pubertal development (Marshall & Tanner, Reference Marshall and Tanner1969, Reference Marshall and Tanner1970). Such complexity can be modeled, however, through growth curve analysis. Our principal analytic goal was to examine timing and tempo of puberty, taking several issues into account: (a) individuals initiate puberty at different ages; (b) individuals proceed through puberty at different rates of development; (c) there may be intraindividual differences in rates of pubertal maturation, such that individuals who advance quickly through one stage may advance slowly through other stages; and (d) the components of puberty (i.e., breast/genital and pubic hair) may develop at different times and rates for different individuals.
Consider the central hypothesis in the current research: children who experience high levels of psychosocial stress in and around their families and are biologically sensitive to context (designated as our “first target group”) will have a faster initial tempo of puberty than their peers and attain more advanced levels of pubertal development at earlier ages; conversely, children who experience high levels of nurturance and support in and around their families and are biologically sensitive to context (designated as our “second target group”) will display the opposite pattern of pubertal development. To test this hypothesis in a sophisticated manner that engaged the four issues enumerated above, we employed a piecewise (two-part) growth curve model of pubertal development (as explained in the Results Section).
The growth model was applied to both overall development and breast/genital and pubic hair development separately. The first slope captured development prior to age 12.5 (initial pubertal tempo) and the second slope captured development after age 12.5 (subsequent pubertal tempo). Although our hypothesis only targeted initial pubertal tempo, we present results for both initial and subsequent tempo to demonstrate the utility of the piecewise approach. In terms of the first slope, the growth curve analysis enabled us to examine whether our first target group, relative to other participants, had earlier onset of puberty but similar initial pubertal tempo, thus maintaining a more advanced level of pubertal maturation through age 12.5; had earlier onset of puberty but slower initial tempo, thus decelerating to a comparable level of maturation by age 12.5; had the same onset of puberty and a similar initial tempo, thus maintaining comparable levels of maturation through age 12.5; or had the same onset of puberty but faster initial tempo, thus accelerating to a more advanced level of maturation by age 12.5. In terms of the second slope, this allowed us to address the analogous set of questions in relation to subsequent pubertal tempo and offset of puberty. Finally, the growth curve model enabled to us to simultaneously ask the matching, reciprocal set of questions in relation to our second target group. In total, compared with extant measures of pubertal tempo, the present application of growth curve modeling enables a much more detailed analysis of intra- and interindividual differences in pubertal development, and thus more precise and fine-grained hypothesis testing.
Goals of the Current Research
The results from the Wisconsin Study of Families and Work (WSFW; see Hyde, Klein, Essex, & Clark, Reference Hyde, Klein, Essex and Clark1995) are of particular relevance to the current research; they indicate that higher quality parent–child relationships in preschool (more parental warmth and family positivity, less parent–child stress and conflict) forecast lower levels of pubertal maturation by daughters in the fifth grade (Ellis & Essex, Reference Ellis and Essex2007). Although this association proved robust against covariate adjustment, the unique effect of parent–child relationships on puberty was relatively small (β = −0.22), after controlling for mother's age at menarche, socioeconomic status, and body mass index. The current study (a) longitudinally extends Ellis and Essex (Reference Ellis and Essex2007) by examining timing and tempo of pubertal development through the ninth grade, (b) increases the specificity of the analyses by examining breast/genital and pubic hair development separately, (c) expands the research by including both boys and girls and testing for sex differences, and (d) tests whether the documented effect of parent–child relationships on puberty is moderated by BSC. The prediction is that this effect will be stronger in more sensitive children. To our knowledge, this is the first study to apply growth curve modeling to puberty, to examine psychosocial antecedents of pubertal tempo, or to test for the moderating effects of stress physiology on relations between family environments and pubertal development.
Method
Participants
The children in this study represent a subset of those participating in an ongoing longitudinal study of child development, the WSFW (Hyde et al., Reference Hyde, Klein, Essex and Clark1995). The original sample comprised 570 women and their partners recruited during the second trimester of pregnancy from obstetric/gynecology clinics and a low-income clinic in Milwaukee (80% of sample) and Madison (20%). We attempted to recruit as diverse a sample as possible in regard to ethnic heritage and social class, subject to the constraints that mothers and fathers had to be cohabiting when recruited, and obtaining prenatal care. Families were excluded if women were age 18 or under, unemployed, a student, or disabled. At initial recruitment (pregnancy), 95% of the 570 couples were married, 89% were Caucasian, mothers' average age was 29.4 years (range = 20–43), and fathers' average age was 31.3 years (range = 20–55). Mothers and fathers each had an average of 15 years of education (ranging from less than high school to professional degree); annual family income ranged from $7,500 to over $200,000 (median = $45,000). Thirteen waves of data have been collected from pregnancy through adolescence. The present study relies primarily on the preschool data collections (Time 6 and Time 7, ages 3.5–5.2 years) for assessing the family environment, the first grade data collection (Time 9, ages 6.8–7.8 years) for assessing children's biological reactivity to psychological stressors, and data collections in Grades 3–9 (Time 10–Time 13, ages 8.6–16.5 years) for assessing pubertal development.
The present analyses are based on a subsample of 120 children that were selected from the first cohort of the WSFW in the summer following the first grade to participate in an intensive substudy to develop the MacArthur Assessment Battery for Middle Childhood (Boyce et al., Reference Boyce, Essex, Woodward, Measelle, Ablow and Kupfer2002). Because we wanted a balance of “high” and “low” symptom children for the substudy, we employed a broad definition to classify all WSFW kindergarteners as “high symptoms” if they were in the upper 20% of either internalizing or externalizing problems as reported by either mothers or teachers and “low symptoms” otherwise. This resulted in an approximately equal number of children classified as high symptoms and low symptoms. The subset of 120 children was randomly selected from each of these two symptom groups to be representative of the larger sample. Thus, there were no statistically significant differences between the demographic profiles of these 120 families and the remainder (450) of the 570 original families. Of the subset of 120 families, 114 had puberty scores for at least one assessment period between third and ninth grade. All subsequent analyses are based on a total of 114 families (67 girls).
Quality of parent–child relationships: Preschool
A factor analytically derived measure of parent–child relationship quality (parental supportiveness; fully described in Ellis & Essex, Reference Ellis and Essex2007) was used as the main index of family environment. Based on preschool maternal interviews, the measure incorporated parental depression (Center for Epidemiological Studies, Depression Scale; Radloff, Reference Radloff1977), family negativity and positivity (Family Expressiveness Questionnaire; Halberstadt, Reference Halberstadt1986, Reference Halberstadt, Feldman and Rime1991), marital compatibility and conflict (Partner Role Quality Scale; Barnett and Marshall, Reference Barnett and Marshall1989), parental security (Parenting Stress Index; Abidin, Reference Abidin1986), parental negativity–dissatisfaction and positivity–warmth (from the Parenting Stress Index and the Child-Rearing Practices Report; Block, Reference Block1965), and authoritarian and authoritative parenting styles (Child-Rearing Practices Report). These 10 scales were combined using principle components analysis, and then component scores were saved. The first of the two extracted components (α reliability = 0.79) clearly indexed parent–child supportiveness and authoritative parenting, with high structure loadings on parental negativity–dissatisfaction (−0.76), warm–positive parental behavior (0.74), authoritative–democratic parenting style (0.74), parental insecurity (−0.72), and family positivity (0.62). This first component was employed as the measure of parental supportiveness.
BSC: First grade
A 4-hr home assessment was conducted to acquire physiological data, along with various other measures of child health and development. During a 20- to 30-min component of the home visit, midway through the assessment procedures, children's neurobiological reactivity to standardized stressors (BSC) was tested using a protocol for young children completed in a van stationed outside the family's home (Alkon et al., Reference Alkon, Goldstein, Smider, Essex, Kupfer and Boyce2003; Boyce et al., Reference Boyce, Quas, Alkon, Smider, Essex and Kupfer2001). Children were monitored using thoracic and precordial electrodes and a Dinamap cardiac monitor (Model 1846 SX by Critikon, Inc., Tampa, FL). Physiological response parameters employed in the protocol included (a) respiratory sinus arrhythmia (RSA), a measure of parasympathetic influence on heart rate variability; (b) preejection period (PEP), an index of sympathetic activation of the heart; and (c) salivary cortisol, the hormonal end product of the HPA axis. RSA, as described in the work of Porges (Reference Porges1995) and Cacioppo (Cacioppo, Uchino, & Berntson, Reference Cacioppo, Uchino and Berntson1994), was derived from spectral analyses of interbeat interval data within the respiratory cycle-associated, high-frequency (0.15–0.50 Hz) band of the heart rate power spectrum. The natural logarithm of the variance in a high-frequency heart period was calculated to estimate parasympathetic activity. PEP, the duration of isovolumetric ventricular contraction, was measured with impedance cardiography as the 70- to 100-ms interval between the onset of electromechanical systole (indicated by the ECG Q-wave) and left ventricular ejection (indicated by the B-point of the thoracic impedance signal). As described by Cacioppo, Berntson, et al. (1994), thoracic impedance (Z0) and its first derivative (dZ/dt) were measured as resistance to a constant 4-mA, 100-kHz alternating current, using electrodes placed at the apex and base of the child's thorax. Impedance data were ensemble averaged in 1-min intervals, and each waveform was verified or edited prior to analysis. Autonomic reactivity was thus assessed as diminution in RSA (reflecting parasympathetic withdrawal) and shortening of PEP (reflecting a sympathetic effect on cardiac chronotropism).
Cortisol was assessed in saliva because it can be noninvasively collected and reflects the plasma concentration of the nonprotein bound active fraction (Kirschbaum & Hellhammer, Reference Kirschbaum and Hellhammer1994). There were four collection times over the course of the 4-hr in-home assessment: one immediately following the arrival of the study team, a second and third prior to and following the reactivity protocol, and a fourth at the termination of the assessment procedures. Saliva samples were transported on ice from the families' homes to the laboratory immediately after the assessment. Samples were temporarily stored at −20°C for prelaboratory accounting and then transferred to the laboratory where they were stored at −70°C until assayed. Assays were conducted using the Pantex (Santa Monica, CA) 125I Cortisol RIA Kit modified for saliva. All samples were assayed in duplicate within the same assay. The results were considered acceptable only if they met the following criteria: cortisol concentrations of <0.055 µg/dl and required coefficient of variation (CV) of duplicate samples of <25%. For cortisol concentrations >0.055 µg/dl, the required CV of the duplicates was <15%. Repeat assays were performed on all samples not meeting these criteria until CVs of two scores were within an acceptable range. The detection limit of the assay (ED80) was 0.03 µg/dl. The mean interassay and intraassay variations were 6.97% and 3.91%, respectively.
Because the neurobiological sensitivity protocol occurred in the middle of an intensive, 4-hr home assessment, we anticipated that conventional change scores might not adequately represent the dynamics of autonomic and adrenocortical responses within this study context. We have previously suggested (Boyce et al., Reference Boyce, Essex, Alkon, Goldsmith, Kraemer and Kupfer2006) that, in situations where achieving resting values is difficult, more predictive reactivity measures might be derived from a multidimensional response profile, encompassing measures such as maximal response intensity, response variability, or the up- or downregulatory slope of measures over time. In the present study, change scores actually showed minimal shifts from resting to task levels, and inspection of raw data suggested that neurobiological reactivity would be best operationalized as the slope of task measures over the course of the four challenge epochs (autonomic reactivity) or the four collection times during the 4-hr visit (adrenocortical reactivity). Negative RSA slope scores denoted increasing parasympathetic withdrawal (i.e., higher RSA reactivity) and negative PEP slope scores denoted increasing sympathetic activation of the heart (i.e., higher PEP reactivity) over the 20- to 30-min protocol and greater reactivity at measurement onset. Positive cortisol slope scores denoted increasing adrenocortical activation over the 4-hr visit.
Pubertal development: Grades 3–9
The longitudinal design permits a rigorous assessment of timing and tempo of pubertal maturation. Following Ellis and Essex (Reference Ellis and Essex2007), we used a multimethod, multiinformant approach to capture the components of puberty. Mothers and youth completed a self-administered Tanner stage measure based on description and visual inspection of line drawings (Morris & Udry, Reference Morris and Udry1980) and the Pubertal Development Scale (PDS; Petersen, Crockett, Richards, & Boxer, Reference Petersen, Crockett, Richards and Boxer1988). The development of secondary sex characteristics were characterized in a manner corresponding to specific hormonal signals (Dorn et al., Reference Dorn, Dahl, Woodward and Biro2006). Thus, within this framework, breast and genital development is mediated by gonadal hormones and pubic hair development is mediated by adrenal hormones.
For Tanner staging, puberty at third grade was based on the mother's report, because youth were anticipated to be relatively poor informants of maturation at such a young age. In fifth grade, both youth and mother ratings of Tanner staging were collected. Given the high interrater reliability (girls: α = 0.85 for breast and α = 0.83 for pubic hair; boys: α = 0.84 for genital and α = 0.88 for pubic hair), the two data sources were averaged together. A similar strategy was employed in seventh grade. The reliability across informant for girls was excellent (α = 0.76 for breast and α = 0.75 for pubic hair). Reliability for boys was substantially less than that of girls, consistent with the idea that boys may hide development from their caregiver (α = 0.34 for genital and α = 0.44 for pubic hair). By ninth grade, we relied solely on youth ratings of Tanner staging.
The mother-report PDS items were separated into gonadal and adrenal events using a scoring system that takes the normative timing of events and different endocrine correlates into account (Shirtcliff, Dahl, & Pollak, Reference Shirtcliff, Dahl and Pollak2009). Growth of body hair and skin changes were combined (average α = 0.62 for boys and α = 0.50 for girls across Grades 3–9) to form the adrenal score. For girls, growth spurt, breast growth and menstrual status were combined for the gonadal score (average α = 0.58). For boys, growth spurt, deepening of voice and facial hair growth were combined for the gonadal score (average α = 0.54) in a developmentally sensitive manner. Within each grade level, the PDS gonadal scores were then averaged with Tanner breast/genital and the PDS adrenal scores were averaged with Tanner pubic hair. For girls, PDS and Tanner stages were reliable (average α = 0.71 for gonadal/breast and α = 0.68 for adrenal/pubic across Grades 3–9). Reliability was not as high for boys, possibly because there is little overlap of the Tanner stages with the PDS items (average α = 0.31 for gonadal/genital and α = 0.56 for adrenal/pubic). Although these two axes of puberty were considered separately at each of the four grade levels, they were also averaged into an integrative puberty composite at each grade level (average α = 0.64 for boys and α = 0.75 for girls).
Results
Graphical presentation of puberty data
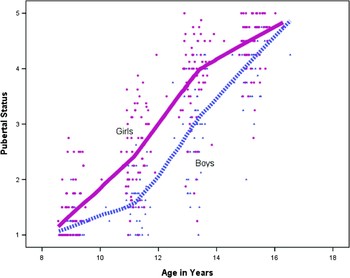
Our principal goal was to examine pubertal timing and tempo, taking into account that individuals initiate puberty at different ages, proceed through puberty at different developmental rates, and may display intraindividual differences in pubertal tempo such that individuals who advance quickly through one stage may advance slowly through other stages. These overarching analytic challenges are illustrated in the locally weighted scatterplot smoothing (lowess) curves and data in Figure 1 for the integrative puberty composite. There was substantial variability in pubertal stage. Most participants were Stage 1 or 2 at around 9 years of age (third-grade assessment) and then achieved Stage 4 or 5 by around 15 years of age (ninth-grade assessment); there was substantial variability in stage within and across ages. Pubertal development did not appear to follow linear growth, which is consistent with Marshall and Tanner's (1969, 1970) observations over four decades ago that growth may follow a sigmoid curve. Few subsequent studies have focused on intraindividual differences in puberty (Dorn et al., Reference Dorn, Dahl, Woodward and Biro2006). Although Figure 1 shows sex differences in pubertal maturation, the inflection points in the sigmoid curve (showing initial acceleration and later deceleration of pubertal growth) are at approximately the same ages in females and males.
A scatterplot of the relation between age and Tanner stage (as indexed by the integrative puberty composite) in girls and boys; pubertal maturation across the adolescent transition is highly variable and pubertal tempo appears nonlinear. Lines represent locally weighted scatterplot smoothing (lowess) fraction curves fit to 50 data points. Lowess curves fit simple models to small subsets of the data, allowing different curves to be fit as the data builds up point by point. The data is smoothed to fit 50 data points at a time until all 427 data points are modeled. [A color version of this figure can be viewed online at journals.cambridge.org/dpp]

Modeling between- and within-person variability in pubertal development using piecewise growth curves
Each participant provided up to four puberty assessments between third and ninth grade. Hierarchical linear modeling is robust to missing data when individuals had fewer than four assessments; the program calculates coefficients using as much information as possible without necessitating pairwise or listwise deletion (Hox, Reference Hox2002), A two-level hierarchical linear model separated within-individual variability (427 puberty scores across all assessments and participants) from between-individual sources of variability (N = 114 participants, average = 3.75 assessments each). The outcome was pubertal maturation. To capture pubertal growth over time, age was included as a Level 1, time-varying predictor. Thus, each individual's trajectory was based on his/her specific age in months at the four assessment periods. This strategy does not assume that every child is the same age at each grade but instead captures the age of each child at each assessment while allowing the interval between assessments to vary from child to child and from wave to wave.
Age was centered at 12.5 years to capture pubertal timing or the level of development achieved by 12.5 years old. Consequently, the intercept in the hierarchical linear modeling model is the predicted level of development when that child is 12.5 years old. We selected 12.5 because (a) it captured a natural break in velocity between initial and subsequent tempo, (b) was at approximately the midpoint of our four pubertal assessments, and thus (c) allowed for two waves to be modeled within both the initial and subsequent pubertal tempo periods. Because it is age standardized, this intercept captures timing more than status (Mustanski, Viken, Kapario, Pulkkinen, & Rose, Reference Mustanski, Viken, Kaprio, Pulkkinen and Rose2004). In addition, sex differences in timing and tempo were controlled for at Level 2 of the analyses (as described below), capturing cross-level interactions. A potential limitation of this approach is that it would not work adequately if boys and girls did not have the same fundamental shape to their tempo and timing variables; however, as noted above, the lowess curves in Figure 1 do not provide evidence for this type of sex difference. Following Kreft and De Leeuw (Reference Kreft and De Leeuw1998), explained variance (R2) was calculated as (unrestricted error − restricted error)/unrestricted error.
As expected, a linear growth model did not adequately capture pubertal tempo (based on the integrative puberty composite), χ2 (113) = 114, p = .40, likely because the growth parameter was misspecified. We considered a sigmoid or polynomial curve, but opted to capture pubertal tempo with a piecewise (two-part) growth curve for several reasons. First, the piecewise components (two slopes) are linear, which is highly interpretable. Second, we expected the underlying maturational processes to be different (and perhaps opposing) between initial and subsequent pubertal development in accordance with Marshall and Tanner's (1969, 1970) report that rate of early development was inversely correlated with later development. Third, for theoretical reasons, we were specifically interested in development prior to age 12.5 (early reproductive maturation); this component was simply captured by the first linear slope, whereas subsequent development was captured by the second linear slope. Initial tempo (early adolescent pubertal growth) was captured with age before 12.5 as a linear predictor of puberty; subsequent tempo (later adolescent pubertal growth) was simultaneously captured with age after 12.5 as a linear predictor of puberty.
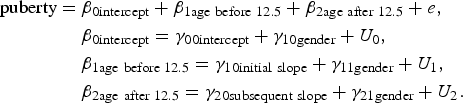
First, we set up the Level 1 model to simultaneously capture the time periods of puberty. As notated in the equations above, these time periods included the intercept (at age 12.5), the age of the child prior to 12.5 years, and the age of the child after age 12.5 years. These predictors of puberty at Level 1, the intraindividual difference level, become outcomes of interest at Level 2, the interindividual difference level. Both intra- and interindividual variability in pubertal maturation were analyzed. Second, we examined the main effects of parental supportiveness and each of the three autonomic and adrenocortical reactivity slope scores (PEP, RSA, and cortisol) on initial tempo, subsequent tempo, and pubertal timing, respectively. Third and finally, we analyzed the interaction between parental supportiveness and each of the reactivity slope scores, controlling for gender and main effects. All models were computed first for the integrative puberty composite and then recomputed separately for breast/genital and pubic hair development as outcomes.
Analyzing the integrative puberty composite, the two-part growth model appeared to capture the intra- and interindividual variability in pubertal maturation (see Figure 1). During the initial tempo period, participants advanced 0.45 stages/year until age 12.5, and this rate of advancement was significantly greater than zero, t (113) = 17.4, p < .001. In addition, there was substantial intraindividual variability in initial pubertal tempo (SD = 0.22), and this level of variability was statistically significant, χ2 (105) = 207, p < .001. By age 12.5, participants had advanced to stage 2.8 on average, t (113) = 29.3, p < .001, although there was still substantial variability in pubertal timing (SD = 0.936), χ2 (105) = 488, p < .001. Thereafter, participants advanced on average 0.55 stages/year through ninth grade, t (113) = 20.3, p < .001. Substantial variability remained in later pubertal tempo as well (SD = 0.20), χ2 (105) = 132, p < .04.
Girls developed .24 stages/year faster on the integrative puberty composite than boys did during the initial tempo period, t (112) = 5.2, p < .001, and had advanced by 1.1 stages more than boys by 12.5 years of age, t (112) = 6.81, p < .001; thereafter, boys caught up by 0.27 stages/year during the subsequent tempo period, t (112) = 5.43, p < .001. Gender explained 29.4% of the variability in initial tempo, 34.0% of the variability in pubertal timing, and 45.1% of the variability in subsequent tempo. So much variability in subsequent tempo was explained by gender, Δχ2 (1) = 24.5, p < .001, that interindividual differences were no longer statistically significant (SD = 0.148), χ2 (104) = 107.04, p = .40. We allowed subsequent tempo to vary, but results below emphasize initial tempo for both conceptual and statistical reasons. All models controlled for gender at the interindividual difference level (Level 2). This allowed us to control for potential sex differences in family environment and BSC, as well as control for cross-level interactions between sex and pubertal timing and tempo, thereby capturing sex differences in rate or stage of maturation.
Main effects of parental supportiveness
Building on analyses first presented in Ellis and Essex (Reference Ellis and Essex2007), based on the integrative puberty composite, children from families with greater parental supportiveness showed slower initial pubertal tempo (β = −0.06), t (111) = 2.88, p < .005, were less developed by 12.5 years of age (β = −0.24), t (111) = 3.51, p < .001, and then showed faster subsequent pubertal tempo (β = 0.07), t (111) = 3.46, p < .001. Parental supportiveness explained 8.8% of the variability in initial tempo, 8.8% of the variability in pubertal timing, and 17.4% of the variability in subsequent tempo. Results were similar when we separately examined breast/genital (ps < .004) or pubic hair development (ps < .004).
Interactions between parental supportiveness and BSC
PEP
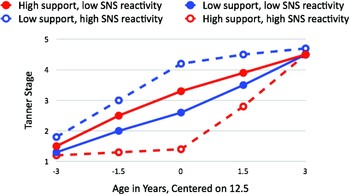
Analyzing the integrative puberty composite, there were no main effects of PEP slope scores on pubertal timing or tempo (ps > .28). However, parental supportiveness interacted consistently with PEP slope score to predict initial pubertal tempo (β = 0.08), t (109) = 2.08, p < .05, pubertal timing (β = 0.35), t (109) = 3.2, p < .002, and subsequent tempo after 12.5 years of age (β = −.10), t (109) = 2.7, p < .008. The interaction effect explained 7.7% of the variability in initial tempo, 7.9% of the variability in pubertal timing, and 20.7% of the variability in subsequent tempo. Main effects of parental supportiveness also persisted (ps < .002). Figure 2 illustrates that children with more negative PEP slope scores (indicating greater sympathetic reactivity) experienced significantly faster initial maturation, displayed more advanced pubertal development by age 12.5, and then experienced less maturation after 12.5 years of age when they came from less supportive families (ps < .001). The opposite was true when children with more negative PEP slope scores came from more supportive families. Conversely, children with more positive PEP slope scores (indicating lower sympathetic reactivity) experienced similar trajectories of pubertal development regardless of whether they came from families with low or high levels of Parental supportiveness. The interactions remained statistically significant when breast/genital development and pubic hair development were examined separately (ps < .001).
The variation in initial and subsequent pubertal tempo (based on integrative puberty composite) as a function of sympathetic nervous system (SNS) reactivity and parental supportiveness, controlling for sex. High versus low parental supportiveness only distinguishes pubertal tempo and timing in adolescents with high SNS reactivity. [A color version of this figure can be viewed online at journals.cambridge.org/dpp]

RSA
Analyzing the integrative puberty composite, there was no evidence for main effects of RSA slope scores on pubertal timing or tempo (ps > .66). When we specifically modeled an interaction with parental supportiveness, there was a trend for an interaction on subsequent pubertal tempo (p = .07); otherwise, there was no evidence for an interaction between family environment and parasympathetic reactivity. The absence of a statistically significant interaction between parental supportiveness and RSA slope score in predicting either initial pubertal tempo or pubertal timing extended to the components of puberty as well; that is, there were no significant interactive effects on either the initial tempo or timing of breast/genital or pubic hair development. Therefore, no further RSA analyses were conducted.
Cortisol
Analyzing the integrative puberty composite, children with higher cortisol slope scores (increasing adrenocortical activation over the 4-hr visit) showed a trend toward slower initial tempo (β = −0.43), t (111) = 1.85, p = .06, and faster subsequent pubertal tempo (β = 0.17), t (111) = 2.3, p = .05. This pattern of results became statistically significant when we specifically examined pubic hair development (ps < .05). Cortisol slope scores explained 1.0% of the variability in initial tempo of pubic hair development, 2.2% of the variability in pubic hair timing, and 9.4% of the variability in subsequent tempo. By contrast, cortisol slope scores did not significantly predict timing or tempo of breast/genital development (ps > .11). These results suggest that adrenocortical activation may be specifically associated with adrenal-hormone related development of secondary sex characteristics.
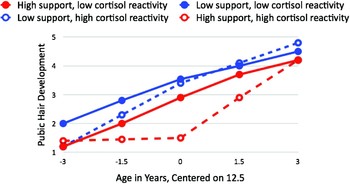
Analyzing the integrative puberty composite, there was no initial evidence that cortisol activation interacted with parental supportiveness to predict pubertal timing and tempo (ps > .75). When we examined breast/genital and pubic hair development separately, however, effects on pubic hair development emerged as above. As shown in Figure 3, there was a significant interaction between cortisol slope scores and parental supportiveness on initial tempo of pubic hair development (β = −0.14), t (109) = 2.35, p = .02. Children with higher adrenocortical activation and higher parental supportiveness experienced slower initial pubic hair development. The interaction explained 1.0% of the variability in initial tempo, 1.67% of the variability in pubertal timing and 10.4% of the variability in subsequent tempo. The main effects of parental supportiveness (ps < .001) and cortisol activation (ps < .03) on timing and tempo persisted when pubic hair development was the outcome. There was no evidence for an interaction between cortisol activation and parental supportiveness in the model predicting breast/genital development (ps > .14).
The variation in initial and subsequent tempo of pubic hair development as a function of cortisol reactivity and parental supportiveness, controlling for sex. High versus low parental supportiveness only distinguishes tempo and timing of pubic hair development in adolescents with high cortisol responsivity. [A color version of this figure can be viewed online at journals.cambridge.org/dpp]

Discussion
In earlier analyses of the WSFW, Ellis and Essex (Reference Ellis and Essex2007) documented a unique effect of parental supportiveness on the timing of pubertal maturation in girls. The current analyses extended this finding in two important ways. First and foremost, analyses tested for the moderating effect of BSC, highlighting that the link between parental supportiveness and puberty depended on two of the three indices of BSC: sympathetic nervous system reactivity (indexed by negative PEP slopes) and adrenocortical activation (indexed by positive cortisol slopes). Of the most critical importance and as predicted by the theory of BSC, higher levels of parental supportiveness predicted slower initial pubertal tempo and less advanced pubertal development by age 12.5 only among children who displayed higher BSC; conversely, lower levels of parental supportiveness predicted faster initial pubertal tempo and more advanced pubertal development by age 12.5 only among children who displayed higher BSC. Whereas sympathetic nervous system reactivity moderated the effects of parental supportiveness on both breast/genital and pubic hair development, adrenocortical activation only moderated the effect on pubic hair development. In sum, building on previous analyses documenting what family contexts predict variation in the timing of puberty, the present results established for whom those contexts matter. These results concur with Belsky's (2000) conjecture that the small main effects of family processes on pubertal timing, as documented in past research, may overestimate the impact of family environments in some children (low susceptibility) and underestimate it in others (high susceptibility). Second, the current analyses further elucidated the outcome of interest, pubertal development, by examining adrenal and gonadal processes that occurred in different people, and within the same person, at different ages and rates of development over the whole course of puberty (ages = 8.6–16.5 years) in girls and boys.
Dorn et al. (Reference Dorn, Dahl, Woodward and Biro2006) remarked that attempting to understand children's development without asking about the age of the child is tantamount to fallacy; within the developmental epoch of adolescence, it is arguably of similar importance to inquire about pubertal maturation. Although it is widely recognized that puberty is complex, recent theory and data have placed increasing emphasis on the multidimensional nature of puberty. Fundamentally, puberty has distinct components and axes, including gonadal, adrenal, and growth hormone systems (Grumbach, Reference Grumbach2002; Grumbach, Bin-Abbas, & Kaplan, Reference Grumbach, Bin-Abbas and Kaplan1998; Parker, Reference Parker1991). Further, because pubertal processes unfold over a number of years, longitudinal research with repeated measurements of puberty are needed to capture maturation. The present study is one of the first investigations to longitudinally assess pubertal maturation and analytically examine how pubertal processes unfold within individuals over adolescence.
This approach proved fruitful: compared with measures of pubertal timing, pubertal status, or standard (time-based) indices of pubertal tempo, the current piecewise growth curve model yielded distinct and nuanced information about pubertal development. Specifically, we found that the previously documented effect of parental supportiveness on pubertal timing was underpinned by slower initial tempo and faster subsequent tempo of both breast/genital and pubic hair growth among children who experienced high parental supportiveness in preschool (and that these effects were moderated by BSC). These results not only underscore the dynamic and nonlinear nature of pubertal development, but also demonstrate how analyzing the changing tempo of maturation across adolescence informs our understanding of intraindividual developmental processes. Because pubertal tempo has important developmental antecedents and sequelae, the benefit of such an analytic approach is that greater knowledge can be gained into the causes and effects of puberty in relation to a broad range of physical, psychological, biological, and social developmental processes.
Evolutionary models of adaptive development under stressful and supportive environmental conditions
Central to an evolutionary–developmental perspective is the concept of conditional adaptation: “evolved mechanisms that detect and respond to specific features of childhood environments, features that have proven reliable over evolutionary time in predicting the nature of the social and physical world into which children will mature, and entrain developmental pathways that reliably matched those features during a species' natural selective history” (Boyce & Ellis, Reference Boyce and Ellis2005, p. 290; for a comprehensive treatment of conditional adaptation, see West-Eberhard, Reference West-Eberhard2003). Because both stressful and supportive childhood environments have been a recurring part of the human experience throughout our evolutionary history, natural selection has shaped our developmental systems to respond adaptively to both contexts (Ellis et al., Reference Ellis, Boyce, Belsky, Bakermans-Kranenburg and van IJzendoorn2011 [this issue]). When people encounter stressful environments, therefore, it does not so much disturb their development as direct or regulate it toward strategies that are adaptive under stressful conditions. Conversely, when people encounter well-resourced and supportive environments, it directs or regulates development toward strategies that are adaptive in that context.
Within this theoretical framework, Boyce and Ellis (Reference Boyce and Ellis2005) proposed that children have conditional adaptations that detect and encode information about levels of support and adversity in early environments, as a basis for calibrating activation thresholds and response magnitudes within stress response systems to match those environments. Specifically, Boyce and Ellis (Reference Boyce and Ellis2005) postulated a curvilinear U-shaped relation between levels of early support versus adversity and the magnitude of biological response dispositions such that (a) exposure to acutely stressful childhood environments upregulates BSC, increasing the capacity and tendency of individuals to detect and respond to environmental dangers and threats, and (b) exposure to especially supportive childhood environments also upregulates BSC, increasing susceptibility to social resources and ambient support. By contrast, and typical of the large majority of children, (c) exposure to childhood environments that are not extreme in either direction downregulates BSC, buffering individuals against the chronic stressors encountered in a world that is neither highly threatening nor consistently safe. Previous analyses of the WSFW provided support for this hypothesis specifically in relation to PEP: growing up in either highly supportive or highly stressful home environments predicted development of high sympathetic nervous system reactivity (Ellis, Essex, & Boyce, Reference Ellis, Essex and Boyce2005). In addition, growing up in highly stressful home environment predicted heightened adrenocortical activation.
Consider the U-shaped curve hypothesis and supporting PEP and cortisol data together with the current results and evolutionary–developmental model of pubertal maturation. Under conditions of early environmental stress and uncertainty, indexed by coercive and unsupportive family relationships, individuals developed heightened BSC (sympathetic and adrenocortical) and subsequently accelerated pubertal maturation in early adolescence, with family stress and context sensitivity acting synergistically in the present study. Heightened BSC thus enabled a stronger pubertal response to adversity. According to evolutionary–developmental models, this response may represent a strategic (i.e., functional) way of developing under stress. Over evolutionary history, responding to threatening or unpredictable childhood environments by growing up fast and hastening sexual maturity may have significantly increased the probability of reproducing at all. As Chisholm (Reference Chisholm1996) suggests, “When young mammals encounter conditions that are not favorable for survival—i.e., the conditions of environmental risk and uncertainty indexed by emotional stress during development—it will generally be adaptive for them to reproduce early” (p. 21).
In contrast, under conditions of early environmental protection and stability, as indexed by positive and supportive family relationships, individuals also developed heightened BSC (Ellis et al., Reference Ellis, Essex and Boyce2005), which in combination with high parental supportiveness, forecast slower initial pubertal tempo and later pubertal timing in the current study. In this case, heightened BSC enhanced responsiveness to environmental resources and support. As suggested by evolutionary–developmental models, the resulting pattern of late sexual maturation may also constitute adaptive variation. Specifically, Ellis (Reference Ellis2004) hypothesized that children have been selected to capitalize on the benefits of high-quality parental investment and reduce the costs of low-quality parental investment by contingently altering the length of childhood. Given high family resources and support and context sensitivity, extending childhood by delaying onset of puberty or slowing pubertal tempo may function to enhance development of sociocompetitive competencies that ultimately increase reproductive potential.
Variation in results across stress response systems
Note that, although the study hypothesis was generally supported, there were also important differences in results across the stress response systems. This variation may reflect the different levels at which environmental challenges are instantiated in the brain. Stress initially registers in the brain as limbic circuitry assesses the emotional content of incoming environmental information and activates hypothalamic nuclei and related neuroendocrine targets (Dedovic, Duchesne, Andrews, Engert, & Pruessner, Reference Dedovic, Duchesne, Andrews, Engert and Pruessner2009; Pruessner et al., Reference Pruessner, Dedovic, Pruessner, Lord, Buss and Collins2010). A rapid, low threshold stress response is triggered first through the release of vagal, parasympathetic control over heart period, a chronotropic effect indirectly measured via changes in RSA and heart rate (Porges, Reference Porges1995). The sympathetic adrenomedullary system, which is also quickly responsive through the activation of the locus coeruleus, is measurable in the periphery as increases in catecholamine levels (Goldstein & Kopin, Reference Goldstein and Kopin2008) or indirectly via autonomic changes in heart rate, PEP (Cacioppo et al., Reference Cacioppo, Berntson, Binkley, Quigley, Uchino and Fieldstone1994, Reference Cacioppo, Berntson, Malarkey, Kiecolt-Glaser, Sheridan and Poehlmann1998), or salivary α-amylase (Granger, Kivlighan, el-Sheikh, Gordis, & Stroud, Reference Granger, Kivlighan, el-Sheikh, Gordis and Stroud2007; Nater & Rohleder, Reference Nater and Rohleder2009). Although release of the parasympathetic brake on heart rate occurs with relatively mild exposures to challenge, more stressful encounters are generally required to elicit sympathetic activation. The present investigation examined BSC by measuring physiological responses to moderate social, emotional, and cognitive challenges. In the context of such moderate challenges, parasympathetic reactivity (RSA) was likely provoked in the majority of participants, and the null findings in regard to RSA may have been observed because the threshold of reactivity was too low to distinguish between children with low and high BSC. By contrast, there were larger and perhaps more differentiating and predictive individual differences in sympathetic nervous system reactivity (PEP), so that the clearest evidence in support of the hypothesized BSC effects derived from the measure of sympathetic reactivity (see also Ellis et al., Reference Ellis, Essex and Boyce2005).
Although autonomic and HPA responses are highly integrated within brain circuitry, the hormonal cascade of the HPA axis occurs within a different and slower time frame than that of the autonomic nervous system (Sapolsky, Romero, & Munck, Reference Sapolsky, Romero and Munck2000), and HPA activation appears to be more specifically responsive to social evaluative challenges (Dickerson & Kemeny, Reference Dickerson and Kemeny2004; Gunnar, Talge, & Herrera, Reference Gunnar, Talge and Herrera2009). Many laboratory and naturally occurring stressors may succeed in stimulating a stress response in other stress-sensitive physiological systems (Gordis, Granger, Susman, & Trickett, Reference Gordis, Granger, Susman and Trickett2006), but these challenges are often not sufficiently intense or specific to stimulate cortisol release (Cohen et al., Reference Cohen, Hamrick, Rodriguez, Feldman, Rabin and Manuck2000). Although cortisol reactivity was not consistently observed in response to the stress paradigm utilized in this study, changes in salivary cortisol over the course of the entire, 4-hr home visit showed extensive individual differences, and the direction and slope of those changes were reflective of HPA activation. A subgroup of children demonstrated substantial HPA responsivity, and it was among these children that clear evidence for BSC effects also emerged.
Note that among children evincing HPA axis reactivity, differential susceptibility to parental supportiveness was observed specifically for pubic hair maturational timing and tempo. This finding concurs with the known developmental biology of pubic hair maturation, which is advanced by sex hormone release from the adrenal gland (Shirtcliff et al., Reference Shirtcliff, Dahl and Pollak2009), often in conjunction with cortisol release in response to ACTH (Azziz, Fox, Zacur, Parker, & Boots, Reference Azziz, Fox, Zacur, Parker and Boots2001; Shirtcliff, Zahn-Waxler, Kilines-Dougan, & Slattery, Reference Shirtcliff, Zahn-Waxler, Klimes-Dougan and Slattery2007). It is possible that HPA axis activity is more tightly coupled anatomically and functionally with pubic hair maturation, compared to breast/genital maturation (which is stimulated by gonadal hormones).
Limitations, Future Directions, and Conclusion
The limitations of the present study should be noted because they provide important directions for future research. First, and foremost, the current research was based on a relatively small sample that was largely middle class and White and, at least at the outset, composed of intact families in a Midwestern state. Whereas the small sample limited our power to detect higher order interactions in the data, the demographic homogeneity was likely to have underrepresented the high end of family stress and adversity. Undersampling high-risk families is concerning because dangerous or unpredictable family environments, which genuinely threaten children's health and safety, may be most likely to accelerate pubertal maturation (see Ellis, Figueredo, Brumbach, & Schlomer, Reference Ellis, Figueredo, Brumbach and Schlomer2009). Therefore, it will be especially important in future research to study larger numbers of families that more fully capture the range of stress and adversity in the population.
Second, the current methods for assessing family environment constituted both a strength and weakness of this research. The strength was that family environment was measured prospectively, in preschool, prior to the onset of puberty; thus, pubertal maturation could not have influenced family dynamics. A potential weakness, however, was the unidimensional assessment of parental supportiveness. From an evolutionary–development perspective, both the harshness of childhood environments (stress–adversity vs. nurturance–support, as estimated by the parental supportiveness measure), and the predictability versus unpredictability of childhood environments should influence sexual development (Brumbach, Figueredo, & Ellis, Reference Brumbach, Figueredo and Ellis2009; Ellis et al., Reference Ellis, Figueredo, Brumbach and Schlomer2009). Future research needs to more carefully assess harsh versus unpredictable environmental contexts, as well as differential susceptibility to these factors.
Third, the assessment of BSC also had advantages and disadvantages. The choice of psychophysiology measures for the purposes of this study had at least two important advantages: (a) the standardized challenges within the reactivity protcol were developed as ecologically valid tasks, not unlike those encountered in the natural world among children of similar age; and (b) the outcome variables (i.e., the timing and pace of pubertal development) are determined by neuroendocrine circuitry closely related to and influenced by the stress reactivity systems indexed within the reactivity protocol (see Ellis, Reference Ellis2004). Thus, in terms of both ecological validity and salience to outcomes, the current physiological measurement of BSC offered an optimal approach. Nonetheless, as reviewed in Ellis et al. (Reference Ellis, Boyce, Belsky, Bakermans-Kranenburg and van IJzendoorn2011 [this issue]), an array of hierarchically organized neurogenomic and endophenotypic mechanisms may underlie variation in susceptibility to environmental influence. It will be important in future research to expand from single modalities of measurement (e.g., indexing BSC through psychophysiological responses) to multiple methods of assessment, ranging from behavioral indicators of environmental susceptibility to peripheral neuroendocrine pathways, brain circuitry, and both genetic and epigenetic variation.
Fourth, our measures of puberty, although employing multiple informants and assessing multiple components of puberty, were imperfect. At the earliest and latest waves, different informants were used in order to be developmentally sensitive to the needs and knowledge of the family. Although Tanner staging by physical examination is the gold standard (Dorn et al., Reference Dorn, Dahl, Woodward and Biro2006), past research indicates that both self- and parent ratings of pubertal development, using either the PDS or the Tanner drawings, are moderately to highly correlated with ratings by healthcare professionals based on physical examinations (summarized in table 2 of Dorn et al., Reference Dorn, Dahl, Woodward and Biro2006). Further, self-reported pubertal maturation correlates well with sex hormones and is adequate for assessing development over time (Shirtcliff et al., Reference Shirtcliff, Dahl and Pollak2009). Additional validation data for the current puberty measures, including correlations with height, weight, and adrenal androgens, are reported in Ellis and Essex (Reference Ellis and Essex2007).
Toward an integrated understanding of Person × Environment interactions in pubertal development
An expansive biomedical and behavioral literature has sought to characterize environmental influences on pubertal development (Ellis, Reference Ellis2004). Despite the indisputable contributions of this body of research, the current study (in the context of the differential susceptibility paradigm advanced in this Special Section) suggests that Person × Environment interactions may play an important role in regulating pubertal maturation. Specifically, individuals who display heightened BSC appear to be especially susceptible to both the development-enhancing and risk-promoting effects of family environments on pubertal growth. The current results using physiological indicators of BSC converge with other differential susceptibility research, which has shown that the effects of parent–child relationships on pubertal timing depend on genotypic (i.e., variation in estrogen receptor-α; Manuck, Craig, Flory, Halder, & Ferrell, Reference Manuck, Craig, Flory, Halder and Ferrell2011 [this issue]) and behavioral (i.e., variation in infant negative emotionality; Belsky et al., Reference Belsky, Steinberg, Houts, Friedman, DeHart and Cauffman2007) markers of susceptibility to environmental influence. Clearly, the path forward is integration across levels: elucidating the hierarchical and bidirectional relations between genotypes, endophenotypes, and behavior that together constitute BSC and explain its role in moderating environmental effects on puberty.
The stakes are high. For example, a 1-year delay in age at menarche reduces risk for breast cancer by 10% to 20% (Bernstein, Reference Bernstein2002). As policymakers and practitioners contemplate environmental manipulations to delay puberty, a clear implication of the differential susceptibility perspective is that the effects of such manipulations will not be homogeneous across individuals but vary according to BSC. Although in an ideal world interventions would be implemented to ameliorate adversity in all children, economic constraints dictate the need to identify particular groups for whom targeted programs will be most effective. In some circumstances, potential intervention targets could be selected using differential susceptibility screens. The current data suggest that prevention and intervention efforts aimed at altering pubertal timing or tempo will have a larger impact on biologically sensitive youth and, consequently, greater effects on puberty-related physical health problems (e.g., breast cancer) and mental health problems (e.g., anxiety) downstream.