INTRODUCTION
Worldwide, drought limits agricultural productivity more than any other single factor. Wheat (Triticum aestivum L.) provides, on average, one-fifth of the total calorific input of the world's population. The significantly warmer and more extreme conditions now arising from climate change (IPCC Reference Innes, Hoogendoorn and Blackwell2007) means that new cultivars with greater drought resistance must be developed to maintain food security. In the UK, winter wheat is the most widely grown arable crop and contributes c. 15 million tonnes per annum with an average productivity of c. 8 t/ha (DEFRA Reference Craufurd, Austin, Acevedo and Hall2008). Water deficits can commonly limit yields in some years, where, typically, the onset of drought is post-anthesis, and losses are c. 0·30 (Foulkes et al. Reference Foulkes, Scott and Sylvester-Bradley2002). In typical UK drought conditions, the most rapid progress seems likely to depend on the introduction of traits able to improve drought resistance without detrimental effects on yield potential, into high-yielding genotypes. While water-use efficiency (WUE; ratio of aerial biomass to evapotranspiration) remains a target for yield improvement under severe drought stress (Rebetzke et al. Reference Rajaram, Villareal and Mujeeb-Kazi2002), it is probably the total amount of water used by the crop that is more important in most of the drought environments where wheat is grown, e.g. under typical Mediterranean-type droughts (Araus et al. Reference Araus, Slafer, Reynolds and Royo2002, Reference Araus, Slafer, Royo and Serret2008) and in north-western Mexico (Reynolds & Borlaug Reference Rebetzke, Condon, Farquhar, Appels and Richards2006; Reynolds et al. Reference Reynolds and Borlaug2007). This is because there is usually a negative association between WUE and yield under moderate to mild drought conditions, since greater WUE is driven mainly by plant traits such as stomatal closure that reduce transpiration and crop water use (Araus et al. Reference Araus, Villegas, Aparicio, Garcia de Moral, El Hani, Rharrabti, Ferrio and Royo2003).
Carbon isotope discrimination (Δ13C) is a measure of the 13C/12C ratio in plant material relative to the same ratio in the air (Farquhar & Richards Reference Ehdaie, Whitkus and Waines1984). In C3 plants, such as wheat, Δ13C is positively related to the ratio of the concentration of CO2 inside and outside the leaf (ci/ca), and since transpiration efficiency (TE) at the stoma (CO2 assimilation/transpiration) is negatively related to ci/ca, it is negatively related to TE (Farquhar et al. Reference Farquhar and Richards1982). Consequently, Δ13C, due to its convenience and relatively cheap cost, has become a useful indicator of differences in TE in wheat (Ehdaie & Waines 1994; Condon et al. Reference Condon, Richards and Farguhar2002). Selection for Δ13C has been used to develop the Australian spring-wheat cvars Drysdale and Rees (Richards Reference Richards2006). Under severe drought in Australia, the evaluation of BC2-derived sister-lines (lines derived from the second backcross generation) showed Δ13C of grain to be negatively correlated with aerial biomass and yield for wheat (Rebetzke et al. Reference Rajaram, Villareal and Mujeeb-Kazi2002). In other instances of more mild Mediterranean droughts with relatively plentiful water up to anthesis, the relationship between Δ13C and grain yield of temperate cereals has been positive, associated with higher stomatal conductance and increased water use (WU) and biomass (Araus et al. Reference Araus, Casadesus, Asbati and Nachit2001, Reference Araus, Villegas, Aparicio, Garcia de Moral, El Hani, Rharrabti, Ferrio and Royo2003; Condon et al. Reference Condon, Richards, Rebetzke and Farquhar2004). In summary, it will be an important objective to optimize seasonal WU and WUE in new drought-tolerant cultivars, particularly to identify sources of high WU in which any trade-off with WUE is minimized.
Traits for drought resistance in UK winter wheat have previously been investigated by Foulkes et al. (Reference Flintham, Börner, Worland and Gale2001, Reference Foulkes, Scott and Sylvester-Bradley2002, Reference Foulkes, Sylvester-Bradley, Worland and Snape2007), who observed higher WUE for an old, taller cultivar (Maris Huntsman, released in 1972) at 6·3 g/m2/mm compared to five more modern semi-dwarf cultivars (release dates from 1983 to 1995) at 5·5–5·7 g/m2/mm (Foulkes et al. Reference Flintham, Börner, Worland and Gale2001). Among recombinant doubled-haploid (DH) lines from a cross between winter wheat cvars Beaver×Soissons, green flag-leaf persistence and stem water soluble carbohydrate (WSC) were reported to be positively associated with grain yield under drought (Foulkes et al. Reference Foulkes, Sylvester-Bradley, Worland and Snape2007), whereas stem WSC was positively associated with grain yield under both irrigated conditions and drought, green flag-leaf area persistence was only correlated with yield under drought, and, therefore, of the two traits showed a clearer correlation with the ability to maintain yield under drought. The present paper reports on two field experiments examining lines of the cvars Beaver×Soissons DH population carried out at Gleadthorpe, Nottinghamshire in 2002/2003 and Sutton Bonington, Leicestershire in 2004/2005 in the UK, where an irrigation treatment was imposed to examine responses to drought. Responses of Δ13C of grain, harvest above-ground biomass, grain yield and yield components to drought were examined. The aims of the present study were to: (i) characterize genetic variation in WUE as indicated by Δ13C in the cvars Beaver×Soissons DH population and quantify associations with aerial biomass and yield under irrigated and water-stressed conditions and (ii) quantify the effects of major agronomic genes (Rht-B1b, Rht-D1b and the awn suppressor B1) and the 1BL.1RS wheat–rye (Secale cereale L.) translocation segregating in the population, on Δ13C, yield and yield components under irrigated and water-stressed conditions. It was hoped that the information on traits and their genetic control would provide selection criteria for breeding and cultivar choice in drought-prone environments in the UK and worldwide in future years.
MATERIALS AND METHODS
Plant material
The DH population was developed using the wheat–maize technique (Suenaga Reference Sayre, Acedevo and Austin1994). A population of 65 DH lines was derived from the F1 between cvars Beaver and Soissons, of which 44 were characterized in the present study. The population was selected for study according to previous data on the parents indicating that cvar Soissons had a significantly lower Δ13C of grain than cvar Beaver under drought. Cultivar Soissons (Ppd-D1a photoperiod-insensitive allele; Rht-B1b semi-dwarf allele) is a French-bred cultivar released in c. 1988 with variable bread-making quality and which maintained a small market share in the UK during the 1990s, mostly in southern England. Cultivar Beaver (Ppd-D1b photoperiod-sensitive allele; Rht-D1b semi-dwarf allele) is a UK-bred feed wheat cultivar released in 1993. Cultivar Soissons has good canopy persistence (Verma et al. Reference Tsialtas and Tokatlidis2004), while cvar Beaver has poorer canopy persistence. Cultivar Soissons is awned and does not possess the 1BL.1RS (Triticum aestivum L.) – rye (Secale cereale) translocation, involving the short arm of rye chromosome 1R, whereas cvar Beaver is unawned, possessing an awn suppressor at the locus B1 on chromosome 5A, and does posses the 1BL.1RS translocation.
Sites and experimental treatments
Two field experiments were carried out at Gleadthorpe, Nottinghamshire (53°13′N, 1°07′W) in 2002/2003 and Sutton Bonington, Leicestershire (52°83′N, 1°25′W) in 2004/2005 on the cvars Beaver×Soissons DH population. In 2002/2003, the experiment examined 44 DH lines and the two parents, and in 2004/2005, 33 DH lines and the two parents. The two experimental site-seasons are referred to hereafter as GL03 and SB05, respectively. At Gleadthorpe, the soil was a loamy medium sand 0·35 m deep over medium sand (Cuckney Series) and at Sutton Bonington a medium sandy loam 0·8 m deep over clay (Dunington Heath series). Both experiments used a randomized block, split-plot design, in which two irrigation treatments (fully irrigated and unirrigated) were randomized on main plots and the DH lines and the two parents were randomized on sub-plots. The sub-plot size was 1·4×6 m at Gleadthorpe and 1·6×12 m at Sutton Bonington. The main plots were separated by 8 m discards and there were three replicates in each experiment. In the irrigated main plots, water was applied using a linear overhead irrigator at GL03 and a trickle irrigation system at SB05 to maintain soil moisture deficit (SMD), calculated using the ADAS Irriguide model (Bailey & Spackman 1996), to <0·50 available water (AW) up to GS61+28 days and <0·75 AW thereafter. The AW capacity to 1·2 m soil depth was 105 mm at GL03 and 176 mm at SB05.
The previous crops were potatoes at GL03 and winter oats at SB05. The crops were sown on 19 October 2002 and 8 October 2004, respectively. In each experiment, 220 kg N/ha nitrogenous fertilizer as ammonium nitrate was applied in a four-split programme; 40 kg N/ha was applied in early March, 70 kg N/ha in late March, 60 kg N/ha in early May with the remainder in mid-May. No plant growth regulator (PGR) was applied at Gleadthorpe, whereas at the more lodging-prone site of Sutton Bonington, chlormequat was applied at GS31. Prophylactic applications of fungicides were given at GS31, GS39 and GS59 (Tottman Reference Suenaga1987), to keep diseases to very low levels. Pesticides and herbicides were used as necessary to minimize the effects of pests and weeds.
Crop measurements
The date of flowering (Tottman Reference Suenaga1987) was recorded in all sub-plots in each experiment as the date when 0·50 of shoots had reached GS61. In each experiment, combined (i.e. machine harvested) grain yields were assessed on an area of 1·4×5 m (GL03) or 1·6×5 m (SB05) in all sub-plots, and values adjusted to 150 g/kg moisture content. In GL03, 2–3 days prior to harvest c. 100 shoots per sub-plot were sampled at random. All above-ground plant material was separated into ears and straw. Ears were counted, threshed and the chaff (rachis, rachilla, glumes, palea and lemma) and grain weighed separately after drying for 48 h at 80°C. A sub-sample of the straw (0·5 by fresh weight) was weighed after drying for 48 h at 80°C. The harvest index (HI) was calculated as the fraction of above-ground dry matter (AGDM) present as grain. Harvest AGDM was calculated from combined grain yield and the HI. In SB05, 2–3 days prior to harvest, c. 100 shoots per sub-plot were sampled at random for six DH lines and the two parents only, in all subplots. The 100-shoot samples were processed as described for GL03. In each experiment, for all genotypes in all sub-plots the individual grain weight was assessed on a 75 g sample; after hand-cleaning, the number of grains was counted and the sample weighed after drying for 48 h at 80°C. In each experiment, the number of grains/ear was obtained (for 44 DH lines and the two parents in GL03, and for six DH lines and two parents in SB05), from the individual grain weight and grain weight/ear obtained from the 100-shoot sample pre-harvest. Ears/m2 was calculated from the combined grain yield, the individual grain weight and the number of grains/ear.
For the 33 common DH lines included in both experiments, a 30 g grain DM sub-sample for each sub-plot was dried for 48 h at 80°C and ground to a fine powder (<200 μm particle diameter) using a Cyclotec 1093 sample mill (Foss Tecator Co.) for carbon isotope analysis using a mass spectrometer. The 13C/12C ratios of bulk organic matter were analysed in an online system comprising a Carlo Erba NA-1500 series elemental analyser, a VG TripleTrap and a VG Optima mass spectrometer (GV Instruments, Manchester, UK). Grain samples were used, since the best correlation between 13C/12C ratios and biomass are usually obtained when the parts of the plants analysed are those that developed the latest (Araus et al. Reference Araus, Slafer, Reynolds and Royo2002).
In GL03, in all sub-plots, five fertile shoots per plot were sampled at random at GS61 and the flag leaves removed. The green leaf area of the flag leaves was recorded using a leaf area meter (LICOR3100, Lincoln, NE, USA) and the leaves dried for 48 h at 80°C. After recording the dry weight of the flag leaves, they were milled and the N content determined via the Dumas method using a LECO Automatic Combustion Analyzer NA 2000 (Carlo Erba Instruments, Milan, Italy). Crop height was recorded 2–3 days prior to harvest to the tip of the ear in all subplots in GL03, and in all subplots of six DH lines and the two parents in SB05.
Genetic mapping
The cvars Beaver (1BL.1RS, Rht-B1a and Rht-D1b)×Soissons (1B, Rht-B1b and Rht-D1a) population were segregating for the 1BL.1RS translocation and the Rht-B1b (formerly Rht1) and Rht-D1b (formerly Rht2) semi-dwarf genes. The presence of the 1BL.1RS translocation in each DH line was determined by evaluating the genotype for simple sequence repeats (SSR) molecular markers specific for loci on chromosome 1BS, namely psr3000, barc149, barc08, gwm11 and gwm413. The presence of a PCR product from DNA of a line indicated the 1BS arm and the absence of a product the 1RS arm. The presence of the Rht-B1b and Rht-D1b semi-dwarf or wild-type alleles was determined by evaluating the genotype for genetic markers specific for the loci.
Statistical analysis
Data were analysed using Genstat 8.1 (Lawes Agricultural Trust, Rothamsted Experimental Station). The standard analysis of variance (ANOVA) procedures for a split-plot design were used to calculate treatment means, standard errors and significant differences between treatment means. Replications were regarded as random effects, while the irrigation treatment and genotype were fixed effects. For ANOVAs across seasons, Bartlett's test (P=0·05) was used to test for the homogeneity of variances, and site-seasons were regarded as random effects. The mean square for the site-season effect was tested against an error mean square representing the variation between blocks within site-seasons. The mean square of the genotype or site-season×genotype effects was tested against an error B mean square representing residual variation. Treatment means were compared using the least significant difference of the means of Fisher, calculated from the standard errors of the difference of means using appropriate degrees of freedom, when the ANOVA indicated significant differences. Phenotypic correlations amongst genotypes between traits, as well as between respective traits and grain yield, were calculated using the genotype means across replicates for individual site–seasons and the genotype means across the two site–seasons for the site–season mean. The effects of presence/absence of 1BL.1RS and awns, and the differences amongst the groups of Rht-B1b/Rht-D1a (formerly Rht1), Rht-B1a/Rht-D1b (formerly Rht2), Rht-B1b/RhtD1b (formerly Rht1+Rht2) and Rht-B1a/Rht-D1a (formerly rht, tall) lines, were tested using a mixed linear unbalanced design procedure in Genstat 8.1. Regression analysis using simple linear regression (Genstat 8.1) was applied to genotype means in irrigated and unirrigated treatments in each site-season and to the genotype mean values across site-seasons in irrigated and unirrigated conditions to examine associations between traits and grain yield. In addition, a parallel regression analysis procedure was used with site-season as a factor to test whether the slopes of the relationship between Δ13C of grain and grain yield differed between site-seasons, either under irrigated or unirrigated conditions. For the simple linear regressions, regression coefficients are presented for the statistically significant regressions.
RESULTS
Weather patterns and SMDs
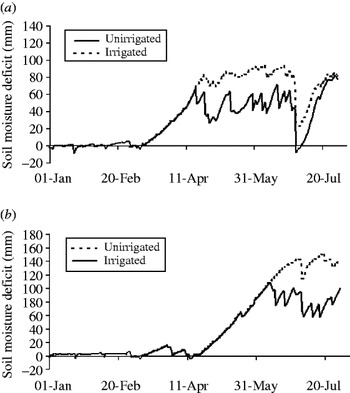
The SMDs in the irrigated and unirrigated treatments were calculated for each experiment according to the ADAS Irriguide model (Bailey & Spackman 1996) using the relevant meteorological data for the site-season. In 2003, the AW to 1·2 m rooting depth at Gleadthorpe was 105 mm. Previous work at this location has shown that the limiting deficit at which the onset of drought occurs is 0·50 AW (i.e. 53 mm) pre-flowering and 0·65 AW (i.e. 68 mm) post-flowering (Foulkes et al. Reference Foulkes, Scott and Sylvester-Bradley2001). In GL03, the onset of drought coincided with flag-leaf emergence. However, limiting deficits were only sustained till mid grain filling, associated with high rainfall on 30 June (54 mm) (Fig. 1). The total amount of water applied in the irrigated treatment was 175 mm. In SB05, the AW to 1·2 m was 176 mm. SMD exceeded 87 mm (0·50 AW) on 30 May and limiting deficits were maintained until physiological maturity. A total of 171 mm of irrigation water was applied in the irrigated treatment.
SMDs to 1·2 m calculated using Irriguide (Bailey & Spackman 1996) at (a) Gleadthorpe in 1993 and (b) Sutton Bonington in 2005.

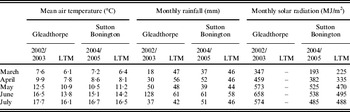
The 2002/2003 season at Gleadthorpe was characterized by a cold December and January, followed by a warm spring and then slightly above-average temperatures until harvest (Table 1). The mean air temperature exceeded 16°C from June onwards. For the 2004/2005 season at Sutton Bonington, the mean air temperature, rainfall and radiation levels were generally similar to the long-term mean (LTM).
Mean monthly weather data for Gleadthorpe and Sutton Bonington in experimental seasons and the LTM for Gleadthorpe (1975–2003) and Sutton Bonington (1975–2004)

Flowering date and plant height
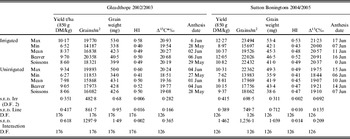
There was only a minor effect of irrigation treatment on the flowering date (GS61) in the two experiments, with the flowering date overall advanced by 1 day under drought in each of GL03 and SB05. Amongst the DH lines, the flowering date ranged from 28 May to 6 June under irrigation and from 27 May to 4 June under drought in GL03; and from 7 to 17 June and 6 to 15 June, respectively, at SB05 (Table 2). There was no statistically significant correlation between the flowering date and yield among the DH lines under irrigated or unirrigated conditions in either site-season.
Grain yield (at 850 g DM/kg), grain number/m2, grain weight (at 1000 g DM/kg), HI and carbon isotope discrimination (Δ13C) of grain for maximum, minimum and mean values of DH lines and parents in the irrigated (Irr) and unirrigated (Unirr) treatments for the cvars Beaver×Soissons DH population at Gleadthorpe in 2002/2003 (44 DH lines)* and Sutton Bonington in 2004/2005 (33 DH lines)

* 33 lines only for Δ13C of grain.
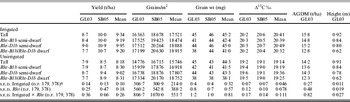
In GL03, compared to the tall lines (0·92 m), crop height was reduced in the Rht-B1b semi dwarf (−74 mm), the Rht-D1b semi-dwarf (−122 mm) and Rht-B1b/Rht-D1b dwarf (−293 mm) lines (P<0·01) (Table 3). There was no significant difference in crop height between Rht-B1b and Rht-D1b (P=0·08). Averaging across genotypes, the reduction in height of 8 mm under drought was not significant. In SB05, height was only measured on six DH lines and the two parents. In this year, there was, overall, a small reduction in height under drought of 52 mm (0·779 v. 0·727 m). This was compared with an average reduction in height under drought of 9 mm (0·820 v. 0·811 m) in GL03 for the same set of eight genotypes. The reduction in height under drought was relatively greater for the taller lines in SB05 (P<0·01). Among the eight genotypes for which height was assessed in both experiments, there was a positive correlation between the values observed in GL03 and SB05 under both irrigation (r=0·86) and drought (r=0·93), indicating that the DH lines tended to rank similarly for crop height in the two site-seasons.
Grain yield (at 850 g DM/kg), grain number/m2, grain weight (1000 g DM/kg), harvest AGDM, carbon isotope discrimination (Δ13C) of grain for Rht groups* of 33 DH lines derived from cvars Beaver (Rht-B1a/Rht-D1b, formerly Rht2) and Soissons (Rht-B1b/Rht-D1a, formerly Rht1) in irrigated and unirrigated treatments at Gleadthorpe 2002/2003 (GL03) and Sutton Bonington 2004/2005 (SB05)

* Number of DH lines in Rht groups: Rht-B1a/Rht-D1a (14), Rht-B1b/Rht-D1a (5), Rht-B1a/Rht-D1b (9) and Rht-B1b/Rht-D1b (5).
† d.f. for GL03 or SB05=178; d.f. for cross site-season mean=378.
Grain yield and yield components’ responses to drought
Responses of DH lines to irrigation
For the 44 DH lines characterized in GL03, the effect of restricted water availability on yield was not statistically significant (8·37 t/ha irrigated v. 7·96 t/ha unirrigated), although the DH lines responded differently to restricted water availability (P<0·01; Table 2). For the 33 DH lines characterized in SB05, restricted water availability decreased yield from 10·37 to 8·81 t/ha (P=0·06), and the DH lines responded differently to drought (P<0·05). For the 33 DH lines tested in both site-seasons, yield, on average, decreased by 11% from 9·46 t/ha under irrigation to 8·42 t/ha under drought (P<0·05), with yield losses among DH lines ranging from 0·23 to 2·46 t/ha (P<0·05). Averaging across site-seasons, the reduction in grain yield under drought was similar for cvar Beaver (1·28 t/ha) and cvar Soissons (1·00 t/ha) parents (Table 2). Overall, the water stresses incurred in the experiments were, therefore, relatively mild.
In GL03, the effects of restricted water availability on grains/m2 (−1017) and grain weight (+0·8 mg) were not statistically significant. However, the irrigation×genotype interaction was significant for both yield components (P<0·001). In SB05, drought decreased grains/m2 (−1564) and grain weight (−3·4 mg) (P<0·001), and the DH lines responded differently to drought in each case (P<0·001). Averaging across site-seasons, grains/m2 and grain weight decreased under drought (−9%, P=0·06 and −5%, P<0·001, respectively). Genetic variation in grain yield was positively associated with variation in grains/m2. Thus, in GL03 and SB05 the phenotypic correlation among DH lines between yield and grains/m2 was statistically significant under irrigation (r=0·59 and 0·81, respectively, P<0·001) and drought (r=0·62 and 0·79, respectively, P<0·001). However, the correlation between yield and individual grain weight among the DH lines in GL03 was only significant under irrigation (r=0·50, P<0·001), and in SB05 was not significant under either irrigation or drought.
Effects of major genes (Rht and B1) and 1BL.1RS on yield and yield components
Similar effects of the Rht genes on grain yield were observed in the two experiments (Table 3). Averaging across experiments and irrigation treatments, the yield was increased compared to the tall lines in the Rht-D1b semi-dwarf lines by 0·73 t/ha (8·3%), but the Rht-B1b semi-dwarf and the dwarf lines yielded similarly to the tall lines. The irrigation×Rht group interaction was not statistically significant. The greater yield for Rht-D1b compared to the tall lines was associated with 1714 (10·3%) more grains/m2 (P<0·01), but a similar grain weight. The grain number/m2 of the Rht-B1b semi-dwarf (6·4%) and dwarf lines (13·2%) was also boosted compared to the tall control, but in each case grain weight was reduced by 2·8 (−6·2%) and 5·3 (−11·8%) mg, respectively. There was no irrigation×Rht group interaction for any of the yield components.
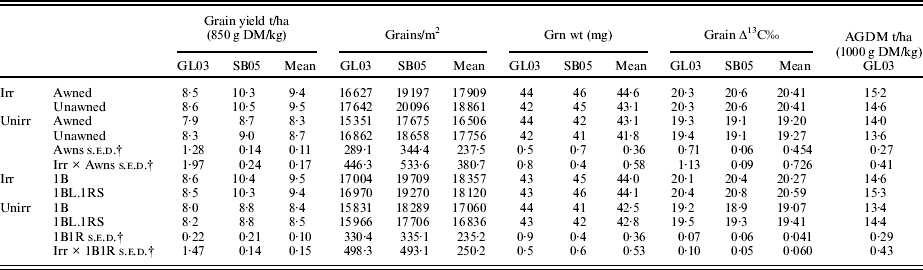
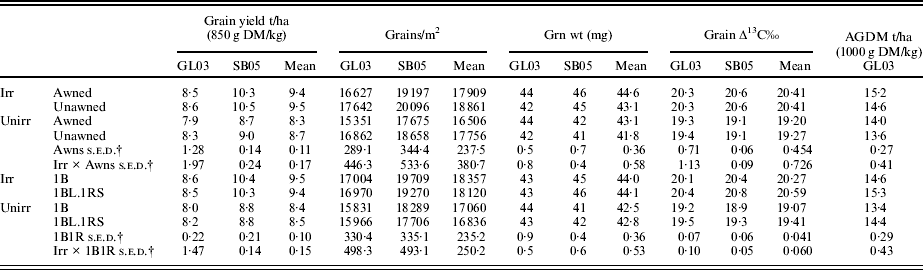
Averaged across experiments and irrigation treatments, the presence of awns slightly decreased yield by 0·24 t/ha (−2·6%, P<0·05); the irrigation×±awns interaction was not statistically significant (Table 4). The small effect of awns on yield was associated with an overall decrease in grains/m2 (−6·0%) and an increase in grain weight (3·2%). The irrigation treatment×± awns interaction was not significant for any of the yield components. The 1BL.1RS translocation did not significantly affect yield or any of the yield components in either experiment; furthermore, the irrigation treatment×±1BL.1RS interaction was not significant for yield or any yield component in either experiment.
Effects of the presence of awns* and 1BL.1RS wheat–rye translocation on grain yield, yield components and carbon isotope discrimination (Δ 13C) in irrigated (Irr) and unirrigated (Unirr) treatments at Gleadthorpe 2002/2003 (GL03) and Sutton Bonington 2004/2005 (SB05) and on AGDM at harvest in GL03 in 33 DH lines derived from cvars Beaver (unawned, 1BL.1RS) and Soissons (awned, IB)
* Number of DH lines in groups: 1B (18), 1BL.1RS (15); awned (21); unawned (12).
† D.F. for GL03 or SB05=192; D.F. for cross site-season mean=387.
HI and AGDM responses to drought
Responses of DH lines to irrigation
In GL03, HI was assessed on all 44 DH lines and was not affected by restricted water availability (Table 2). Although the overall AGDM decrease of 6·5% was not statistically significant, DH lines differed in loss of AGDM under drought in the range 0·26–4·85 t/ha (P<0·05). In SB05, HI and AGDM were only assessed on the subset of six DH lines and the two parents. On average, drought reduced HI from 0·48 to 0·45 (P<0·01) and AGDM from 18·00 to 16·25 t/ha (P<0·10); the drought×genotype interactions for HI and AGDM were not statistically significant.
Effects of major genes (Rht and B1) and 1BL.1RS on AGDM and HI
In GL03, harvest biomass was lower for Rht-B1b semi-dwarf (−0·74 t/ha), Rht-D1b semi-dwarf (−0·21 t/ha) and dwarf (−2·44 t/ha) lines compared to the tall lines, significantly so in the case of the dwarf lines (P<0·05) (Table 3). Therefore, although reduced height in the dwarf lines raised HI, this was countered by lower biomass (P<0·05), and so the yield overall did not differ compared to the tall lines. In GL03, awns were associated with a small increase in biomass of 0·42 t/ha (2·9%, P<0·05) and there was no irrigation×± awns interaction (Table 4). The 1BL.1RS translocation increased biomass overall by 0·86 t/ha (6·1%), but the irrigation×1BL.1RS translocation was not statistically significant. In SB05, the effects of Rht and awn major genes and 1BL.1RS on HI and biomass could not be quantified, since these traits were only assessed on six DH lines and the two parents.
12/13C isotope discrimination responses to drought
Responses of DH lines to irrigation
For the 33 DH lines common to both site-seasons, drought, overall, reduced Δ13C of grain from 19·8 to 18·7‰ (P<0·001, Table 2). Averaging across site-seasons and irrigation treatments, genotypes differed in the range 19·2–20·5‰ (P<0·001). The irrigation treatment×genotype interaction was not statistically significant (P=0·09). Averaging across site-seasons, there was a positive correlation between Δ13C among DH lines in the irrigated and unirrigated treatments (r=0·84, P<0·001). Genotype rankings were generally consistently expressed in the two site-seasons. Thus, the values of Δ13C for the DH lines measured in GL03 were positively correlated with those measured in SB05 in both the irrigated (r=0·67, P<0·01) and unirrigated (r=0·60, P<0·01) treatments. Nevertheless, the site-season×genotype treatment interaction was statistically significant (P<0·05), indicating some genotypes changed their relative performance across environments.
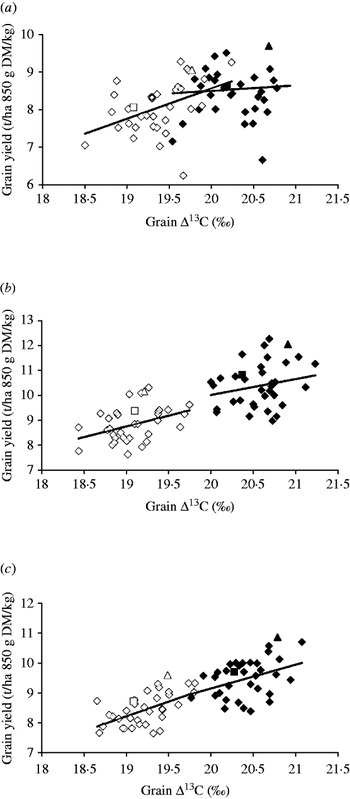
The regression of Δ13C on grain yield in the irrigated and unirrigated treatments is shown in Fig. 2. In each site-season, there was a positive linear relationship in both the irrigated and unirrigated treatments. Averaging across site-seasons, the positive linear relationship of Δ13C on yield explained 0·15 and 0·34 of the variation in grain yield under irrigated and unirrigated conditions, respectively. There was transgressive segregation among the DH lines with on average five lines having higher Δ13C than cvar Beaver (20·1‰) and 11 lines having lower Δ13C than cvar Soissons (19·7‰).
Linear regression among 33 DH lines of the cvars Beaver × Soissons population of grain yield on carbon isotope discrimination (Δ13C) of grain in (a) irrigated (♦; R 2=0·04) and unirrigated (◊; y=0·857x–7·57, R 2=0·17, d.f.=32, P<0·05) treatments at Gleadthorpe in 2002/2003, (b) irrigated (♦; R 2=0·05) and unirrigated (◊; y=0·844x–7·28, R 2=0·16, d.f.=32, P<0·05) treatments at Sutton Bonington 2004/2005, and (c) irrigated (♦; y=0·796x – 6·761, R 2=0·15, P<0·05, d.f.=32) and unirrigated (◊; y=0·987x–10·53, R 2=0·34, d.f.=32, P<0·001) treatments for the mean values averaged over the two site-seasons. Values for cvar Beaver (triangles) and cvar Soissons (squares) are also shown.

Effects of major genes (Rht and awns) and 1BL.1RS on grain Δ13C
In GL03, grain Δ13C was slightly higher in the Rht-D1b semi-dwarf lines (19·95‰) than the tall lines (19·7‰) (P<0·05); the irrigation treatment×Rht group interaction was not significant (Table 3). In SB05, the effect of Rht group was not statistically significant and the groups did not respond differently to drought. Averaging across site-seasons, the Rht-D1b semi-dwarf lines showed slightly higher Δ13C (19·92‰) than the tall lines (19·8‰) (P<0·05); there were no other statistically significant differences among Rht groups, and the irrigation treatment×Rht group interaction was not statistically significant.
The effect of the presence/absence of awns on grain Δ13C was not statistically significant in either site-season or for the average across the two environments, and in all cases the irrigation treatment×presence/absence of awns interaction was not statistically significant (Table 4). In each site-season, the presence of the 1BL.1RS translocation increased grain Δ13C (P<0·001), with an overall increase from 19·7‰ (1B) to 20·0‰ (1BL.1RS) (P<0·001). However, the 1BL.1RS and 1B groups of lines responded similarly to drought.
Specific leaf nitrogen at anthesis
Responses of DH lines to irrigation
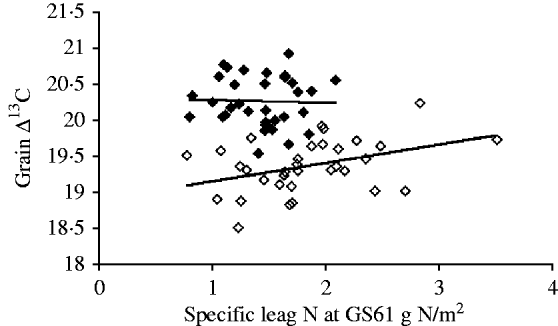
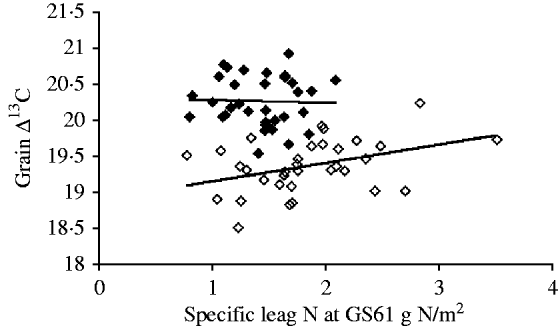
In GL03, drought increased SLN from 1·42 to 1·83 g N/m2 (P<0·05). Averaging across irrigation treatments, the DH lines ranged from 1·03 to 2·23 g N/m2 (P<0·001), and differed in their responses to drought from −1·31 to 0·55 g N/m2 (P<0·001). Under drought there was a positive linear relationship between SLN and Δ13C (R 2=0·15, P<0·01), whereas under irrigation the linear regression of SLN on Δ13C was not statistically significant (Fig. 3).
Linear regression amongst 33 DH lines of the cvars Beaver×Soissons population of specific leaf N content of the flag leaf at GS61 on carbon isotope discrimination (Δ13C) of grain in irrigated and unirrigated treatments at Gleadthorpe in 2002/2003 in irrigated (♦; R 2=0·01) and unirrigated (◊; y=0·254x+10·09, R 2=0·15, d.f.=32, P<0·05) treatments.
Effects of major genes (Rht and awns) and 1BL.1RS on specific leaf nitrogen
There were no statistically significant differences between Rht groups in specific leaf N content or significantly different responses to irrigation (data not shown). The effects of awns and the 1BL.1RS translocation were also not statistically significant (data not shown).
DISCUSSION
The data collected in these experiments allowed consideration firstly of the relationship between yield potential and drought resistance, secondly the potential value of Δ13C of grain as a selection tool for drought resistance and thirdly the effects of major agronomic genes on drought resistance of winter wheat under UK conditions.
Effects of yield potential and flowering date on yield responses
In the present study, the overall yield losses under drought of 0·5 (4·9%) and 1·6 t/ha (15·1%) in GL03 and SB05, respectively, were smaller than typical losses under drought for winter wheat in the UK of c. 2 t/ha (c. 20–30%) (Innes et al. Reference Foulkes, Sylvester-Bradley, Weightman and Snape1985; Bailey Reference Bailey1990; Foulkes et al. Reference Foulkes, Scott and Sylvester-Bradley2002). The high-yielding genotypes under irrigated conditions tended to lose more grain yield under drought consistent with previous reports of positive associations between yield potential and absolute yield loss under drought (Fischer & Maurer Reference Farquhar, O'Leary and Berry1978; Foulkes et al. Reference Foulkes, Sylvester-Bradley, Worland and Snape2007). From the physiological standpoint, it is not surprising that absolute reduction in yield for a given reduction in water resource is strongly influenced by yield potential. In spite of the relatively small average yield losses, the range of yield reductions among the DH lines in the experiments was high as indicated by the strong irrigation treatment×genotype interactions in both years. Flowering dates of DH lines differed among lines by up to 9 days, mainly associated with segregation for the Ppd-D1 gene determining photoperiod insensitivity. Foulkes et al. (Reference Foulkes, Scott and Sylvester-Bradley2004) examined the effects of the Ppd-D1 gene in near-isogenic lines of cvar Mercia and cvar Cappelle-Desprez winter wheats and found no differences in yield responses to drought for early (Ppd-D1) and late (ppd-D1) flowering lines (Foulkes et al. Reference Foulkes, Scott and Sylvester-Bradley2004). It was suggested that there may be a trade-off between early flowering and less extensive rooting. In the present study, there was no relationship between the flowering date and grain yield responses to drought.
Relationships between crop productivity and WUE
In the present study, there was a greater impact of drought on Δ13C of grain in SB05 than GL03. These findings are in general agreement with previous reports indicating a reduction in Δ13C under water-limited compared to well-watered conditions (e.g. Farquhar & Richards Reference Ehdaie, Whitkus and Waines1984; Condon et al. Reference Calderini, Dreccer and Slafer1987; Acevedo Reference Acevedo, Ehrlinger, Hall and Farquhar1993; Merah et al. Reference Lukaszewski1999, Reference Merah, Deleens and Monneveux2001; Richards et al. Reference Richards2002). The analysis of data pooled across the two site-seasons confirmed a positive association between Δ13C and grain yield among genotypes under both drought (P<0·001) and well-watered conditions (P<0·05). Thus, transpiration efficiency was negatively correlated with grain yield. These findings are consistent with previous investigations under well-watered or moderate drought conditions, where a positive relationship between Δ13C determined in leaf or grain and grain yield was previously found for bread and durum wheat (Condon et al. Reference Calderini, Dreccer and Slafer1987, Reference Condon, Richards and Farquhar1993; Morgan et al. Reference Monneveux, Reynolds, Gonzalez-Santoyo, Pena, Mayr and Zapata1993; Ehdaie & Waines 1994; Sayre et al. Reference Richards, Rebetzke, Condon and van Herwaarden1995; Araus et al. Reference Araus, Amaro, Casadesus, Asbati and Nachit1998; Merah et al. Reference Merah, Deleens and Monneveux2002) and barley (Craufurd et al. Reference Condon, Richards, Rebetzke and Farquhar1991; Voltas et al. Reference Villareal, Banuelos, Mujeeb-Kazi and Rajaram1998). However, negative relationships have also been found between grain yield or above-ground biomass and Δ13C under more severe drought (Richards Reference Richards1996; Reynolds et al. Reference Reynolds and Borlaug2007). Thus, selection for low Δ13C of grain (high transpiration efficiency) was associated with yield gains in Australia under severe drought (Rebetzke et al. Reference Rajaram, Villareal and Mujeeb-Kazi2002). The positive relationship between Δ13C and yield in the present study could probably be because genotypes with high Δ13C keep their stomata more open and thus transpire more water (Araus et al. Reference Araus, Villegas, Aparicio, Garcia de Moral, El Hani, Rharrabti, Ferrio and Royo2003; Monneveux et al. Reference Miralles, Katz, Colloca and Slafer2004; Tsialtas & Tokatlidis Reference Tottman2008). The present results imply that under mild UK drought conditions, selection for low Δ13C (high transpiration efficiency) in breeders’ plots would be associated with lower yield under drought, as well as lower yield in favourable seasons. However, the alternative strategy of selecting for high Δ13C may offer some promise as a selection criterion for yield under drought in the UK presumably as an indicator of the ability to access additional water during the grain filling period.
To compare the relative performance of genotypes under drought and favourable conditions, Fischer & Maurer (Reference Farquhar, O'Leary and Berry1978) proposed the use of the stress susceptibility index (SSI):

where Ys is the yield of the individual cultivar under stress, Yp is the yield of cultivar under irrigated conditions and Ysm and Ypm are the mean yields of all cultivars in the trial under stress and non-stress conditions, respectively.
Genotypes with an SSI of less than 1·0 are considered drought resistant, since their relative yield reduction in drought conditions is smaller than the relative mean yield reduction of all genotypes. The SSI is potentially useful for the comparison of drought susceptibility of genotypes, since it is to some extent independent of the positive association between yield potential and absolute yield losses under drought mentioned above. The present results showed that there was a negative correlation between Δ13C and SSI (i.e. a negative association between transpiration efficiency and drought resistance) in GL03 (r=−0·36, P<0·05), but no significant correlation in SB05 (r=0·08). Thus, Δ13C was useful as an indicator of relative performance of genotypes under drought and irrigated conditions in 1 year out of 2 in the present study.
The high correlation between Δ13C among genotypes measured under unirrigated and irrigated conditions (r=0·83) indicates that Δ13C may have been acting as a constitutive trait under mild UK droughts, and that an assessment for this trait under favourable conditions will also be indicative of values under drought. Indeed, there was a positive correlation between yield measured under drought and Δ13C measured under either drought (r=0·58, P<0·05) or well-watered conditions (r=0·33, P<0·05). This is encouraging since it indicates that selection for Δ13C under favourable conditions may be useful for indicating drought performance in breeding programmes with limited resources and unable to conduct trials under both favourable and drought conditions. Four of the 33 lines showed statistically significant negative departures from the overall regression of Δ13C on yield (i.e. data points significantly below the regression line for the positive relationship between Δ13C and yield) in both seasons, demonstrating there are prospects for selecting genotypes with both high yields and moderately high TE in UK adapted germplasm; and these specific lines may merit further investigation to elucidate the underlying mechanisms responsible for these responses.
From the present results, the physiological basis of the differences in Δ13C of grain among the B×S DH lines cannot be certain. Genotypes exhibiting higher Δ13C (and therefore higher stomatal conductance) may be those having better water status, either as a result of constitutive (e.g. phenology and plant size) or stress-adaptive (e.g. osmotic adjustment) traits that allow the crop to escape or resist drought stress (Araus et al. Reference Araus, Slafer, Reynolds and Royo2002). Whatever be the underlying mechanism involved, a genotype able to use more water than another would have more open stomata and therefore a greater Δ13C. Interestingly, the present findings showed a positive correlation between Δ13C and specific leaf N content at anthesis in GL03. The SLN required for potential photosynthetic function under high light levels has been estimated to be c. 1·5–2·0 g N/m2 (Pask Reference Moreno-Sevilla, Baenziger, Peterson, Graybosch and McVey2009), and variation in the present genotypes was in the range 0·68–1·9 and 0·9–3·5 and g N/m2 under irrigated and unirrigated conditions, respectively. It is interesting to speculate that higher N per unit leaf area may have resulted in increased photosynthetic capacity and hence higher stomatal conductance and, in turn, higher Δ13C of grain. In summary, it seems that there may be a trade-off between TE and season-long water use under drought in UK conditions, and the ability to access more water and maintain photosynthesis during grain filling appears to be the principal driver for raising yield under drought rather than higher TE. The present results showed a consistent correlation between Δ13C and grain yield under drought, indicating that this trait may be a useful selection criteria for breeding for improved performance under mild UK droughts, with higher Δ13C indicating an enhanced ability to access water under drought conditions.
Effects of Rht, awns and 1BL/1RS translocation on drought performance
The Norin-10 semi-dwarfing genes Rht-B1b and Rht-D1b are located at homoeologous positions on the short arms of chromosome 4B and 4D, respectively. These genes are associated with reductions in height of c. 150 mm and increases in grain yield due to more grains/m2, resulting mainly from more fertile florets per ear as a consequence of increased assimilate partitioning to the ear during the pre-flowering period (Fischer & Stockman Reference Fischer and Maurer1986; Calderini et al. Reference Carver and Rayburn1995; Miralles et al. Reference Merah, Deleens, Teulat and Monneveux1998). Averaging across years and irrigation treatments, the present results showed the Rht-D1b (semi-dwarf) lines had higher Δ13C of grain and grain yield than the Rht-B1a/Rht-D1a (tall), the Rht-B1b (semi-dwarf) or the Rht-B1b/Rht-D1b (dwarf) group of lines. The Rht-D1b semi-dwarf lines also had higher grain yield (9·50 t/ha) than the tall, Rht-B1b semi-dwarf and dwarf groups of lines. In the previous work on near isogenic lines (NILs) of spring wheat cvar Maringa in California in well-watered field conditions, a decrease in Δ13C of the rachis of 0·21‰ for each of Rht-B1b and Rht-D1b and of 0·62‰ for Rht-B1c (formerly Rht3) compared with the tall control was reported; and under drought field conditions decreases of 0·00, 0·55 and 0·69‰, respectively, were found (Ehdaie & Waines Reference Ehdaie and Waines1996). In two sets of spring wheat isogenic lines for Rht-B1b, Rht-D1b, Rht-B1b/Rht-D1b and the tall control in Australia in field conditions, WUE from stem elongation to maturity decreased as height decreased (Richards Reference Reynolds, Dreccer and Trethowan1992). This was associated with faster growth and higher light interception of the taller lines during early canopy development, resulting in less direct light reaching the soil surface and less evaporation from the soil. Tall wheats also had a slightly higher Δ13C measured in stem material before GS39 than dwarf lines associated with faster expanding leaf canopies, lower photosynthetic capacity per unit area and higher stomatal conductances during early canopy development in tall lines. Foulkes et al. (Reference Flintham, Börner, Worland and Gale2001), in field conditions in the UK, reported higher WUE for the tall cvar Maris Huntsman compared to four Rht-D1b semi-dwarf cultivars and one Rht-B1b semi-dwarf cultivar. Thus, the present finding for a higher Δ13C in Rht-D1b (formerly Rht2) lines compared to the tall control lines is in general agreement with previous findings for higher Δ13C (lower TE) with decreasing plant height. However, the present results indicate that the Δ13C was not significantly different for Rht-B1b lines compared to the tall lines. This may have been because there was a trend for plant height for the Rht-B1b lines (−74 mm) to be reduced by less than that for Rht-D1b lines (−122 mm) compared to the tall lines in the present study. Further work is required to test the extent to which Rht-B1b under UK conditions is associated with both grain yield improvement and effects on Δ13C in winter wheat. The present finding for the dwarf lines to yield similarly to the tall lines may relate to the dwarf lines in this DH population being relatively ‘tall’ dwarfs at an average of 0·62 m in height, which is only slightly below the predicted optimum height of 0·70–0·90 m for grain yield (Flintham et al. Reference Fischer and Stockman1997). In summary, it seems that the introduction of the Rht-D1b gene in the 1970s in UK winter wheat germplasm may have reduced TE likely associated with increases in grain ‘sink-demand’ resulting in higher photosynthetic capacity and higher stomatal conductances during grain growth.
The 1BL.1RS wheat translocation has been extensively used in wheat breeding programmes across the world in recent decades (Lukaszewski Reference Parry, Canziani, Palutikof, van der Linden and Hanson1990; Rajaram et al. Reference Rajaram, Mann, Ortiz-Ferrera, Mujeeb-Kazi and Sakamoto1990). In spring wheat, genes located on the fragment of rye chromosome have been reported to provide wide adaptation (Rabinovich Reference Pask1998), high yield potential (Rajaram et al. Reference Rajaram, Mann, Ortiz-Ferrera, Mujeeb-Kazi and Sakamoto1990; Villareal et al. Reference Verma, Foulkes, Caligari, Sylvester-Bradley and Snape1995, Reference Villareal, del Toro, Mujeeb-Kazi and Rajaram1998) and drought resistance (Villareal et al. Reference Villareal, del Toro, Mujeeb-Kazi and Rajaram1998; Ehdaie et al. Reference Ehdaie and Waines2003). In winter wheat, 1BL.1RS has also been associated with high yield potential (Rajaram et al. Reference Rabinovich1983; Carver & Rayburn Reference Blum1994) and drought resistance (Moreno-Sevilla et al. Reference Morgan, Le Cain, McCaig and Quick1995). Winter wheat cultivars incorporating 1BL.1RS were first released in the UK in the late 1980s to introgress race-specific disease resistance genes on the rye fragment into UK material. Since then most of the disease resistances have been overcome, but there is still interest in whether there is a residual benefit for drought resistance. Foulkes et al. (Reference Foulkes, Sylvester-Bradley, Worland and Snape2007) reported greater biomass with 1BL.1RS compared to the 1B group of lines in both irrigated and unirrigated treatments in two field experiments in 2000/2001 and 2001/2002 examining the cvars Beaver×Soissons population and greater grain yield in one out of the two experiments. That investigation indicated that 1BL.1RS and 1B lines responded similarly to drought and hence 1BL.1RS offered no greater yield advantage under drought than under optimal conditions in the UK environment. The present results are generally consistent with these findings, with 1BL.1RS increasing aerial biomass in GL03 overall by 6·1%; and biomass of the groups of 1BL.1RS and 1B lines responding similarly to drought. There were no effects of 1BL.1RS on grain yield in both experiments in the present study, and again the 1BL.1RS and 1B lines responded similarly to drought. Thus, the present study cannot confirm previous reports of a yield advantage of 1BL.1RS under moisture stress (Villareal et al. Reference Villareal, del Toro, Mujeeb-Kazi and Rajaram1998; Ehdaie et al. Reference Ehdaie and Waines2003). This may relate to differences in drought stress intensity; stress intensity was lower in the present study than in many previous investigations. In each site-season, 1BL.1RS increased grain Δ13C compared to the 1B lines under both irrigated and drought conditions, and the 1BL.1RS translocation appeared to be associated with a decrease in TE in this DH population. Nevertheless, the two groups of lines had similar grain yields. Presumably higher Δ13C with 1BL.1RS was associated with higher stomatal conductance. Possibly, differences in rooting growth among the 1BL.1RS and 1B DH lines may have contributed to such differences in stomatal conductance and Δ13C. In a previous investigation, greater root biomass among isolines of spring wheat cvar Pavon was associated with the presence of 1BL.1RS (Ehdaie et al. Reference Ehdaie and Waines2003), and the present authors in a parallel study in soil columns in the glasshouse found that the cvar Beaver (1BL.1RS) parent had greater root biomass and root length density (root length per unit soil volume) than the cvar Soissons (1B) parent (Aravinda Kumar Reference Aravinda Kumar2006). However, it is not certain why the higher biomass with 1BL.1RS in the present experiments did not translate into greater yield.
Long awns have been shown to be a useful selection indicator in wheat in hot, dry environments (Blum Reference Blum1986). In the UK, winter wheat awnless phenotypes predominate, possibly since desirable genes influencing the flowering date or yield may be linked to the awn inhibitor gene on chromosome 5A, or else awns may have an unknown physiological effect on disease susceptibility which was selected against. Foulkes et al. (Reference Foulkes, Sylvester-Bradley, Worland and Snape2007) found no association between the presence or absence of awns and yield loss for winter wheat under UK drought. The present results also indicated that the presence of awns had no effect on Δ13C and yield loss under drought. Therefore, reported benefits of awns under drought – i.e. high WUE (Blum Reference Bailey and Spackman1985) and cooler canopies (Weyhrich et al. Reference Voltas, Romagosa, Muñoz and Araus1994) – may have less impact under mild UK droughts than more severe droughts worldwide. Overall, the present results for Rht-D1b to confer higher Δ13C and grain yield and for 1BL.1RS to confer higher Δ13C imply modern UK wheat cultivars may have lower WUE than their predecessors, and hence may require more water to fulfil their yield potential. They also imply that future genetic gains in grain yield under both water stressed and favourable conditions may relate to an increased requirement for soil water and in turn suggest that increasing root exploration at depth may be an important criteria for future breeding progress.
Genetic control of Δ13C for grain
In spring wheat, Rebetzke et al. (Reference Rebetzke, Condon, Richards and Farquhar2008) examined three wheat mapping populations (from cvars Cranbrook/Halberd, cvars Sunco/Tasman and cvars CD87/Katepwa) for Δ13C in well-watered environments in Australia. They found that quantitative trait locus (QTL) effects for Δ13C measured on the flag leaf were commonly small, accounting for 0·01–0·10 of the total additive genetic variance, while a number of chromosomal regions appeared in two or more populations (e.g. 1BL, 2BS, 3BS, 4AS, 4BS, 5AS, 7AS and 7BS). They concluded that selection for altered Δ13C in early generations will probably produce correlated changes in Δ13C among inbred lines. In the present study, the number of DH lines for which Δ13C was measured (33) was too few to identify QTL with a high degree of statistical confidence. A QTL analysis was performed using the genetic map of the cvars Beaver×Soissons population reported by Verma et al. (Reference Tsialtas and Tokatlidis2004), and results of that QTL analysis were reported by Aravinda Kumar (Reference Aravinda Kumar2006). The analysis indicated only one QTL for Δ13C with limit of detection >2·0 LOD, which was detected under irrigated conditions in both site-seasons, located on 3BL close the centromere. Further studies are required combining genetics and physiology to refine the location of this QTL and to better understand the way in which alleles associated with QTLs may promote substantial differences in Δ13C underlying WUE in winter wheat.
The authors thank UK government Department of Environment, Food and Rural Affairs for funding projects CC0370 and AR0908; and the Association of Commonwealth Universities and Commonwealth Scholarship Commission for funding the PhD study of Aravinda Kumar.