INTRODUCTION
Coastal areas are among the most productive marine ecosystems (among others: Field et al., Reference Field, Behrenfeld, Randerson and Falkowski1998). Functioning of these coastal systems is determined by the interplay of global drivers with local hydrodynamic and morphological conditions (Cloern & Jassby, Reference Cloern and Jassby2008). The interactions between land, rivers, coastal zones and open waters are complex with transitions being gradual or more abrupt, and reliable proxies for the detection of such gradients in time and space are not easy to find. Exchange of particulate matter between coastal and open waters has been studied for several decades, especially for the highly productive estuarine areas such as the Wadden Sea (Postma, Reference Postma1961, Reference Postma1982, Reference Postma1984; Visser et al., Reference Visser, De Ruijter and Postma1991; van Beusekom & de Jonge, Reference van Beusekom and De Jonge2002). This coastal zone is separated from the North Sea by a chain of barrier islands bordering the Dutch, German and Danish coastline. The Wadden Sea is one of the largest estuarine coastal systems worldwide; it fulfils an important nursery function for commercial and non-commercial fish species and provides an important feeding area for migrating coastal birds (for overviews see Zijlstra, Reference Zijlstra1972; Wolff, Reference Wolff1983).
The productivity of the Wadden Sea is mainly the result of pelagic and benthic primary production by microalgae, which is partly fuelled by the import of nutrients and accumulating organic matter from the North Sea (Verwey, Reference Verwey1954; Postma, Reference Postma1984; van Beusekom et al., Reference van Beusekom, Brockmann, Hesse, Hickel, Poremba and Tillmann1999). The strong impact of increased nutrient loads from rivers into the area in the 1970s–1980s (e.g. de Jonge et al., Reference de Jonge, Essink, Boddeke, Best and Bakker1993; van Raaphorst & de Jonge, Reference van Raaphorst and de Jonge2004; Philippart et al., Reference Philippart, Beukema, Cadée, Dekker, Goedhart, van Iperen, Leopold and Herman2007) on primary and secondary production in the western Wadden Sea (Beukema & Cadée, Reference Beukema and Cadée1986; Beukema et al., Reference Beukema, Honkoop, Dekker, Baden, Phil, Rosenberg, Strömberg, Svane and Tiselius1998) illustrates the importance of variation in local conditions on productivity and ecosystem functioning. However, to what extent the exchange and input of organic matter from the North Sea is spatially and temporally contributing to these local conditions and productivity of this shallow coastal sea remains an open issue.
Nutrient budgets of the western Wadden Sea suggest a relatively limited contribution of imported organic nitrogen and phosphorus from the North Sea compared with the import by rivers (van Raaphorst & van der Veer, Reference van Raaphorst and van der Veer1990; Philippart et al., Reference Philippart, Cadée, van Raaphorst and Riegman2000). Van Beusekom et al. (Reference van Beusekom, Buschbaum and Reise2012) state that local nutrient dynamics are mainly driven by organic matter import from the North Sea (e.g. van Beusekom & de Jonge, Reference van Beusekom and De Jonge2002) and, as a consequence, the Wadden Sea should be considered to be predominantly heterotrophic, i.e. consuming more organic matter through respiration than produced through local photosynthesis (e.g. Verwey, Reference Verwey1954; Postma, Reference Postma1984; van Beusekom et al., Reference van Beusekom, Brockmann, Hesse, Hickel, Poremba and Tillmann1999). These different views might be related to the time frame of the various studies, e.g. before, during or after the peak in eutrophication in the 1980s (van Raaphorst & de Jonge, Reference van Raaphorst and de Jonge2004). This at least warrants a re-examination of the importance of exchange and import from the North Sea and to what extent spatial and temporal variation does occur.
Identifying the importance of input of the North Sea requires identifying of the mixing and the area of exchange between the Wadden Sea and the North Sea by an inert tracer with sufficient variation between endmembers and robust in time and space. Suspended particulate matter (SPM) is more or less inert, but exhibits a strong spatial and temporal variability both in amount and size composition in the North Sea (Postma, Reference Postma1981; van Raaphorst et al., Reference van Raaphorst, Philippart, Smit, Dijkstra and Malschaert1998) and especially inside the Wadden Sea (e.g. Postma, Reference Postma1961). Despite these disadvantages, cross-shore gradients in suspended particulate matter showed on average a minimum outside the Wadden islands, at ~50–100 km from the shore (Postma, Reference Postma1981; Visser et al., Reference Visser, De Ruijter and Postma1991). A compilation of scarce field measurements and satellite information on SPM concentrations revealed a narrow turbidity minimum zone of a few kilometres width just outside the barrier islands of the Wadden Sea extending from the Netherlands to Denmark (van Raaphorst et al., Reference van Raaphorst, Philippart, Smit, Dijkstra and Malschaert1998), which was considered to represent the boundary between coastal Wadden Sea and open North Sea waters. This has led to the confirmation of the so-called ‘line-of-no-return’ in front of the Wadden Sea postulated by Postma (Reference Postma1984). The boundary is enhanced due to the residual transport in north-easterly directions that decreases the exchange between the water masses and increases the accumulation of suspended matter in the coastal zone (de Jonge & de Jong, Reference de Jonge and de Jong2002). However, it is unknown how well defined this boundary is and, if present, if this boundary shows spatiotemporal variation, e.g. as a result of variation in temperature, wind or rainfall (Postma, Reference Postma1984).
For identification and an analysis of spatial and temporal variability in exchange of SPM, a precise tracer with high temporal resolution is required. Salinity potentially is such an inert tracer, and differences in salinity between open North Sea and the estuarine Wadden Sea are large enough. However, salinity in the area of interest is not only influenced by freshwater input directly into the Wadden Sea via Lake IJssel, the most prominent freshwater input, but also by a narrow band of coastal water with Rhine River input from the south (Zimmerman & Rommets, Reference Zimmerman and Rommets1974; Postma, Reference Postma1982; Philippart, Reference Philippart1988; de Jonge, Reference de Jonge1990; de Vries et al., Reference de Vries, Duin, Peeters, Los, Bokhorst and Laane1998) as well as smaller canals and rivers. Due to these different sources and the fact that the most prominent freshwater sources are separated from the area by a dyke and freshwater inflow is controlled via sluices, the salinity in the area does not follow the classical estuarine pattern with a gradual salinity gradient. This means that the hydrodynamic situation prevents the use of salinity as a mixing tracer in this area. Also nutrient concentrations are not suited as tracers due to their high turnover rate, and are therefore not inert over longer time scales (Pinckney et al., Reference Pinckney, Paerl, Tester and Richardson2001).
Phytoplankton seems be an alternative candidate. Comparison of chlorophyll a time series has revealed different patterns of phytoplankton biomass variability, and also species composition in oceans and coastal waters (Cloern & Jassby, Reference Cloern and Jassby2010; Winder & Cloern, Reference Winder and Cloern2010). Phytoplankton species composition might be a more sensitive tracer than biomass as each water mass with its own seasonal fluctuations in environmental conditions and biological forcing will contain its own unique plankton community due to specific physiological preferences and tolerances (Hutchinson, Reference Hutchinson1961; Cloern & Dufford, Reference Cloern and Dufford2005; Carstensen et al., Reference Carstensen, Klais and Cloern2015). Deviations from the ‘classical seasonal pattern’, in the North Sea of a spring bloom dominated by diatoms followed by a summer bloom of dinoflagellates (Alvarez-Fernandez et al., Reference Alvarez-Fernandez, Lindeboom and Meesters2012; Carstensen et al., Reference Carstensen, Klais and Cloern2015), might then be indicative for potential boundaries between water masses exchanging SPM in the coastal zone.
If indices based on phytoplankton species richness are used as a tracer we face a major problem, as species identification of all algae within a sample is often incomplete (Zingone et al., Reference Zingone, Harrison, Kraberg, Lehtinen, McQuatters-Gollop, O'Brien, Sun and Jakobsen2015). A solution is a reduction of the taxonomic resolution to family or genus level to make the dataset more homogeneous and more robust to variations in species’ identification (Heino & Soininen, Reference Heino and Soininen2007; Ptacnik et al., Reference Ptacnik, Solimini, Andersen, Tamminen, Brettum, Lepistö, Willén and Rekolainen2008; Carneiro et al., Reference Carneiro, Nabout, Galli Vieira, Lodi and Bini2013; Olli et al., Reference Olli, Trikk, Klais, Ptacnik, Andersen, Lehtinen and Tamminen2013). This implies, however, that algae that were not identified up to this level are subsequently excluded from further analyses. In order to keep the samples as complete as possible, we decided to use phytoplankton order richness that was calculated as the number of orders of which phytoplankton species or species groups were found in a sample. We assumed that this index still contains the information on seasonality on phytoplankton community structure, whilst the possible bias as a result of reducing the actual sample size is relatively low.
Applying the phytoplankton order richness as a tracer to identify the area of exchange between the Wadden Sea and the North Sea, including its spatial and temporal variability, requires long-term datasets that are consistently collected and analysed without any methodological changes in time. Within the framework of the Dutch national marine monitoring program (www.waterbase.nl), phytoplankton species composition was determined along two transects from the Dutch coast (including the Wadden Sea) to the central North Sea and consistently analysed since 2000. For each sample, the order richness of diatoms and flagellates was calculated as the number of orders of which phytoplankton species of these functional groups were present. Diatoms and flagellates were selected because they are two of the most species-rich groups of the phytoplankton (Guiry, Reference Guiry2012) and therefore expected to be most sensitive to variations in environmental conditions. We used the order richness dataset to examine (i) if there is a seasonality in the order richness of phytoplankton, and, if so, (ii) if there are differences in seasonality from the coast (Wadden Sea) to the central North Sea, (iii) if there are specific spatial patterns in this seasonality which covary with spatial variation in environmental conditions such as the ‘line of no return’, and (iv) if seasonal patterns in order richness can be attributed to specific phytoplankton groups related to environmental conditions.
MATERIALS AND METHODS
Study area
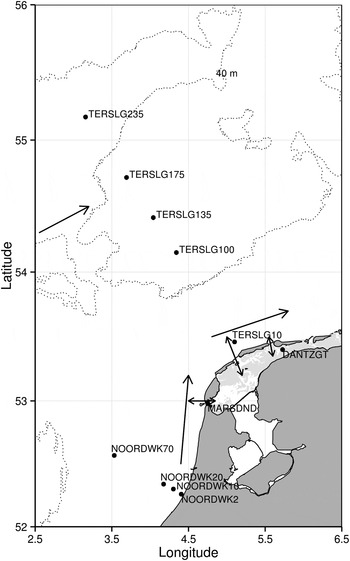
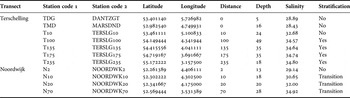
The stations used in this study were part of the Dutch national marine monitoring programme (www.waterbase.nl) and located at two transects perpendicular to the Dutch coast with one (‘Terschelling’) off the Wadden Sea island Terschelling and the other (‘Noordwijk’) just north of the outflows of the rivers Rhine and Meuse (Figure 1). In addition, information on phytoplankton species composition from two stations within the Wadden Sea (‘Danziggat’ (TDG), ‘Marsdiep Noord’ (TMD)) was added. The numbering of the stations at these transects reflects their distance (km) to the coastline, e.g. sampling station ‘T100’ is located 100 km from the shoreline of the island of Terschelling.
Map of study area with phytoplankton sampling stations (red points) and residual currents (black arrows; van Raaphorst et al., Reference van Raaphorst, Philippart, Smit, Dijkstra and Malschaert1998), see Table 1 for description of stations.

The Terschelling transect covers a range of environmental conditions (Figure 1 and Table 1) from shallow permanently mixed waters in the coastal zone (‘T10’) via the relatively shallow Oyster Grounds and a deeper channel (around 50 m) with mostly muddy ground and summer stratification (‘T100’, ‘T135’) to the Dogger Bank that is a really shallow (18 m) sand bank in the middle of the central North Sea (‘T235’). Except for the ‘T10’, which is closest to the coast, thermal stratification occurs on all stations during summer (Baretta-Bekker et al., Reference Baretta-Bekker, Baretta, Latuhihin, Desmit and Prins2009).
Names, codes (1: this paper; 2: original data base RWS) and geographic position (latitude in °N; longitude in °E) of sampling stations of phytoplankton with their distance to shore (in km), depth (in m), average salinity (in PSU) and indication if summer stratification occurs or not as obtained from Otto et al. (Reference Otto, Zimmerman, Furnes, Mork, Saetre and Becker1990).

The Noordwijk transect ranges from the coastal zone to 70 km offshore (‘N70’). Except for the shallowest station (‘N2’) all stations are in permanently mixed waters (Figure 1). At this transect, thermal and haline stratification occur intermittently for short periods (Baretta-Bekker et al., Reference Baretta-Bekker, Baretta, Latuhihin, Desmit and Prins2009).
Sampling
The data used in this study are part of the Dutch monitoring programme that is executed by the Dutch Ministry of Transport and Public Works. Methods of sampling and counting of the samples were described in detail by Prins et al. (Reference Prins, Desmit and Baretta-Bekker2012). The data were accessed through the national database (DONAR, www.waterbase.nl) and cell counts were separated into taxonomic groups (in this case Order). Taxonomic classification for each (group of) species was obtained from Koeman et al. (Reference Koeman, Brochard, Loonen and Fockens2005) and the database WoRMS (World Register of Marine Species; WoRMS Editorial Board 2015).
Statistical analysis
Data exploration was applied following the protocol described in Zuur et al. (Reference Zuur, Ieno and Elphick2010). Time series were plotted for each location and inspected for outliers and zero inflation.
Spatial and temporal trends and variability in phytoplankton order richness was analysed by testing a set of different models. Since the order richness is a count, a Poisson distribution with a log-link was used. This means that the basic model is of the form:
 $${\rm Order}\;{\rm richness}_{it} \sim {\rm Poisson}\left( {\mu _{it}} \right)$$
 $$E({\rm Order}\;{\rm richness}_{it}) = \mu_{it}$$
 $$\mu _{it} = {\rm exp}\left( {\eta _{it}} \right)$$
Order richness it is defined here as the number of taxonomical orders for which phytoplankton of a taxonomic group (i.e. diatoms or flagellates) was found at location i at time t. The predictor function μ it is a function of the covariate terms representing a long-term trend, seasonality and location. Due to the non-linearity of seasonal patterns, generalized additive models (GAM) were applied (Wood, Reference Wood2006; Zuur et al., Reference Zuur, Hilbe and Ieno2013, Reference Zuur, Saveliev and Ieno2014).
The basic model was of the following form:
 $$\eta _{it} = \alpha + f\,({\rm DayInSeason}_{t)} + {\rm factor}({\rm Year}_t ) + {\rm Location}_i + \varepsilon _{it} $$
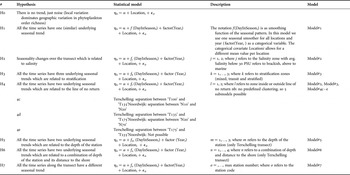
The notation f(DayInSeason t ) is a smoothing function of the seasonal pattern. In model M 1 we use one long-term smoother for all the locations (i.e. the Year i term) and also one seasonal smoother for all locations. The categorical covariate Location i allows for a different mean value per location. This basic model was subsequently adjusted to test the different hypotheses (see ‘Model selection’ and Table 2).
Hypotheses and statistical models for patterns in seasonality in phytoplankton order richness (η it ) along a transect.

The time series were highly irregularly spaced in time, and sampling days differed per location, so the auto-correlation function could not be used. Therefore, a variogram was used via the gstat package (Pebesma, Reference Pebesma2004) in R to assess temporal and spatial residual correlation. Variograms of Pearson residuals from each location did not show temporal correlation. However, when all residuals were combined, temporal correlation up to 6 days (indicating spatial correlation) were found and therefore a spatially correlated residual term was added and fitted to all models using integrated nested Laplace approximation via R (INLA, Rue et al., Reference Rue, Martino and Chopin2009, Reference Rue, Martino, Lindgren, Simpson, Riebler and Krainski2015).
As in other Bayesian approaches, INLA estimates the posterior distribution of all random effects and parameters that are included in the model. It can handle different distributions as well as complex temporal and spatial correlations. The tools available for smoothing techniques in the current version of INLA are limited, especially for interaction terms between smoothers and categorical variables. However, the INLA package allows specification of a smoother in terms of its basis functions. Most smoothers can be written as X × b + Z × u, where the us as normally distributed random intercepts, see Zuur et al. (Reference Zuur, Saveliev and Ieno2014) for a detailed explanation. This notation is accepted by INLA. Here we used 35 knots (Ruppert et al., Reference Ruppert, Wand and Carroll2003) and O'Sullivan splines as the most widely used smoother functions and being implemented into the mgcv package (Wand & Ormerod, Reference Wand and Ormerod2008). For models with interactions between the smoother and the categorical variable location or group, the matrices X and Z are defined as block diagonal matrices.
Model selection
Outcomes of fits of different models were compared to examine if seasonal patterns in the phytoplankton order richness of diatoms and flagellates at stations along the two transects perpendicular to the coastline could be best explained:
-
(i) by local variation dominating the geographic variation in phytoplankton order richness (null hypothesis), or
-
(ii) by one common seasonality pattern for all stations within a transect (Hypothesis 1), or
-
(iii) by a gradual shift in seasonality from the central North Sea to the coast (Hypothesis 2), or
-
(iv) by groups of seasonal patterns related to specific spatial processes such as summer stratification or the ‘line of no return’ (Hypotheses 3–4), or
-
(v) by groups of seasonal patterns related to specific physical properties such as water depth and distance to the shore (Hypotheses 5–6, only possible for the Terschelling transect), or
-
(vi) by local seasonal variation dominating variation at large spatial scales (Hypothesis 7; Table 2).
Models fitted with the INLA package were compared by the DIC (Deviance Information Criterion). DIC is the Bayesian equivalent to the Akaike's information criterion (AIC), a tool to measure the goodness-of-fit of an estimated statistical model and model complexity. If competing models are ranked according to their DIC, the one having the lowest DIC is the best. Differences (ΔDIC = DIC i − DICmin) between the DIC of a particular model (DIC i ) and that of the best model (DICmin) of more than 10 might definitely rule out the particular model i with the higher DIC, and differences between 2 and 10 imply substantially less good fit of the particular model compared with the best model. If the difference in DIC is less than 2, then the fit of the particular model is considered to be comparably good as that of the best model (Burnham & Anderson, Reference Burnham and Anderson2002). In case one of these two models is simpler than the other, this one should be considered being the best. However, if models with DIC differences of less than 2 are comparably complex, then there is no best model. The likelihood of a particular model i to be the best one was calculated following Burnham & Anderson (Reference Burnham and Anderson2002) by applying the following formula:
 $${\rm Likelihood} = {\rm exp}\left( {\displaystyle{{{\rm DIC}_{{\rm min}} - {\rm DIC}_i} \over 2}} \right).$$
where DICmin is the lowest found DIC of the different models tested and DIC i is the DIC of the model i for which the likelihood is calculated.
RESULTS
Phytoplankton order richness
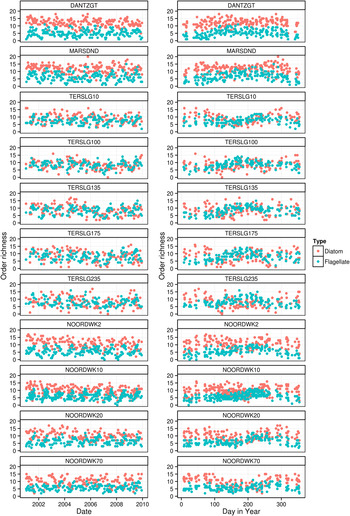
A total of 26 different orders of diatoms were found within the study area and study period, of which six were only found occasionally (Achnanthales, Aulacoseriales, Corethales, Licmophorales, Striatellales and Thalassiophysales, online Appendix 1). Several orders (among others Anaulales, Centrales and Thalassiosirales) were more abundant close to the shore than further offshore. For diatoms, the highest number of orders (20) was found at the ‘Marsdiep Noord’ station on 17 October 2005, and the lowest (0) at the stations ‘T100’ and ‘T235’ on 2 May 2007. For diatoms, the order richness showed a seasonal pattern that differed spatially (Figure 2). The Wadden Sea stations (‘TMD’ and ‘TDG’) had the highest order richness in summer/autumn. At the Terschelling transect, the station 10 km off the coast showed the highest order richness of diatoms in winter and the stations at 100, 135 and 175 km off the coast showed a less clear seasonal pattern (Figure 2, right). The diatoms at the station at 235 km off the coast (‘T235’) had relatively low order richness in summer, but not as low as at the ‘T10’ station (Figure 2, right). The Noordwijk transect showed low order richness in diatoms at all stations during summer (Figure 2).
Order richness (η it ) based on the number of taxonomic orders of diatoms and flagellates in a sample for stations in the Wadden Sea and North Sea for the period 2001–2009 (left panels) and during the season (right panels).

For flagellates, a total number of 31 different orders were found of which 13 occurred only occasionally (Chlorodendrales, Coccidiniales, Coccosphaerales, Euglenida, Floenciellales, Isochrysidales, Mischococcales, Nephroselmidales, Pyrocystales, Synurales, Synacosphaerales, Thannatomonadida and Volvocales, online Appendix 2). Several orders of flagellates had a higher presence closer to the shore (Noctilucales and Sphaeropleales), whilst others showed a clear offshore preference (Dinophysiales, Gonyaulacales and Prorocentrales). Flagellates order richness showed less variation than that of diatoms with a maximum value of 16 orders at ‘T235’ (21 February 2006, 22 June 2004 and 2 May 2007). The minimum order richness in flagellates (0) was found at stations ‘N10’ and ‘N2’ on various dates. For flagellates, the seasonal pattern appeared to be less variable than for diatoms and more or less similar between the stations with a relatively high order richness found in summer compared with winter (Figure 2).
Spatial and temporal trends
TERSCHELLING TRANSECT
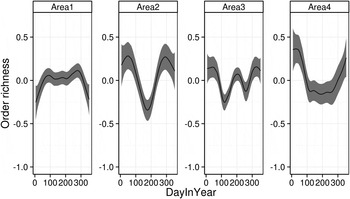
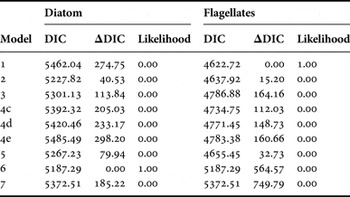
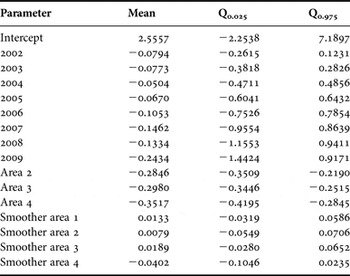
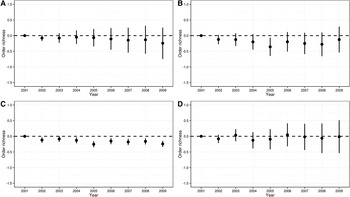
For diatoms, spatial and temporal trends in order richness was best explained by Model #6 with a grouping of stations into four areas according to the combination of water depth and the distance to the shore (Table 3). The difference in DIC compared with the next best model (#2) was more than 40, indicating that other explanations (Models) were not competing with Model #6. The results of this model indicated a seasonal pattern with generally high order richness in summer in the Wadden Sea (Area 1) compared with the three areas in the North Sea (Figure 3). In the North Sea, lowest summer values were found at ‘T10’ (Area 2). The other stations at this transect showed a pattern with a peak in the middle of the summer and two phases with lower order richness and the furthest offshore station, which was more pronounced in Area 3 (‘T100’, ‘T135’ and ‘T175’) than in Area 4 (‘T235’) (Figure 3). For this model, the diatom order richness in Area 1 (Wadden Sea) was significantly higher compared with the other areas in the North Sea and appeared to decrease within the North Sea from inshore to offshore areas (Table 5). The annual estimates for seasonality showed no significant difference between the year 2001 and the other years, implying the seasonal variation in order richness of diatoms was more or less similarly strong for all years (Table 5, Figure 7A).
Seasonal smoother for order richness in diatoms at the Terschelling transect for four different areas as described by Model #6, i.e. Area 1 (‘TMD’, ‘TDG’), Area 2 (‘T10’), Area 3 (‘T100’, ‘T135’, ‘T175’) and Area 4 (‘T235’).

DIC and likelihood of the different models at the Terschelling transect for diatoms and flagellates, ΔDIC refers to the difference of the DIC from this model to the one with the lowest DIC.

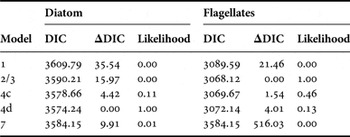
DIC and likelihood of the different models at the Noordwijk transect for diatoms and flagellates ΔDIC refers to the difference of the DIC from this model to the one with the lowest DIC.

Posterior estimates (mean and 95% credibility interval) of model parameters of Model #6 for diatoms, Area 1 refers to the Wadden Sea stations (‘TMD’, ‘TDG’), Area 2 refers to ‘T10’, Area 3 to ‘T100’, ‘T135’ and ‘T175’ and Area 4 to ‘T235’. The parameters values of the year 2001 and Area 1 (‘Wadden Sea’) are zero by definition.

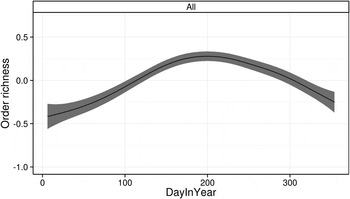
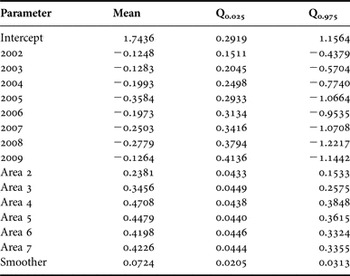
For flagellates, Model #1 with only one seasonal trend with a peak in summer and lower values in winter for all stations had the lowest DIC (Table 3; Figure 4). The DIC of the next best model was considerably higher (>10), so Model #1 was selected as the best model. The posterior estimates of model parameters of this model indicated, however, that the flagellate order richness at Area 1 (‘TDG’) was significantly lower than that at all other stations (Table 6). Annual signals showed no significant differences between years, implying that all years experienced more or less the same strength in seasonality in order richness of flagellates (Table 6, Figure 7B).
Seasonal smoother for order richness in flagellates at the Terschelling transect as described by Model #1, i.e. one common smoother for seasonality at all stations in the Wadden Sea and North Sea.

Posterior estimates (mean and 95% credibility interval) of model parameters of Model #1 for flagellates, Area 1 refers to ‘TMD’, Area 2 to ‘TDG’, Area 3 to ‘T10’, Area 4 to ‘T100’, Area 5 to ‘T135’, Area 6 to ‘T175'and Area 7 to ‘T235’. The parameters values of the year 2001 and Area 1 (station ‘TMD’) are zero by definition.

NOORDWIJK TRANSECT
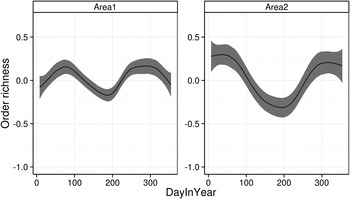
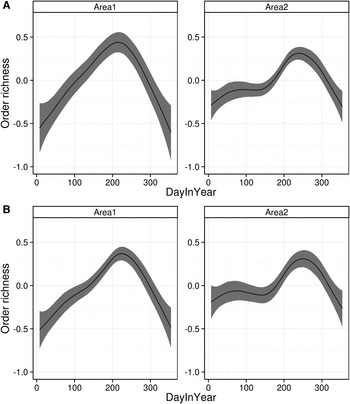
For diatoms, the model with the lowest DIC was Model #4d (Table 4), i.e. one of the models where the grouping of the stations was tested according to a possible presence of a ‘line-of-no-return’. The difference in DIC between this model and other second best model (Model #4c) was larger than 2, so Model #4d was considered to be the best model. This model implied that the pattern in seasonality shifted between station ‘N20’ and ‘N70’, with the relatively low diatom order richness in summer at the outermost station of the Noordwijk transect (Area 2; ‘N70’) being more pronounced than those in Area 1, comprising the other three stations closer to the shore (Figure 5) and having an overall lower order richness (Table 7). Compared with the year 2001, the overall order richness in diatoms was significantly lower in the years 2005 and 2009 (Table 7, Figure 7C).
Seasonal smoother for order richness in diatoms at the Noordwijk transect for two different areas as described by Model 4d, i.e. Area 1 (‘N2’, ‘N10’, ‘N20’) that is assumed to be inside the ‘line-of-no-return’ and Area 2 (‘N70’) that is assumed to be outside the exchange area.

Posterior estimates (mean and 95% credibility interval) of model parameters of Model #4d for diatoms, Area 1 refers to ‘N2’, ‘N10’ and ‘N20’, Area 2 to ‘N70’. The parameters values of the year 2001 and Area 1 (‘N2’, ‘N10’, ‘N20’) are zero by definition.

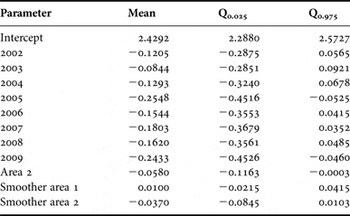
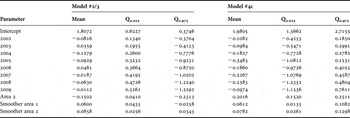
With regard to flagellates, the combined Model #2/Model #3 had the lowest DIC, however the difference in DIC to the next best model was less than 2 (Model #4c). As both models have the same complexity they should be treated as equally good in their prediction of the seasonal pattern (Table 4). Model #2/3 implied that the pattern in seasonality shifts between station ‘N2’ (Area 1, where there is no stratification) and Area 2 (‘N10’, ‘N20’ and ‘N70’) that is considered as a transition zone between waters that are continuously mixed and that experience summer stratification (Table 8) with a peak in late summer order richness being higher in the outermost stations (Figure 6A). The most inshore station ‘N2’ had overall higher order richness in flagellates (Table 8). Model #4c implied that the pattern in seasonality shifts between Area 1 (‘N2’ and ‘N10’) and Area 2 (‘N20’ and ‘N70’; Table 8) with a peak in late summer order richness being higher in the outermost stations (Figure 6B). The most inshore station ‘N2’ had overall higher order richness in flagellates (Table 8). In both models seasonal signals did not significantly differ between years and showed the same overall pattern (Table 8, Figure 7D; only graph from best model shown).
Seasonal smoother for order richness in flagellates at the Noordwijk transect for two different areas as described by (A) Model 2/3, i.e. Area 1 (‘N2’) that is permanently mixed and Area 2 (‘N10’, ‘N20’, ‘N70’) that occasionally experiences thermal and haline stratification and (B) Model 4c, i.e. Area 1 (‘N2’ and ‘N10’) and Area 2 (‘N20’, and ‘N70’).

The year effect of the various models, i.e. Model #6 for diatom order richness along the Terschelling transect (A), Model #1 for flagellate order richness along the Terschelling transect (B), Model #4d for diatom order richness along the Noordwijk transect (C) and Model #2/Model #3 for flagellate order richness along Noordwijk transect (D).

Posterior estimates (mean and 95% credibility interval) of model parameters of Model #2/3 and Model #4c for flagellates, Area 1 refers to ‘N2’ in Model #2/3 and ‘N2’ & ‘N10’ in Model #4c and Area 2 to ‘N10’, ‘N20’ and ‘N70’ in Model #2/3 and ‘N20’ and ‘N70’ in Model #4c. The parameter values of the year 2001 and Area 1 (‘N2’ or ‘N2'and ‘N10’) are zero by definition.

DISCUSSION
The seasonality patterns in phytoplankton order richness along transects perpendicular to the shore, both for diatoms and flagellates, suggest that it might be a promising tracer for identifying mixing of particulate organic matter between coastal and open waters. Several other studies indicate that the number of species is related to the general functioning of an ecosystem (Naeem et al., Reference Naeem, Thompson, Lawler, Lawton and Woodfin1994) such as nutrient cycling, production and resource use efficiency (Loreau et al., Reference Loreau, Naeem, Inchausti, Bengtsson, Grime, Hector, Hooper, Huston, Raffaelli, Schmid, Tilman and Wardle2001; Naeem, Reference Naeem2009; Finkel et al., Reference Finkel, Beardall, Flynn, Quigg, Rees and Raven2010). However, not only richness on a species level can be used to assess such ecological relationships (Gaston et al., Reference Gaston and Williams1993). The higher taxon approach was first used for terrestrial ecosystems (Balmford et al., Reference Balmford, Green and Murray1996 and literature therein) and is now also transferred to aquatic ecosystems (Passy & Legendre, Reference Passy and Legendre2006; Heino & Soininen, Reference Heino and Soininen2007; Gallego et al., Reference Gallego, Davidson, Jeppesen, Pérez-Martinez, Sánchez-Castillo, Juan, Fuentes-Rodríguez, León, Peñalver, Toja and Casas2012; Carneiro et al., Reference Carneiro, Nabout, Galli Vieira, Lodi and Bini2013; Mueller et al., Reference Mueller, Pander and Geist2013; Machado et al., Reference Machado, Borges, Carneiro, de Santana, Vieira, de Moraes Huszar and Nabout2015). Several studies dealing with the higher taxon approach in freshwater algae (e.g. Heino & Soininen, Reference Heino and Soininen2007; Carneiro et al., Reference Carneiro, Nabout, Galli Vieira, Lodi and Bini2013) and marine phytoplankton (e.g. Ptacnik et al., Reference Ptacnik, Solimini, Andersen, Tamminen, Brettum, Lepistö, Willén and Rekolainen2008; Olli et al., Reference Olli, Trikk, Klais, Ptacnik, Andersen, Lehtinen and Tamminen2013, Reference Olli, Ptacnik, Andersen, Trikk, Klais, Lehtinen and Tamminen2014) showed that higher taxa can be used to assess eutrophication state and resource use. Also our findings with regard to exchange of particulate matter based upon seasonality patterns in order richness underlines the strength of the higher taxon approach.
For the two transects (Terschelling, Noordwijk) and the two phytoplankton groups (diatoms, flagellates), there was no common model that could explain the observed seasonality in phytoplankton order richness. For the group of Terschelling stations (in total six stations, including two stations in the Wadden Sea), seasonality in order richness varied according to depth and distance to shore for diatoms and was uniform along this transect for flagellates. At the four Noordwijk transect stations, there appeared to be two groups in seasonality with the outermost station (‘N70’) being separated from the rest for the diatoms, and the seasonality at innermost non-stratified station (‘N2’) being different from the rest for the order richness in flagellates. This implies that the seasonality pattern in diatom order richness at Noordwijk was not explained by ambient environmental conditions with respect to depth, distance to shore, salinity and stratification, and may therefore be the result of a ‘line-of-no-return’ between 20 and 70 km from the shore. For the Terschelling transect, there are no stations at comparable distances from the shore and there appears to be a change in seasonality of diatoms somewhere between 10 and 100 km. This implies that a ‘line-of-no-return’ might also exist in this part (10–100 km) of the Terschelling transect. Our findings on a possible ‘line-of-no-return’ between 20 and 70 km from the shore at Noordwijk and between 10 and 100 km at Terschelling is in line with previous observations of a minimum in suspended particulate matter (SPM) concentrations at 50–100 km from the shore (Postma, Reference Postma1981; Visser et al., Reference Visser, De Ruijter and Postma1991). The sampling grid of this dataset was, however, not fine enough to narrow down the exact position of the ‘line-of-no-return’.
Within coastal waters, the phytoplankton spring bloom is generally dominated by large, fast-growing diatoms, followed by a number of summer and autumn blooms comprised of diatoms and flagellates (Tett et al., Reference Tett, Gowen, Grantham, Jones and Miller1986; Mallin et al., Reference Mallin, Paerl and Rudek1991; Carstensen et al., Reference Carstensen, Klais and Cloern2015). Diatoms often dominate phytoplankton blooms in the coastal zone because they are so highly adaptable to different environmental conditions such as varying light and other physical stress (Armbrust, Reference Armbrust2009; Carstensen et al., Reference Carstensen, Klais and Cloern2015). As phytoplankton blooms are mostly dominated by a single species (e.g. the flagellate Phaeocystis globosa), highest observed order richness is expected outside blooms but still within the growing season. Different patterns in seasonality in the order richness (as, for example, found for diatoms along the Terschelling transect) might, therefore, reflect different timing in (low diversity) blooms. Different strength in seasonality (as, for example, found for diatoms along the Noordwijk transect) might reflect different strength of coinciding blooms at these stations. In addition, however, higher overall densities increase the probability of finding more species in a sample of a given volume (Gotelli & Colwell, Reference Gotelli and Colwell2001).
In Dutch coastal waters, dinoflagellates tend to have a higher biomass in summer-stratified (lower turbulence) offshore stations, thus attaining highest biomass on stations further from the coast where thermal and/or haline stratification occurs (Baretta-Bekker et al., Reference Baretta-Bekker, Baretta, Latuhihin, Desmit and Prins2009). However, biodiversity is expected to be low during blooms (Baretta-Bekker et al., Reference Baretta-Bekker, Baretta, Latuhihin, Desmit and Prins2009), with the lowest order richness of flagellates in summer months. Our results contradict these expectations, as we find the highest order richness in flagellates at both transects in summer. We also found an increase in seasonality along the Noordwijk transect, being subject to short periods of intermittent thermal and haline stratification. This signal of stratification was not observed for flagellate order richness along the Terschelling transect where thermal stratification occurs on almost all (with exception of ‘T10’) stations during summer. During periods of haline stratification, phytoplankton samples taken from the water surface at ‘N2’ might have contained (more) freshwater flagellates closer to shore. This is in agreement with the gradual decline of the presence of the freshwater order ‘Sphaeropleales’ between ‘N2’ and ‘N20’ at the Noordwijk transect (see online Appendix 2). From these observations, it appears that seasonality in order richness in flagellates is more driven by an overall seasonality in phytoplankton communities, driven by nutrient cycling and inflow of freshwater algae, than by thermal stratification during summer.
Our findings suggest that patterns in seasonality in order richness of diatoms and flagellates reflect different water masses and drivers of phytoplankton dynamics along the coastline of the Netherlands. The Wadden Sea was found to be clearly different from the North Sea, implying that seasonality in Wadden Sea phytoplankton is at least partly driven by local environmental conditions and/or that the exchange between the Wadden Sea and the North Sea is limited, in particular during summer. The stations ‘N2’, ‘N10’, ‘N20’ and ‘T10’ appear to be at the inside of the ‘line-of-no-return’. Similarity in seasonality in diatom order richness at ‘T100’, ‘T135’ and ‘T175’ compared with the more shallow stations in the close surroundings suggests that depth is a strong driver for phytoplankton dynamics and that this signal is not diffused as the result of mixing along the transect. Our findings with regard to clear grouping of stations based on seasonality and long-term variation in order richness of diatoms and flagellates underline the potential of using information at higher taxonomic levels to detect spatial and temporal patterns in mixing. In order to take full advantage of this technique, a grid on order richness with a higher resolution in time and space is required.
SUPPLEMENTARY MATERIAL
The supplementary material for this article can be found at https://doi.org/10.1017/S0025315416001326.
ACKNOWLEDGEMENTS
We are most grateful to Rijkswaterstaat for the start and continuation of the long-term monitoring programme on phytoplankton species abundance in the North Sea and the Wadden Sea, and to all who were involved in sampling and analyses. We thank Alain F. Zuur for the support with the statistical analysis. We furthermore acknowledge the scientific interactions with our colleagues of the INFOWEB project, i.e. the NIOZ Netherlands Institute of Sea Research (Texel & Yerseke, NL), the Alfred Wegener Institute for Polar and Marine Research (Sylt, D), Senckenberg Institute (Wilhelsmhaven, D) and the University of Groningen (Groningen, NL). We also like to thank the two anonymous reviewers for their helpful comments on earlier versions of this manuscript.
FINANCIAL SUPPORT
This research is performed within the framework of the ‘The impact of biological invasions on the food web of the Wadden Sea (INFOWEB)’ project, as part of a bilateral Wadden Sea research programme that is jointly funded by the German Federal Ministry of Education and Research (Bundesministerium für Bildung und Forschung; BMBF) and the Dutch NWO Earth and Life Sciences.