Introduction
Several events in the past decade have moved emergency preparedness to the forefront of national priority. Most recently, a snow storm in Buffalo, New York (USA) trapped thousands of people in their homes for up to four days, some without power.Reference Becker 1 Cold weather storms in February of 2013 left hundreds of thousands of northeastern United States residents stranded without power and mobility.Reference Schweber and Bidgood 2 Hurricanes, tornadoes, wildfires, and floods are among the recently and regularly occurring natural disasters that lead to emergency situations. The Centre for Research on the Epidemiology of Disasters (Brussels, Belgium) reports that in 2012, there were 364 natural disasters and 188 technological disasters (including transport and industrial accidents and manufacturer explosions) worldwide. 3 Although the number of annual disasters is on a decreasing trend since 2005, nearly 140,000 people were affected negatively by worldwide disasters in 2012. 4
As a country, the US has expanded beyond the previous focus on post-disaster and recovery planning to include pre-disaster planning and preparation.Reference Inglesby 5 Many US government efforts have focused on disaster response and communication of disaster-related information, including: the National Health Security Strategy, which targets its efforts toward emergencies that could impact health negatively; 6 the National Response Framework, which emphasizes the response of the community to disasters; 7 the National Incident Management System, which promotes the collaboration between public and private organizations to manage emergencies; 8 and the National Disaster Medical System, which supplements health and medical aid to disaster victims. 9 These, among other emergency response planning efforts, have led to improved communication between public health departments and emergency facilities, officials and the public, and among first responders.Reference Khan 10 The importance of pre-disaster planning and preparation has been underscored by the successful responses to Hurricanes Gustav and Ike (2008).Reference Kleinpeter 11
In addition to US federal programs, household emergency preparedness is considered to be a key factor in survival and reducing loss associated with disasters. A systematic literature review on household emergency preparedness indicated that the majority of individuals in Canada and the US recognize the importance of emergency preparedness but do not report being prepared for a disaster or emergency situation.Reference Levac, Toal-Sullivan and O'Sullivan 12
Emergency-induced food insecurity is among the many negative consequences of disasters.Reference Wright and Vesala-Husemann 13 It is well known that insufficient dietary intake may compromise immune function as well as the function of many physiological systems. This may lead to increased susceptibility of diseases associated with emergency situational factors, including exposure to toxic materials in the environment.Reference Wright and Vesala-Husemann 13 Emergency situations that prevent access to food and potable water may lead to malnutrition if an adequate household food supply is not available.
The Federal Emergency Management Agency of the US (Washington, DC USA) has provided general guidelines regarding emergency food supplies, food safety, cooking, and managing food without power. 14 General recommendations include stocking a 3-day supply of foods that are appropriate for the household members. Non-perishable, canned, and dried foods with bottled water are found in most household emergency preparedness recommendations. 14 - Reference Good, Lee and McKenzie Lewis 17 An impact analysis of a household emergency preparedness program implemented by the Canadian Red Cross (Ottawa, Ontario, Canada) found that half of the program participants did not report having the recommended 3-day supply of canned food and water.Reference Falkiner 18 In the US, data from the Behavioral Risk Factor Surveillance System from 2006 through 2010 were analyzed to reveal that greater than 80% of the population reported having a 3-day food supply at home, yet closer to 50% reported having a 3-day supply of water. 19 , Reference Der-Martirosian, Strine, Atia, Chu, Mitchell and Dobalian 20
Previous evidence indicates a majority of residents acknowledge the importance of emergency preparedness, and many report being prepared; however, emergency food supply within the household has yet to be measured objectively. Although most food and nutrition program efforts are targeted toward low-income, minority populations, it is necessary to determine the vulnerability of other subsets of the population (including higher socioeconomic households) to emergency-induced food insecurity.
Beyond analysis of survey data, a detailed examination of the current food supply within households in the US has not yet been completed. An investigation of this sort is the first step in determining the possible needs of US households during a disaster. Thus, the purpose of this study was to describe household calorie availability and nutrient density in a normal situation and to project changes that could occur when emergencies restrict replenishment of food supplies and disrupt water and/or energy needed for food preparation and storage.
Methods
This analysis was a component of a larger study,Reference Byrd-Bredbenner, Maurer Abbot and Cussler 21 which was approved by the Rutgers University Institutional Review Board (New Brunswick, New Jersey USA). This study was conducted according to the guidelines laid down in the Declaration of Helsinki, and all procedures involving human subjects were approved by the Rutgers University Institutional Review Board. Written informed consent was obtained from all participants before data collection began.
Sample Recruitment
Recruitment entailed verbal announcements and emails posted to listservs of employers and religious, community, and parent groups. Mothers who had one or more children, aged zero to 12 years old, were the major household food gatekeepers (ie, did most or all meal planning, food shopping, and preparation), and were married or living with a domestic partner in a food secure household (consistent access to sufficient, healthy food) that ate dinner at home three or more times per week were eligible to participate. Neither the participant nor her partner could be employed in a health-related profession.
A total of 149 of the 318 study applicants met the eligibility criteria. Participants were notified of their eligibility in the order they applied and were invited to participate until 100, the study quota, consented to participate. Each participant was paid US $150 for participation in all components of the larger study.
Data Collection
Demographic data for all household members were collected by self-report survey. An occupational prestige scale based on mothers’ and fathers’ education and occupation was used to determine socioeconomic status (SES).Reference Stevens and Cho 22 Trained researchers audited foods in the households using nutrient analysis software (FoodWorks: Professional Edition; The Nutrition Company, Valley, New Jersey USA)Reference Bredbenner and Byrd-Bredbenner 23 adapted to use scanners that could read Universal Product Codes (also called barcodes) on food packages and link them to nutrient databases. 24 - 27 Nutrient values missing from any of the databases were located through an internet search, or ascribed by trained researchers, thereby resulting in complete calorie and nutrient data for all audited foods. All foods in each participant’s household were recorded in the audit except: alcoholic beverages, commercially prepared baby food, infant formula, pet foods, bottled water, refrigerated leftovers, foods of minimal nutrient content (eg, vinegar, baking powder, baking soda, salt, pepper, herbs, spices, extracts, cooking spray, non-caloric sweeteners, gum, coffee, and tea [except packaged beverages containing caloric sweeteners]), condiments typically used in small quantities per serving (eg, ketchup, mustard, mayonnaise, horseradish, soy sauce, and hot sauce), and bulk supplies of sugar, flour, and fats (eg, oils, shortening, butter, or margarine).Reference Byrd-Bredbenner and Maurer Abbot 28 Study participants were asked to maintain their usual food shopping habits (ie, shop on usual day and purchase/use usual food items) and to not change them in any way prior to the audit. A detailed description of the home audit procedure is described in detail in previous publications.Reference Byrd-Bredbenner, Maurer Abbot and Cussler 21 , Reference Byrd-Bredbenner, Bryant and Stevens 29 , Reference Byrd-Bredbenner and Bredbenner 30
Data Analysis
Each household’s total calorie availability and nutrient density were calculated at the time of the audit. Audit data were coded to indicate the type of resources (ie, energy and/or water) needed to maintain food availability and accessibility. Factoring in food losses that could be expected when resources become unavailable in an emergency situation, adjusted household calorie availability and nutrient density values were projected.
Calorie Availability
To determine total calorie availability, calories obtainable in all foods in a household were summed. To determine the number of days a household’s food supply could provide 100% of the daily value (DV)Reference Yates 31 , 32 for calories for all household members (referred to as household calorie days), the total calories within the household at the time of data collection were divided by the DV of 2,000 calories and then divided by total number of household adult equivalents.
Each household member over the age of 12 was deemed one adult equivalent; children aged two to 12 years old were weighted at 0.73 of adult equivalents to reflect their relatively lower calorie and nutrient needs. Children under the age of two years old were not considered in calculations because of their limited impact on household food supplies and because foods they tend to consume (eg, baby food and infant formula) were not included in the audit. The weighting formula was derived from Ransley et al methods.Reference Byrd-Bredbenner and Maurer Abbot 28 , Reference Ransley, Donnelly, Botham, Khara, Greenwood and Cade 33 , Reference Ransley, Donnelly and Khara 34
For example, if a household’s food supply contained 101,000 calories, it had 50.5 days of calories available at 100% DV (101,000 calories/2,000 calorie DV). If the household had two parents, one teenager, one eight year old child, and an infant, then it had 3.73 adult equivalents. Thus, the household had 13.5 days of calories available per household member at 100% DV (50.5 days of calories at 100% DV/3.73 total household adult equivalents). If each household member consumed 100% DV for calories each day and was unable to replenish their food supply within 13.5 days, they would exhaust household calorie supplies.
Nutrient Density
Using the same procedure described above for calorie availability, the nutrients (ie, protein, fat, saturated fat, cholesterol, carbohydrate, sodium, fiber, vitamin A, vitamin C, calcium, and iron) available in all foods in a household were summed, divided by the appropriate DV, and then divided by total number of household adult equivalents. Calcium, for instance, has a DV of 1,000 mg. If the household’s food supply contained 25,000 mg of calcium, it had 25 days of calcium available at 100% DV (25,000 mg calcium/1,000 mg DV). Thus, the household in the example above had 6.7 days of calcium available per household member at 100% DV (25 days of calcium at 100% DV/3.73 total household adult equivalents). If this household consumed 100% DV for calcium daily and could not restock their food stores within 6.7 days, household food supplies for this nutrient would be depleted.
Overall nutrient density of household food supplies was calculated based on Guthrie and Scheer’s nutrient adequacy ratio (NAR).Reference Guthrie and Scheer 35 The numerator for calculating a household’s overall NAR was computed by averaging the days available at 100% DV per household member for nutrients that health professionals recommend be maximized in diets (ie, calcium, iron, vitamin C, vitamin A, protein, and fiber). The denominator was calculated by averaging the days available at 100% DV per household member for nutrients health professionals recommend be minimized (ie, sodium, cholesterol, total fat, and saturated fat). For instance, if the example household with 6.7 days of calcium available at 100% DV per household member also had 5.1, 6.3, 9.2, 10.0, and 3.5 days of the other nutrients to be maximized, the numerator was 6.8. If this household had 7.6, 4.8, 7.4, and 3.0 days of the nutrients to be minimized, the denominator was 5.7. Thus, the NAR for the example household’s food supply is 1.19 (6.8/5.7). A NAR of one or higher indicates that a household’s food supply has positive nutrient density because it contains proportionally more nutrients to maximize than nutrients to minimize. A NAR of less than one indicates the reverse, whereas a NAR of zero indicates a neutral nutrient density in that the nutrients to maximize and minimize are balanced.
Resources Needed to Maintain Food Availability and Accessibility
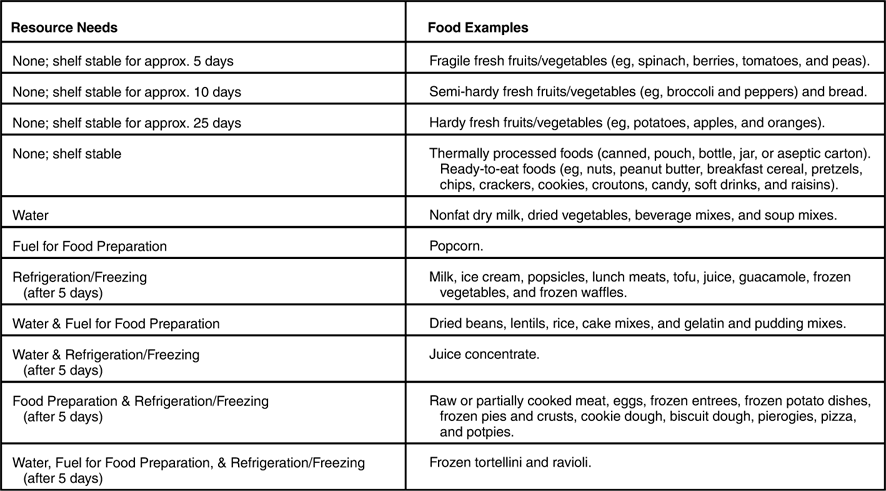
To account for food loss or inaccessibility due to lack of resources during an emergency situation, each food in a household was categorized to indicate the resources required to maintain the food’s quality and/or allow it to be accessed in an edible form (eg, soak and cook dry beans, reconstitute juice concentrate, and heat frozen entrées). Resources were: water for preparation (eg, nonfat dry milk and juice concentrate), electricity for refrigeration/freezing (eg, for fluid milk, lunch meats, and frozen foods), and fuel for cooking (eg, for fresh eggs, frozen meats, frozen packaged goods, and rice). As shown in Table 1, some foods required no resources to remain fully available and accessible (eg, canned foods and breakfast cereal) whereas others required one, two, or all three resources (eg, frozen ravioli). For foods requiring one or more resources, a loss of any required resource would render them (and their calories and nutrients) inaccessible. Fresh foods not requiring refrigeration/freezing were further categorized according typical “shelf life,” or number of days they were likely to retain sufficient quality to be acceptable for consumption. For example, fragile raw produce, such as tender leafy greens and berries, were estimated to have a shelf life of approximately five days without refrigeration. Semi-hardy raw produce, such as bell peppers and baked bread, have a shelf life of approximately 10 days. Hardy produce, such as raw apples and carrots, were estimated to retain sufficient quality for approximately 25 days.
Resource Needs to Make Food Available and Accessible

Projecting Household Calorie Availability and Nutrient Density with Resource Loss
Calorie availability and nutrient density during circumstances in which one or more resources were lost was calculated for each household. The procedures for these calculations were the same as those described above for total household calorie availability and nutrient density at the time of the audit, except foods requiring each resource (alone or in combination) were eliminated from the calculation. For the most conservative estimates, foods requiring refrigeration/freezing were considered lost after five days.
Results
The majority of the study population was white (91%), while Latino (6%), black (2%), and mixed race (1%) subjects also participated. All subjects were food secure. Based on the occupational prestige scale of 1 to 5,Reference Stevens and Cho 22 relative income of the study participants was 3.8 (SD=0.9; range=2-5) indicating a low-moderate to high SES. All study participants were female, the household food gatekeeper, married or in a stable domestic partnership, and living in New Jersey.
At the time of the food audit, the total number of days a household’s food supply could provide 100% of the DV for calories for all household members (abbreviated for simplicity as household calorie days) was 33.16 days (SD=21.97 days; range=8.14-125.17 days). Household nutrient density as determined by the NAR at the time of the audit was 1.07 (SD=0.44), indicating a positive nutrient density.
The percent of household calorie days that were provided from shelf-stable foods not requiring cooking or water was 38.88% (SD=2.54%) and ranged from 10.48% to 76.22%. The NAR of these shelf-stable foods at the time of the audit was 1.22 (SD=0.69).
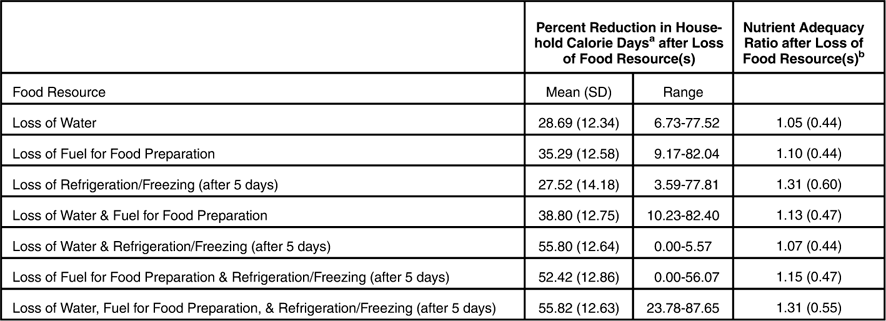
Table 2 describes the ways in which household calories days would decline with loss of resources. As any one resource was projected to be unavailable, the household calories days were estimated to decrease by approximately 30%. More than half of household calories days were estimated to be unavailable and inaccessible when refrigeration/freezing was lost in tandem with loss of fuel for food preparation, water, or both. The nutrient density of household food supplies remained positive despite unavailability and inaccessibility of foods due to resource loss.
Effect of Resource Loss on Emergency Household Food Supply

(This table reveals the effect of the loss of food-related resources on emergency household food supply. With the loss of each resources or combination of resources, the projected reduction in household calorie days, as well as the adjusted Nutrient Adequacy Ratio are indicated.)
a Household calorie days are the number of days a household’s food supply could provide 100% of the daily value 25 , 26 for calories for all household members. Time of audit was set at 0% loss (ie, all household foods were available and accessible). At time of audit, households had 33.16 days (SD=21.97days; range=8.14-125.17 days) at 100% daily value for calories for all household members available and accessible.
b At time audit, household food supply nutrient density was 1.07 (SD=0.44; range=0.53-3.61).
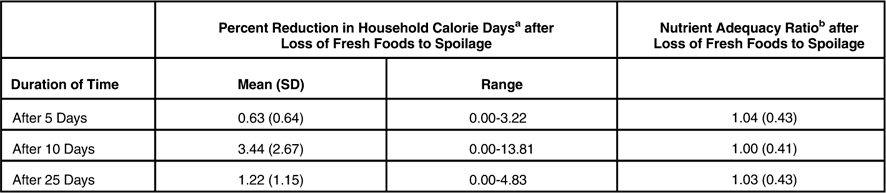
As seen in Table 3, nearly five percent of household calorie days were available from fresh foods (eg, raw produce and breads) not requiring resources if eaten before spoilage. Spoilage after five, 10, and 25 days reduced household calorie days by means less than five percent (range=0.00%-13.81%).
Loss from Spoilage of Fresh Foods Not Requiring Resources

(The estimated effects of the loss of food from spoilage of fresh foods not requiring resources are presented in this table. The projected reduction in percent of household calorie days and the adjusted Nutrient Adequacy Ratios are presented.)
a Household calorie days are the number of days a household’s food supply could provide 100% of the daily value 25 , 26 for calories for all household members. Time of audit was set at 0% loss (ie, all household foods were available and accessible). At time of audit, households had 33.16 days (SD=21.97 days; range=8.14-125.17 days) at 100% daily value for calories for all household members available and accessible.
b At time audit, household food supply nutrient density was 1.07 (SD=0.44; range=0.53-3.61).
Without replenishment, after five days of all household members eating 100% of the DV for calories and having no water, food preparation fuel, and refrigeration/freezing resources available, mean household calories days would be 9.59 days (SD=9.67 days) and food supplies would be depleted in one of 20 households. After seven and nine days, 18% and 27% of households would exhaust all household calorie days, respectively.
Discussion
The results of this study indicate that the food supply of the households surveyed exceeded the general recommendation at the time of the audit. More than one month’s worth of household calorie days were observed to be on hand. Without replenishment and lacking all food preparation and storage resources for five days, more than nine household calorie days were available.
As evidenced by the large standard deviation, household calorie days varied greatly from household to household within this study population. However, the range of 8.14-125.17 days indicates that even the households at the lower end of the range have a food supply adequate to nourish all household members for approximately eight days (five days above the national recommendation). Even with the lack of the three main food-related resources (water, cooking fuel, and refrigerator/freezer use), the mean household calorie days remained above the 3-day food supply recommendation with positive nutrient density. In fact, after nine days without food replenishment and the three food-related resources, approximately 73% of the audited households would continue to have ample food supply.
It is important to note that this study population consisted of predominantly white households with low-moderate to high SES, which is consistent with the national statistics. As of 2013, greater than 75% of the US population was white. 36 Additionally, it is theorized that a majority of Americans are found within the middle class in terms of SES.Reference Beeghley 37 In other words, the study population was similar to most households in the US.
Previous literature has indicated an effect of ethnicity/race in that Hispanic, black, and other non-white respondents in the US were less likely to report having a 3-day food supply for emergency situations when compared to white respondents. 19 Despite these differences, at least 75% of the respondents of every racial/ethnic group reported having a 3-day food supply in case of an emergency. 19 Another study indicated that respondents in North Carolina (USA) with an annual income of US $35,000 or higher were more likely to engage in emergency preparedness compared to those who earned less.Reference Gazibara, Jia and Lubetkin 38 These previous studies provided great insight into the influence of demographic factors but relied on self-reports of emergency preparedness as opposed to the current study which directly measured food supply status within the household.
Future studies should assess the emergency food supply status of minority and low-income households. This study’s findings indicate low vulnerability of the low-moderate to high SES household to emergency-induced food insecurity. Prioritization of post-disaster food relief efforts likely should be directed toward more vulnerable households.
Post-disaster food supply plans have been established to provide safe food for those affected by disasters. For example, the United States Department of Agriculture (Washington, DC USA) Disaster Supplement Nutrition Assistance Program provides benefits, including food and shelter after a disaster, 39 via state and local organizations. However, before aid is available, household emergency preparedness is recommended. 14 , Reference Katzki and Katzki 16 Due to unforeseen complications that may occur to the transport and provision of food aid, individuals affected by a disaster may rely heavily on their own emergency food supply. This study reveals that low-moderate to high SES households contain adequate emergency food supplies and are not vulnerable to emergency-induced food insecurity.
Limitations
A limitation of the current study is the small sample size which does not allow for more in-depth analysis, including analysis of race/ethnicity as confounding factor of emergency household food supply. Other limitations include a food secure, low-moderate to high SES sample living in a single geographic region. Future research should replicate this study with more vulnerable and marginalized populations, such as those with lower income, living in food deserts, older adults, and those with chronic health conditions that have special needs.Reference Katzki and Katzki 16 , Reference Hutton 40 – Reference Kleinpeter 42 Despite study limitations, these findings provide insight into the emergency food preparedness status of food secure households in the US.
Conclusion
Food secure households in New Jersey had ample emergency food supply in terms of caloric availability and nutrient density. A large range in household calorie days was observed, but it was clear that even the lower end of the range had more than twice the recommended 3-day supply of food. The projected loss of refrigeration/freezer storage, along with fuel and water for cooking, was estimated to reduce the emergency household food supply by 52% to 55%. Despite this estimated loss, the mean household calorie day would remain above the recommended 3-day food supply.
Acknowledgements
Funding for this study was provided by: Canned Food Alliance (Pittsburgh, Pennsylvania USA); Gladson Interactive (Lisle, Illinois USA); FoodFacts.com (Edison, New Jersey USA); and The Nutrition Company (Long Valley, New Jersey USA). This study was part of a larger studyReference Byrd-Bredbenner, Maurer Abbot and Cussler 21 which was approved by the Rutgers University Institutional Review Board (New Brunswick, New Jersey USA).