



1 Introduction
A knowledge of gravitational settling of heavy particles in turbulent flows is essential to understanding and predicting particle-laden flows, which are observed in many engineering applications, such as combustion chambers, and in nature, such as sediment transport. Therefore, many investigations on gravitational settling of small (sub-Kolmogorov sized), heavy particles in homogeneous turbulence have revealed its noticeable effects on particle distribution characteristics and turbulence modification by particles through the so-called two-way coupling. Wang & Maxey (Reference Wang and Maxey1993), using direct numerical simulation (DNS), showed that in stationary homogeneous isotropic turbulence, heavy particles tend to accumulate in regions of downward fluid velocities of local vortical structures (the preferential sweeping effect), and the effect is most pronounced at a Stokes number (
 $St_{K}$
) of unity on the basis of the Kolmogorov time scale. Ferrante & Elghobashi (Reference Ferrante and Elghobashi2003) performed two-way coupled DNS of decaying isotropic turbulence to show that particles accumulated through the preferential sweeping mechanism give rise to banana-shaped vortical structures, elongated in the direction of gravity, and the decay rate of turbulence kinetic energy is reduced at
 $St_{K}=0.25$
. Similarly shaped vortical structures were also observed for
 $St_{K}\approx 1$
by Yang & Shy (Reference Yang and Shy2005), who measured two-way interactions between small solid particles and stationary homogeneous isotropic air turbulence by means of a high-speed, digital particle image velocimetry technique. In their experiment, the turbulence was enhanced, in particular, for the vertical component when
 $St_{K}\approx 1$
and 1.9. Bosse, Kleiser & Meiburg (Reference Bosse, Kleiser and Meiburg2006) carried out two-way coupled DNS of stationary, isotropic turbulence for
 $St_{K}\approx 1$
and explained that, in regions of high particle concentration, the fluid is accelerated in the direction of gravity due to particle drag. Indeed, small, heavy particles settle faster in homogeneous isotropic turbulence than those in still fluid when
 $St_{K}\approx 1$
, as a direct consequence of their preferential accumulation and the two-way coupling effect (Wang & Maxey Reference Wang and Maxey1993; Yang & Lei Reference Yang and Lei1998; Aliseda et al.
Reference Aliseda, Cartellier, Hainaux and Lasheras2002; Yang & Shy Reference Yang and Shy2003, Reference Yang and Shy2005; Bosse et al.
Reference Bosse, Kleiser and Meiburg2006; Rosa et al.
Reference Rosa, Parishani, Ayala and Wang2016). For a large Stokes number (
 $St_{K}=4$
), in their DNS study, Park & Lee (Reference Park and Lee2014) reported a different type of particle clustering, a vertical streaky pattern, in homogeneous isotropic turbulence under strong gravity.
There have also been a number of experimental studies on gravitational settling in horizontal wall-bounded turbulent shear flows. Generally, high concentrations of heavy particles were found near the bottom wall, due to gravity (Tanière, Oesterlé & Monnier Reference Tanière, Oesterlé and Monnier1997; Kiger & Pan Reference Kiger and Pan2002; Kussin & Sommerfeld Reference Kussin and Sommerfeld2002; Li et al.
Reference Li, Wang, Liu, Chen and Zheng2012). In particular, the effects of particles in the immediate neighbourhood of the bottom wall, such as the effects of particle–wall collisions, enhanced wall roughness due to particle sedimentation, or sliding and rolling particle motions at the wall, were the main physical mechanisms responsible for the observed turbulence modification (Tanière et al.
Reference Tanière, Oesterlé and Monnier1997; Righetti & Romano Reference Righetti and Romano2004; Li et al.
Reference Li, Wang, Liu, Chen and Zheng2012). On the other hand, Gerashchenko et al. (Reference Gerashchenko, Sharp, Neuscamman and Warhaft2008), using a high-speed camera, compared Lagrangian acceleration statistics of particles with inertia in the presence of shear with those in isotropic turbulence by injecting water droplets of the order of
 $10~\unicode[STIX]{x03BC}\text{m}$
into a turbulent air boundary layer formed above a horizontally placed flat plate within a wind tunnel. The Stokes numbers were
 $St_{K}\approx 0.25$
and 1.2 in the lower, shear-dominant part of the boundary layer, which corresponded to
 $St^{+}\approx 1$
and 5, respectively, where
 $St^{+}$
is the Stokes number based on wall units. Note that all the results shown in this paper are normalized with
 $u_{\unicode[STIX]{x1D70F}}$
and
 $\unicode[STIX]{x1D708}$
of the particle-free flow, and are denoted by the superscript plus sign
 $^{+}$
, unless otherwise stated. In contrast to previous results for particles in isotropic turbulence, the effect of shear coupled with gravity and inertia was found to significantly increase the variance of the particle accelerations. However, the details of the gravitational effects on particle clustering and the associated turbulence modification were not discussed in the Gerashchenko et al. (Reference Gerashchenko, Sharp, Neuscamman and Warhaft2008) study.
Motivated by the experimental study of Gerashchenko et al. (Reference Gerashchenko, Sharp, Neuscamman and Warhaft2008), here we numerically investigate how gravitational settling of small, heavy particles in the presence of shear is different from that in the homogeneous isotropic turbulence mentioned above, in particular, in terms of the two-way coupling effect. In this study, we perform DNS of turbulent channel flow along with Lagrangian particle tracking to consider gravitational settling in boundary layers, as in Gerashchenko et al. (Reference Gerashchenko, Sharp, Neuscamman and Warhaft2008). Up to now, many researchers have used DNS to investigate modifications of turbulent channel flow by small, heavy particles for a wide range of Stokes numbers (
 $0.5\leqslant St^{+}\leqslant 200$
) (Li et al.
Reference Li, McLaughlin, Kontomaris and Portela2001; Dritselis & Vlachos Reference Dritselis and Vlachos2008, Reference Dritselis and Vlachos2011; Nasr, Ahmadi & McLaughlin Reference Nasr, Ahmadi and McLaughlin2009; Zhao, Andersson & Gillissen Reference Zhao, Andersson and Gillissen2010, Reference Zhao, Andersson and Gillissen2013; Richter & Sullivan Reference Richter and Sullivan2013, Reference Richter and Sullivan2014; Lee & Lee Reference Lee and Lee2015; Richter Reference Richter2015; Richter, Garcia & Astephen Reference Richter, Garcia and Astephen2016). However, these authors have focused on the effect of turbulence alone on particle motion without considering gravity or have considered a vertical channel flow in which gravity is directed in the mean flow direction. Generally, the wall-normal and spanwise turbulence intensities and the Reynolds shear stress were suppressed. The streamwise turbulence intensity variations depended on the particle distributions (Lee & Lee Reference Lee and Lee2015).
Even though several DNS studies have taken into account gravitational settling of particles in the wall-normal direction, either the effect of two-way coupling is not included in the simulations or the main considerations lie beyond the scope of our investigation. For example, Zhang & Ahmadi (Reference Zhang and Ahmadi2000), using DNS without two-way coupling for
 $0.01\leqslant St^{+}\leqslant 100$
, showed that the particle deposition rate on the lower wall is increased sharply by gravitational sedimentation and is significantly affected by the magnitude of the flow friction velocity for horizontal channels rather than for vertical channels. Dorgan & Loth (Reference Dorgan and Loth2004) also carried out DNS without two-way coupling. Unlike most previous studies, which investigated gravitational settling toward the lower wall, they focused on particles released with terminal fall velocities away from the upper wall at the edge of the viscous sublayer in a horizontal turbulent boundary layer for
 $0.027\leqslant St^{+}\leqslant 270$
. They showed that particle diffusion and dispersion are affected by particle ejections corresponding to boundary layer ejections away from the wall, near-wall particle concentration due to flow inhomogeneity (turbophoresis), particle–wall collisions and the crossing-trajectory effect. Lavezzo et al. (Reference Lavezzo, Soldati, Gerashchenko, Warhaft and Collins2010) satisfactorily reproduced the experimental observation of Gerashchenko et al. (Reference Gerashchenko, Sharp, Neuscamman and Warhaft2008) through DNS of channel flow without including two-way coupling. Soldati & Marchioli (Reference Soldati and Marchioli2012) focused on the numerical treatment of high sediment concentration near the wall in DNS and large-eddy simulation. Pan & Banerjee (Reference Pan and Banerjee1996) and DeMarchis, Milici & Napoli (Reference DeMarchis, Milici and Napoli2017) considered two-way coupling DNS with the gravitational effect on particle motion in the wall-normal direction, but in Pan & Banerjee (Reference Pan and Banerjee1996), nearly neutrally buoyant particles settled quite slowly compared to heavy ones, and in DeMarchis et al. (Reference DeMarchis, Milici and Napoli2017), the focus was on the effects of the irregular roughness of the walls.
As in Gerashchenko et al. (Reference Gerashchenko, Sharp, Neuscamman and Warhaft2008), we focused on transport of particles through near-wall turbulence due to a combination of the drag force and gravity. For this purpose, we chose to remove particles whose feedback effect on the fluid becomes insignificant after several collisions with the lower wall and simultaneously release new particles near the upper wall, thus keeping the total number of particles constant. Therefore, we could observe gravitational settling through near-wall turbulence not only in the direction toward the wall but also in the direction away from the wall. A point-force approach was employed to implement the particle reaction on the fluid. The effects of wall-normal gravity on preferential accumulation of particles and turbulence modification due to the presence of particles were investigated for various Stokes numbers in the range
 $0.72\leqslant St^{+}\leqslant 21.2$
.
The paper is organized as follows. In § 2 we introduce numerical procedures and we validate the numerical procedure through comparison with experimental measurements of particle acceleration in § 3. Detailed analysis of the modification of turbulence by settling particles is provided in § 4. The effect of considering wall-normal gravity is discussed through comparison with the results for non-sedimenting particles in § 5. Finally, the concluding remarks are given in § 6.
2 Numerical procedures
2.1 Turbulent channel flow
The governing equations for particle-laden incompressible flow in Cartesian tensor notation are given by
 $$\begin{eqnarray}\displaystyle & \displaystyle \frac{\text{D}u_{i}}{\text{D}t}=-\frac{1}{\unicode[STIX]{x1D70C}}\frac{\unicode[STIX]{x2202}p}{\unicode[STIX]{x2202}x_{i}}+\unicode[STIX]{x1D708}\frac{\unicode[STIX]{x2202}^{2}u_{i}}{\unicode[STIX]{x2202}x_{j}\unicode[STIX]{x2202}x_{j}}+\frac{1}{\unicode[STIX]{x1D70C}}f_{i}, & \displaystyle\end{eqnarray}$$
 $$\begin{eqnarray}\displaystyle & \displaystyle \frac{\unicode[STIX]{x2202}u_{i}}{\unicode[STIX]{x2202}x_{i}}=0, & \displaystyle\end{eqnarray}$$
in which
 $t$
is time;
 $x_{1},x_{2}$
and
 $x_{3}$
are the streamwise
 $(x)$
, wall-normal
 $(y)$
and spanwise coordinates
 $(z)$
in a channel, respectively; and
 $p,\unicode[STIX]{x1D70C}$
and
 $\unicode[STIX]{x1D708}$
are the pressure, fluid density and kinematic viscosity, respectively;
 $u_{i}$
and
 $f_{i}$
represent the fluid velocity and the reaction of particles with the fluid in the
 $x_{i}$
direction, respectively.
A DNS was performed for turbulent channel flow using the pseudo-spectral method. The dealiased Fourier expansion in the
 $x$
and
 $z$
directions and the Chebyshev expansion in the
 $y$
direction were used. For time advancing, the viscous and nonlinear terms were discretized using the Crank–Nicolson and third-order three-stage Runge–Kutta schemes, respectively.
A Reynolds number of
 $Re_{\unicode[STIX]{x1D70F}}=u_{\unicode[STIX]{x1D70F}}\unicode[STIX]{x1D6FF}/\unicode[STIX]{x1D708}=180$
was considered in this study, where
 $u_{\unicode[STIX]{x1D70F}}$
and
 $\unicode[STIX]{x1D6FF}$
are the friction velocity and channel half-width, respectively. The same external pressure gradient
 $\text{d}P/\text{d}x$
was imposed on the flow using the wall shear stress of the particle-free flow
 $\unicode[STIX]{x1D70F}_{w}=\unicode[STIX]{x1D70C}u_{\unicode[STIX]{x1D70F}}^{2}$
as
 $$\begin{eqnarray}\frac{\text{d}P}{\text{d}x}=-\frac{\unicode[STIX]{x1D70F}_{w}}{\unicode[STIX]{x1D6FF}},\end{eqnarray}$$
in all the particle-free and particle-laden cases simulated. In the
 $(x,y,z)$
directions, the domain size was
 $(4\unicode[STIX]{x03C0}\unicode[STIX]{x1D6FF},2\unicode[STIX]{x1D6FF},2\unicode[STIX]{x03C0}\unicode[STIX]{x1D6FF})$
and the mesh was
 $(128,129,128)$
. Then, the grid spacing was
 $\unicode[STIX]{x0394}x^{+}=17.7$
,
 $\unicode[STIX]{x0394}y^{+}=0.05$
–4.4 and
 $\unicode[STIX]{x0394}z^{+}=8.8$
in the streamwise, wall-normal and spanwise directions, respectively, in wall units. According to Kim, Moin & Moser (Reference Kim, Moin and Moser1987), this choice of resolution at
 $Re_{\unicode[STIX]{x1D70F}}=180$
is enough to predict a number of statistical correlations accurately. In the horizontal
 $(x,z)$
directions, periodic boundary conditions were employed.
2.2 Particles
For small (sub-Kolmogorov sized) spherical particles much heavier than the fluid in a horizontal turbulent channel flow, the particle equation of motion can be given in the Lagrangian frame as follows (Maxey & Riley Reference Maxey and Riley1983; Gerashchenko et al. Reference Gerashchenko, Sharp, Neuscamman and Warhaft2008):
 $$\begin{eqnarray}\displaystyle & \displaystyle \frac{\text{d}v_{i}}{\text{d}t}=\frac{(1+0.15Re_{p}^{0.687})}{\unicode[STIX]{x1D70F}_{p}}(\tilde{u} _{i}-v_{i})-g\unicode[STIX]{x1D6FF}_{i2}, & \displaystyle\end{eqnarray}$$
 $$\begin{eqnarray}\displaystyle & \displaystyle \frac{\text{d}q_{i}}{\text{d}t}=v_{i}, & \displaystyle\end{eqnarray}$$
in which
 $v_{i}$
and
 $q_{i}$
are the particle velocity and the particle position in the
 $x_{i}$
direction, respectively, and
 $\tilde{u} _{i}$
indicates the fluid velocity at the particle position in the
 $x_{i}$
direction. The particle Reynolds number is defined as
 $Re_{p}=|\tilde{\boldsymbol{u}}-\boldsymbol{v}|d_{p}/\unicode[STIX]{x1D708}$
, where
 $d_{p}$
is the particle diameter and
 $\unicode[STIX]{x1D70F}_{p}$
is the particle response time; i.e.
 $\unicode[STIX]{x1D70F}_{p}=d_{p}^{2}\unicode[STIX]{x1D70C}_{p}/(18\unicode[STIX]{x1D70C}\unicode[STIX]{x1D708})$
, where
 $\unicode[STIX]{x1D70C}_{p}$
is the particle density;
 $g$
is the magnitude of the gravitational acceleration and
 $\unicode[STIX]{x1D6FF}_{ij}$
is the Kronecker delta.
Parameters for comparison with the experiment by Gerashchenko et al. (Reference Gerashchenko, Sharp, Neuscamman and Warhaft2008) (cases A–C), for investigation of the two-way interaction between the settling particles and near-wall turbulence (cases D–H), and for comparison with the results without considering gravitational settling (cases I and J).

In this study, the two-way coupling effect at the
 $n$
th node position
 $\boldsymbol{x}^{n}$
in the
 $x_{i}$
direction was approximated by a point-force method, namely
 $$\begin{eqnarray}f_{i}(\boldsymbol{x}^{n})=-\mathop{\sum }_{k}w(\boldsymbol{x}^{n}-\boldsymbol{q}^{k})\frac{F_{i}^{k}}{\mathop{\vee }^{k}},\end{eqnarray}$$
where
 $F_{i}^{k}$
and
 $\vee ^{k}$
are the drag force of the
 $k$
th particle in the
 $x_{i}$
direction and the volume of the computational cell including the particle, respectively, and
 $(F_{i}^{k}/\vee ^{k})$
is exerted back on the fluid at the nearby eight grid points via the weight function
 $w$
based on linear interpolation from the
 $k$
th particle position
 $\boldsymbol{q}^{k}$
(Boivin, Simonin & Squires Reference Boivin, Simonin and Squires1998; Richter & Sullivan Reference Richter and Sullivan2013). Although more advanced methods are now available (see Maxey & Patel Reference Maxey and Patel2001; Capecelatro & Desjardins Reference Capecelatro and Desjardins2013; Gualtieri et al.
Reference Gualtieri, Picano, Sardina and Casciola2015; Capecelatro, Desjardins & Fox Reference Capecelatro, Desjardins and Fox2016), this classical point-force method has been extensively used for two-way coupled DNS of various flows such as homogeneous isotropic turbulence (Ferrante & Elghobashi Reference Ferrante and Elghobashi2003; Bosse et al.
Reference Bosse, Kleiser and Meiburg2006; Abdelsamie & Lee Reference Abdelsamie and Lee2012), turbulent boundary layers (Li, Luo & Fan Reference Li, Luo and Fan2016a
; Li et al.
Reference Li, Wei, Luo and Fan2016b
) and turbulent channel or Couette flows (Lee & Lee Reference Lee and Lee2015; Wang & Richter Reference Wang and Richter2019). However, the two-way force distribution
 $\boldsymbol{f}(\boldsymbol{x}^{n})$
obtained by this method is known to suffer from grid dependency as the number of particles per cell becomes
 $N_{p}/N_{c}<1$
, where
 $N_{p}$
is the number of total particles and
 $N_{c}$
is the number of computational cells (Eaton Reference Eaton2009; Gualtieri et al.
Reference Gualtieri, Picano, Sardina and Casciola2013; Gualtieri, Battista & Casciola Reference Gualtieri, Battista and Casciola2017). As shown below in table 1,
 $N_{p}/N_{c}>1$
for the low Stokes number cases (
 $St^{+}\leqslant 5.3$
), whereas
 $N_{p}/N_{c}<1$
for the highest two Stokes numbers (
 $St^{+}=10.6$
and 21.2) in our study. In order to ensure that our results for the highest Stokes number (
 $St^{+}=21.1$
) are reliable, we considered an extra case with particles of a very high density compared to the fluid (
 $\unicode[STIX]{x1D70C}_{p}/\unicode[STIX]{x1D70C}\approx 40\,000$
) on the same resolution as in the DNS study by Nasr et al. (Reference Nasr, Ahmadi and McLaughlin2009) so that
 $N_{p}/N_{c}>1$
for the same
 $St^{+}=21.2$
. Upon comparison with case H (
 $N_{p}/N_{c}<1$
,
 $St^{+}=21.2$
), we found no qualitative difference between them (not shown here). Therefore, we believe that our results for the highest Stokes numbers are not significantly affected by numerical artefacts.
For time-efficient, high-accuracy calculation of
 $\tilde{u} _{i}$
, we employed the four-point Hermite interpolation scheme in the
 $x$
and
 $z$
directions and the fifth-order Lagrange polynomial interpolation scheme in the
 $y$
direction (Choi, Yeo & Lee Reference Choi, Yeo and Lee2004). Time advancement for (2.4) and (2.5) was performed using the third-order three-stage Runge–Kutta scheme, simultaneously with that for the flow field (Rouson & Eaton Reference Rouson and Eaton2001).
Particle vertical locations and streamwise velocities ensemble averaged over particles that have hit the bottom of the channel after injection at the upper wall as a function of time from the moment of the first particle–wall collision: (a)
 $St^{+}=0.81$
, (b)
 $St^{+}=2.65$
, (c)
 $St^{+}=5.3$
, (d)
 $St^{+}=10.6$
and (e)
 $St^{+}=21.2$
. The particle trajectory and velocity statistics were normalized by the particle radius
 $r_{p}(=d_{p}/2)$
and
 $r_{p}u_{\unicode[STIX]{x1D70F}}^{2}/\unicode[STIX]{x1D708}$
, respectively. For all the cases,
 $\unicode[STIX]{x1D70C}_{p}/\unicode[STIX]{x1D70C}=833$
and
 $g=0.077u_{\unicode[STIX]{x1D70F}}^{3}/\unicode[STIX]{x1D708}$
.

2.3 Particle boundary condition
In order to determine the proper boundary condition for particles hitting the bottom wall, we examine the behaviour of heavy particles near the walls in horizontal turbulent channel flow in this subsection. We tracked the trajectories of 100 000 particles that were released simultaneously at random locations in the horizontal plane at the upper wall (i.e. a distance of a particle radius from the upper wall) with the interpolated horizontal fluid velocities and the vertical Stokes terminal velocity. Then, ensemble averages over the trajectories were performed without considering the feedback force of particles on the fluid. Figure 1 shows the average particle vertical locations and streamwise velocities for particles that have hit the bottom of the channel after injection at the upper wall as a function of time from the moment of the first particle–wall collision, for the several particle parameters which will be used in the two-way coupled simulations. Note that a perfectly elastic collision of particles with the walls was assumed in this study, as in most previous DNS studies for turbulent channel flow. In the figure, the conditionally ensemble-averaged trajectories eventually reach
 $y=r_{p}(=d_{p}/2)$
after a collision process between the particles and the channel bottom (although not shown here, the trajectories are never re-entrained into the flow even after several thousand wall time units), and the average particle streamwise velocities asymptotically approach the mean fluid velocity at
 $y=r_{p}$
, indicating that the particle forces on the fluid become negligible on average at some time after the occurrence of the first collision. Therefore, a particle that has ever collided with the lower wall is to be removed after its reaction with the fluid is no longer significant, i.e. after 6, 20, 40, 80, 160 wall time units following the first collision, respectively, for
 $St^{+}=0.81$
, 2.65, 5.3, 10.6, 21.2 (on the basis of the results of figure 1) in our two-way coupled simulations. Then, we release another particle at a distance of a particle radius from the upper wall (i.e. at
 $y=2\unicode[STIX]{x1D6FF}-r_{p}$
), maintaining the total number of particles constant. The horizontal location of this new particle is chosen at random, and it begins settling with the interpolated horizontal fluid velocities and vertical Stokes terminal velocity.
In order to minimize the effect of this artificial initial condition of particle velocity, the feedback effect of the particles released at the upper wall on the fluid is taken into account only after they have reached on average a distance of
 $12\unicode[STIX]{x1D708}/u_{\unicode[STIX]{x1D70F}}$
away from the upper wall. By doing this, we can focus on the two-way interaction in regions where the coherent ejection motion of the fluid (away from the upper wall) becomes dominant, because its contribution to the Reynolds shear stress becomes significant at distances larger than 12 viscous lengths from the wall (Kim et al.
Reference Kim, Moin and Moser1987). In figure 2, the horizontally averaged particle number density obtained when the ensemble-averaged trajectory of the particles released at the upper wall reaches
 $y=2\unicode[STIX]{x1D6FF}-12\unicode[STIX]{x1D708}/u_{\unicode[STIX]{x1D70F}}$
, normalized by the average number density over the entire channel, is shown along the vertical direction for each Stokes number. Here, the particle number density is defined as the number of particles per unit volume. In the figure, despite the same mean vertical location, the instantaneous concentration distribution of the particles depends strongly on the Stokes number. With decreasing Stokes number, the peak concentration near the upper wall is reduced, while the concentration distribution becomes more skewed toward the core region (away from the wall), consistent with Dorgan & Loth (Reference Dorgan and Loth2004) and Dorgan et al. (Reference Dorgan, Loth, Bocksell and Yeung2005).
Vertical profiles of the horizontally averaged particle number density when the ensemble-averaged trajectory of particles released at the upper wall reaches
 $y=2\unicode[STIX]{x1D6FF}-12\unicode[STIX]{x1D708}/u_{\unicode[STIX]{x1D70F}}$
, normalized by the average number density over the entire channel, for the same particle parameters as in figure 1.

In our two-way coupled DNS, a fully developed flow field for the
 $Re_{\unicode[STIX]{x1D70F}}=180$
channel simulation is used as the initial flow data. Then, the initial distribution for particles is a random uniform distribution over the entire channel domain, and the initial particle velocities are given by the interpolated fluid velocities at the particle locations. With the above-mentioned boundary conditions for the particles, the number of effective particles that do affect the fluid must be somewhat smaller than the total number of particles. After the initial uniform distribution, two-way coupling starts when the appearance of the effective particles near the upper wall and the particle removal at the lower wall are balanced at a statistically steady rate. Note that the injected particles at the upper wall always constituted less than 0.03 % of the total particles per time step for all the considered cases; the ratio was kept less than 0.002 %, 0.007 %, 0.013 %, 0.02 %, 0.03 % for
 $St^{+}=0.81$
, 2.65, 5.3, 10.6 and 21.2, respectively, throughout the entire simulation time. A time average for turbulence statistics is performed during 1500 wall time units. For particles moving outside the flow domain in the horizontal directions, periodic boundary conditions are applied, and inter-particle collisions are not included because a dilute suspension is assumed in our simulations.
Previously, a similar treatment was considered for particle sediments at the bottom. In their two-way coupled DNS study, Oresta & Prosperetti (Reference Oresta and Prosperetti2013) considered a liquid spray falling through a weakly turbulent Rayleigh–Bénard gas flow under gravity by removing and reinjecting the particles at the hot bottom and cold top plates, respectively, of a cylinder. Recently, Park, O’Keefe & Richter (Reference Park, O’Keefe and Richter2018) considered aeolian saltation by removing and reinserting non-isothermal particles at the lower boundary and in the lower 10 % of the domain, respectively, in a two-way coupled DNS study of Rayleigh–Bénard turbulence.
By using the point-particle approach without particle–particle collisions, which is adopted in this study, it is impossible to correctly simulate the presence of a sediment layer formed on the bottom wall over a long period of time (Soldati & Marchioli Reference Soldati and Marchioli2012). Instead, as described above, we eliminated deposited particles after several collisions with the lower wall and reinjected new particles into the flow near the upper wall to observe particle gravitational settling through the mean shear, which is the main subject of this paper. We believe that our investigation of this settling process will extend not only the Gerashchenko et al. (Reference Gerashchenko, Sharp, Neuscamman and Warhaft2008) experiment, but also the DNS studies by Dorgan & Loth (Reference Dorgan and Loth2004) and Dorgan et al. (Reference Dorgan, Loth, Bocksell and Yeung2005), in which small, heavy particles were released at the edge of the viscous sublayer near the upper wall in a horizontal boundary layer, to the two-way coupling regime. Furthermore, streamwise velocity streaks that are comparable with those of near-wall turbulence exist even in homogeneous shear turbulence (Lee, Kim & Moin Reference Lee, Kim and Moin1990) and in liquid shear layers formed by gas flows at a free surface (Rashidi & Banerjee Reference Rashidi and Banerjee1990). Since our focus is on the direct interaction between settling particles and those structures, the present study is also relevant to such turbulent shear flows in the absence of a wall.
Finally, it is worth mentioning that almost no momentum is added or eliminated by our particle treatment at both walls. When particles are released very near the top wall with the streamwise fluid velocity, the added momentum is negligible. Elimination of particles hitting the bottom wall was performed when the momentum of the particles was almost suppressed as explained above. Only when the particles which are released from the top wall reach on average 12 wall unit distances from the top wall, is a certain amount of momentum added to the fluid by the particles since the particle feedback force is turned on suddenly. However, an estimation of this momentum for the worst case of
 $St^{+}=21.1$
yields that it is at most 0.15 % of the mean pressure gradient force.
3 Comparison with experimental observation
Before discussing our main results, we compared our simulation with the experiment of Gerashchenko et al. (Reference Gerashchenko, Sharp, Neuscamman and Warhaft2008), who measured Lagrangian acceleration statistics of water droplets of the order of
 $10~\unicode[STIX]{x03BC}\text{m}$
in a turbulent air boundary layer formed above a horizontally placed flat glass plate within a wind tunnel. In the experiment, an active grid was placed at the entrance of the wind tunnel to generate large-scale, high-intensity turbulence. The size of the flat plate was
 $3.3~\text{m}\times 0.67~\text{m}$
, and it was placed 0.9 m from the grid and 0.4 m above the tunnel floor. The measurements were carried out 2.7 m downstream of the leading edge, and the particles were injected from sprays downstream of the grid and humidifiers with feeding tubes 1.6 m from the measurement location at a very dilute suspension of the volume fraction
 $\unicode[STIX]{x1D719}_{v}\approx 1.2\times 10^{-7}$
. Two boundary layer momentum-thickness Reynolds numbers of
 $Re_{\unicode[STIX]{x1D703}}=840$
and 725 were considered by operating the active grid. For the
 $Re_{\unicode[STIX]{x1D703}}=840$
and 725 cases, the wall stress Reynolds numbers based on the friction velocity and boundary layer thickness corresponding to 99.5 % of the free-stream velocity were
 $Re_{\unicode[STIX]{x1D70F},\unicode[STIX]{x1D6FF}_{99.5}}=830$
and 470, respectively. The sprays produced a high particle Stokes number of
 $St^{+}=5.3$
at the high Reynolds number and the humidifiers produced two low Stokes numbers of
 $St^{+}=0.81$
and 0.72 at the high and low Reynolds numbers, respectively. The magnitudes of the gravitational accelerations were
 $g^{+}=0.077$
and 0.092 in wall units for the high and low Reynolds number flows, respectively. A high-speed camera moving at the mean flow speed tracked the particles over a streamwise distance of 50 cm with a sampling area of
 $3.3~\text{cm}\times 3.3~\text{cm}$
. The boundary layer image was divided into strips to collect the acceleration statistics at various heights in the boundary layer.
The experiment of Gerashchenko et al. (Reference Gerashchenko, Sharp, Neuscamman and Warhaft2008) was satisfactorily reproduced previously by Lavezzo et al. (Reference Lavezzo, Soldati, Gerashchenko, Warhaft and Collins2010) without considering the two-way coupling effect. They also performed DNS of turbulent channel flow with Lagrangian particle tracking. At the beginning of the simulations, they distributed 320 000 particles uniformly and randomly in the channel domain, and for meaningful comparisons with the experimental data, numerical results at an early time (i.e. for
 $35\leqslant t^{+}\leqslant 600$
) were used before the particles that had collected on the bottom of the channel after particle–wall elastic collisions due to gravity significantly affected the results. In their simulation, the Stokes numbers were determined so that the local Stokes numbers normalized by the Kolmogorov time scale of the flow
 $St_{K}$
in the inner layer were comparable with those in the experiment.
(a) Mean and (b) root-mean-square (r.m.s.) accelerations of particles in the streamwise direction. Lines, present numerical results for cases A–C; symbols, experimental results by Gerashchenko et al. (Reference Gerashchenko, Sharp, Neuscamman and Warhaft2008).

Probability density functions of particle streamwise accelerations at
 $y^{+}=7.5$
, 18 and 37 for cases (a) A, (b) B and (c) C. Lines present numerical results; symbols, experimental results by Gerashchenko et al. (Reference Gerashchenko, Sharp, Neuscamman and Warhaft2008). For visual clarity, the results obtained at
 $y^{+}=18$
and 37 were multiplied by 10 and 100, respectively.

In this section, we did not include two-way coupling in the simulation because the particle volume fraction in Gerashchenko et al. (Reference Gerashchenko, Sharp, Neuscamman and Warhaft2008) was very low. We used the same Stokes numbers, particle diameters and magnitude of gravity as in the experiment when normalized by wall units, although our Reynolds number was lower than that in the experiment. We collected 1 000 000 Lagrangian particle trajectories over a long period of time (i.e.
 $1500\leqslant t^{+}\leqslant 3000$
) to evaluate particle acceleration statistics. The parameters used in this section are listed as cases A, B and C in table 1.
Figures 3 and 4 display our numerical results, along with the experimental observation by Gerashchenko et al. (Reference Gerashchenko, Sharp, Neuscamman and Warhaft2008). The mean
 $\langle a_{p,x}\rangle$
and root-mean-squared (r.m.s.) streamwise particle accelerations
 $\langle (a_{p,x}^{\prime })^{2}\rangle ^{1/2}$
are shown in figure 3(a,b), respectively, where
 $a_{p,x}$
is the streamwise particle acceleration. Hereinafter, the prime symbol,
 $^{\prime }$
, is used to indicate the fluctuation and angled brackets,
 $\langle \cdot \rangle$
, denote the mean (i.e. the average over time and horizontal coordinates in the simulations). Note that because the two flows in the simulation and experiment are, respectively, a turbulent boundary layer and channel flow, a direct comparison between them is possible only for regions near the lower wall. In figure 3, the qualitative near-wall features of the experimental results (the mean decelerations and enhanced particle acceleration variances at higher Stokes number) are well predicted by the numerical simulation.
Figure 4 shows the probability density functions (p.d.f.) of the streamwise particle acceleration normalized by its r.m.s. value (i.e.
 $a_{p,x}/\langle (a_{p,x}^{\prime })^{2}\rangle ^{1/2}$
) at the three different wall-normal locations of
 $y^{+}=7.5$
, 18 and 37. The p.d.f. from the simulation are in fairly good agreement with the experimental data. As the Stokes number increases and as the lower wall is approached, the acceleration p.d.f. show negatively skewed distributions with narrower tails. The noticeable changes in the particle acceleration statistics with increasing Stokes number, shown in figures 3 and 4, are due to gravitational settling; those changes vanished under zero gravity in Lavezzo et al. (Reference Lavezzo, Soldati, Gerashchenko, Warhaft and Collins2010), indicating the significance of considering the effect of gravity.
Despite this good qualitative agreement, quantitative differences are observed, especially in the case of
 $St^{+}=5.3$
, as shown in figures 3 and 4. This may be because the sprays employed in the experiment produce droplets with a widespread size distribution for the case with the highest Stokes number, as mentioned in Gerashchenko et al. (Reference Gerashchenko, Sharp, Neuscamman and Warhaft2008) (see figure 8 in their paper), while our particles are equal in size for each case. Furthermore, as pointed out by Lavezzo et al. (Reference Lavezzo, Soldati, Gerashchenko, Warhaft and Collins2010), it is hard to accurately capture the interactions between the water droplets and the wall through the simple particle–wall elastic collision model. Considering these discrepancies between the experiment and simulation conditions, the results of this section validate our numerical methods for fluid motion and particle tracking.
4 Two-way interaction between settling particles and near-wall turbulence
From now on, we take into account the two-way coupling effect over a Stokes number range of
 $0.81\leqslant St^{+}\leqslant 21.2$
, including not only the Stokes numbers used in the experiment by Gerashchenko et al. (Reference Gerashchenko, Sharp, Neuscamman and Warhaft2008), but also the relatively large Stokes numbers, in order to investigate the role of gravity when heavy particles preferentially accumulate in response to coherent structures of near-wall turbulence, such as near-wall streamwise vortices or low-speed streaks (Liu & Agarwal Reference Liu and Agarwal1974; Picciotto et al.
Reference Picciotto, Marchioli, Reeks and Soldati2005; Marchioli, Picciotto & Soldati Reference Marchioli, Picciotto and Soldati2007; Lee & Lee Reference Lee and Lee2015). Consistent with the experiment by Gerashchenko et al. (Reference Gerashchenko, Sharp, Neuscamman and Warhaft2008), the particle-to-fluid density ratio is
 $\unicode[STIX]{x1D70C}_{p}/\unicode[STIX]{x1D70C}=833$
(water droplets in air turbulence) and the magnitude of the dimensionless gravitational acceleration is
 $g^{+}=0.077$
(corresponding to the Earth’s gravitational acceleration when air flows with
 $u_{\unicode[STIX]{x1D70F}}=0.124~\text{m}~\text{s}^{-1}$
). Then, the particle sizes are
 $0.1323\leqslant d_{p}^{+}\leqslant 0.6768$
, which are smaller than the Kolmogorov length scale of the flow. For each case, the total number of Lagrangian particles was determined so that it corresponded to a particle volume fraction of
 $\unicode[STIX]{x1D719}_{v}\approx 6\times 10^{-5}$
(a particle mass fraction of
 $\unicode[STIX]{x1D719}_{m}\approx 5\times 10^{-2}$
), and the effective particles that exert their feedback force on the fluid accounted for at least 95 % of the total particles at every time step. The parameters considered in this section are listed as cases D–H in table 1.
It is important to note that for all cases considered in this study (including the cases with
 $St^{+}=10.6$
and 21.2), the particle Reynolds numbers remain of the order of unity on average (in fact, the maximum
 $\langle Re_{p}\rangle$
does not exceed 4.5, although not shown here). For this
 $Re_{p}$
range, the present numerical procedure for two-way coupling has been successfully applied to DNS studies for wall-bounded turbulence by several authors (Li et al.
Reference Li, McLaughlin, Kontomaris and Portela2001; Mito & Hanratty Reference Mito and Hanratty2006; Dritselis & Vlachos Reference Dritselis and Vlachos2011; Richter Reference Richter2015).
4.1 Modification of turbulence statistics
Mean streamwise fluid velocities for the particle-free case and cases D–H.

Mean streamwise fluid velocity profiles
 $\langle u_{1}^{\ast }\rangle$
normalized by
 $u_{\unicode[STIX]{x1D70F}}$
and
 $\unicode[STIX]{x1D708}$
of the respective particle-laden flow as a function of the distance (a)
 $2\unicode[STIX]{x1D6FF}^{\ast }-y^{\ast }$
and (b)
 $y^{\ast }$
from the upper and lower walls, respectively, in a semi-log plot for cases D–H. The thin solid line indicates the law of the wall,
 $\langle u_{1}^{\ast }\rangle =y^{\ast }$
and
 $\langle u_{1}^{\ast }\rangle =2.44\ln y^{\ast }+5.2$
.

Figure 5 shows the modifications of the mean streamwise fluid velocity
 $\langle u_{1}^{+}\rangle$
due to the presence of particles. With increasing Stokes number, the mean fluid velocities decrease in the upper part of the channel, while the maximum velocity is reduced and observed further below the geometric channel centreline (
 $y/\unicode[STIX]{x1D6FF}=1$
). Near the lower wall, the mean fluid velocities are little changed when
 $St^{+}=0.81$
and they are enhanced as the Stokes number increases further up to
 $St^{+}=10.6$
. The mean values between the two largest Stokes numbers (
 $St^{+}=10.6$
and 21.2) are approximately the same in the region
 $0.2<y/\unicode[STIX]{x1D6FF}<0.6$
, but the enhancement at
 $y^{+}\approx 10$
is more pronounced for
 $St^{+}=5.3$
compared to that for
 $St^{+}=21.2$
(this is not visible in the figure, however, we will show this later on an increased scale in figure 18). The results of figure 5 indicate that the streamwise momentum of the fluid is carried in the direction of gravity by settling particles, as shown later.
Figure 6(a,b) displays the mean streamwise fluid velocity profiles
 $\langle u_{1}^{\ast }\rangle$
normalized by wall units of the respective particle-laden flow (represented by the superscript
 $\ast$
) in the upper and lower parts of the channel, respectively, separated by the location of the peak
 $\langle u_{1}^{+}\rangle$
, as a function of the distance
 $2\unicode[STIX]{x1D6FF}^{\ast }-y^{\ast }$
and
 $y^{\ast }$
from the upper and lower walls, respectively. In the figure, the law of the wall with the von Kármán constant 0.41 and the additive constant 5.2 is also illustrated for comparison. Note that the mismatch of
 $\langle u_{1}^{\ast }\rangle$
at the location of the peak
 $\langle u_{1}^{+}\rangle$
indicates that
 $u_{\unicode[STIX]{x1D70F}}$
, used for normalization in figure 6(a,b), is differently modified at the upper and lower walls, respectively. In the upper part of the channel, the linear law still holds for the particle-laden cases, while as the Stokes number increases,
 $\langle u_{1}^{\ast }\rangle$
is slightly reduced in the buffer layer and lower part of the log layer, and its slope is enhanced around the core region compared to the log law. Note that, for
 $St^{+}=10.6$
and 21.2, the log law region where
 $\langle u_{1}^{\ast }\rangle \propto \ln y^{\ast }$
nearly disappears, while steeper slopes are instead observed in the profiles. On the other hand,
 $\langle u_{1}^{\ast }\rangle$
is significantly reduced with increasing Stokes number throughout the lower part of the channel.
Root-mean-square (a) streamwise, (b) wall-normal and (c) spanwise fluid velocity fluctuations, and (d) Reynolds shear stresses for the particle-free case and cases D–H.

In figure 7(a–d), the changes in the r.m.s. fluid velocity fluctuations
 $\langle (u_{i}^{\prime +})^{2}\rangle ^{1/2}$
(turbulence intensities) and the Reynolds shear stresses
 $\langle u_{1}^{+}u_{2}^{+}\rangle$
due to the presence of particles are illustrated. In the figure, a notable observation is that, with increasing Stokes number, all of the three components of turbulence intensities and the Reynolds shear stresses are suppressed near the lower wall while they are augmented in the upper part of the channel for
 $St^{+}\geqslant 2.65$
. Only the peak value of the streamwise fluctuation near the top wall slightly decreases with increasing Stokes number, which is probably not directly caused by the particles settling in that location because there are almost no effective particles that actually exert their feedback forces on the fluid there, as shown in figure 2. The results shown in figure 7 indicate that near-wall turbulence is altered in different ways depending on the sign of the mean shear rate
 $\text{d}\langle u_{1}\rangle /\text{d}y$
that the settling particles experience. In the next subsection, we will provide an explanation for this different modification behaviour. In particular, turbulence augmentation is observed even at
 $y/\unicode[STIX]{x1D6FF}=1$
, and hence the local minimum location in the turbulence intensity profiles, which is
 $y=\unicode[STIX]{x1D6FF}$
for the particle-free case, shifts toward the channel bottom. Accordingly, the Reynolds shear stress profiles cross zero below
 $y=\unicode[STIX]{x1D6FF}$
. The attenuation of turbulence near the lower wall is consistent with previous experimental observations (Tsuji & Morikawa Reference Tsuji and Morikawa1982; Kussin & Sommerfeld Reference Kussin and Sommerfeld2002). On the other hand, for the upper part of the channel, the turbulence augmentation is affected by the injection of particles at the upper wall. Interestingly, a similar trend was experimentally observed by Wu et al. (Reference Wu, Wang, Liu, Li, Zhang and Zheng2006), who measured the turbulence modification with polythene beads that settled in a horizontal turbulent channel flow, using a two-phase particle image velocimetry. The particle sizes were
 $60~\unicode[STIX]{x03BC}\text{m}$
and
 $110~\unicode[STIX]{x03BC}\text{m}$
, which were slightly smaller and larger than the Kolmogorov length scale of the flow, respectively, and the particle-to-fluid density ratio was
 $\unicode[STIX]{x1D70C}_{p}/\unicode[STIX]{x1D70C}\approx 830$
. However, it is unclear whether the experimentally observed turbulence enhancement is physically associated with our numerical result.
Figure 8(a–c) shows the r.m.s. fluid vorticity fluctuations
 $\langle (\unicode[STIX]{x1D714}_{i}^{\prime +})^{2}\rangle ^{1/2}$
for the particle-free and particle-laden cases. In the outer layer (including the core region) in the upper part of the channel and near the lower wall, the overall trends for the modifications of the r.m.s. vorticity fluctuations are similar to those for the turbulence intensities and Reynolds shear stresses shown in figure 7. As will be shown in the next subsection by investigating instantaneous flow fields, the vorticity fluctuation enhancement and attenuation are consistent with an increased occurrence and suppression of small-scale vortical structures, respectively. A more intricate behaviour is observed very close to the upper wall, where no suppression is observed for the streamwise component of the r.m.s. vorticity fluctuations, while their wall-normal (including the local peak value) and spanwise components are reduced with increasing Stokes number. In the inset of figure 8(c), the spanwise r.m.s. vorticity fluctuations increase with increasing Stokes number up to
 $St^{+}=5.3$
, for which the Stokes number
 $St_{K}$
is approximately unity on the basis of the Kolmogorov time scale near the wall, and then decrease with further increasing
 $St^{+}$
in the viscous sublayer near the lower wall (
 $y^{+}<5$
). For the largest Stokes number, the spanwise vorticity fluctuations are reduced compared to the particle-free case. This spanwise r.m.s. vorticity fluctuation enhancement near the lower wall is due to enhanced shear fluctuations, because
 $\unicode[STIX]{x1D714}_{3}^{\prime }=-\text{d}u_{1}^{\prime }/\text{d}y$
at the wall. The
 $\langle (\text{d}u_{1}^{\prime }/\text{d}y)^{2}\rangle$
enhancement close to the lower wall is due to the fact that the settling particles carry the higher streamwise fluid momentum of the outer layer to the near-wall region, mainly via ‘sweeps’ by the near-wall streamwise vortices (Marchioli & Soldati Reference Marchioli and Soldati2002; Righetti & Romano Reference Righetti and Romano2004). This momentum transfer may be maximized when the particle time scale is comparable to the characteristic fluid time scale of the vortical structures. Among the Stokes numbers considered in this study, the particle response time for
 $St^{+}=5.3$
best matches the vortex time scale, defined as the inverse of the r.m.s. streamwise fluid vorticity
 $1/\langle (\unicode[STIX]{x1D714}_{x}^{\prime +})^{2}\rangle ^{1/2}$
, in the buffer layer, where near-wall streamwise vortices mostly occur (Soldati & Marchioli Reference Soldati and Marchioli2009; Lee & Lee Reference Lee and Lee2015). Therefore, the increase in
 $\langle (\text{d}u_{1}^{\prime }/\text{d}y)^{2}\rangle$
is most pronounced at
 $St^{+}=5.3$
, as shown in the inset of figure 8(c).
Root-mean-square (a) streamwise, (b) wall-normal and (c) spanwise fluid vorticity fluctuations for the particle-free case and cases D–H. In (c), the inset indicates
 $\langle (\unicode[STIX]{x1D714}_{3}^{\prime +})^{2}\rangle ^{1/2}$
near the lower wall on an increased scale.

4.2 Particle behaviour and turbulence modification mechanism
In near-wall turbulence, the spatial distribution of inertial particles under the influence of hydrodynamic drag forces exhibits two main patterns in terms of their local accumulation, one due to preferential concentration out of turbulent vortical regions and the other due to turbophoresis (preferential accumulation in lifted low-speed streaks) (Sardina et al.
Reference Sardina, Schlatter, Brandt, Picano and Casciola2012; Lee & Lee Reference Lee and Lee2015; Richter et al.
Reference Richter, Garcia and Astephen2016). In order to gain further detailed information on the role of wall-normal gravity in the turbulence modification behaviour shown in § 4.1, in this subsection we investigate the gravitational effect on these local accumulation patterns and the consequent modification of coherent turbulent structures for two different cases,
 $St^{+}=5.3$
and
 $St^{+}=21.2$
, at which preferential concentration and turbophoresis are distinctly present, respectively (Lee & Lee Reference Lee and Lee2015).
Instantaneous distributions of particles near a streamwise fluid vorticity field in the
 $y^{+}$
–
 $z^{+}$
plane (left) and profiles of the horizontally averaged particle number density normalized by its initial value (right) for (a)
 $St^{+}=5.3$
(case F) and (b)
 $St^{+}=21.2$
(case H). Red and blue colours represent, respectively, positive and negative values for the intense streamwise fluid vorticity, larger in magnitude than the maximum r.m.s. value. Black dots denote the locations of particles collected over a streamwise distance of approximately 35 viscous lengths.

Instantaneous velocity vectors of rapidly settling particles near a streamwise fluid velocity field in the
 $y^{+}$
–
 $z^{+}$
plane for (a)
 $St^{+}=5.3$
(case F) and (b)
 $St^{+}=21.2$
(case H). Only particles that settle faster than (a) the maximum r.m.s. vertical fluid velocity fluctuation
 $\langle (u_{2}^{\prime })^{2}\rangle ^{1/2}\approx 1$
and (b) the Stokes terminal velocity
 $\unicode[STIX]{x1D70F}_{p}^{+}g^{+}=1.6324$
are shown. The results are for the particle distributions and flow fields shown in figure 9.

Figure 9(a,b) displays the instantaneous distributions of settling particles in comparison with a streamwise fluid vorticity field in the
 $y^{+}$
–
 $z^{+}$
plane and the profiles of the horizontally averaged particle number density,
 $n(y,t)$
, normalized by its initial value,
 $n_{0}(y)$
, for
 $St^{+}=5.3$
and 21.2, respectively. For the same particle distributions and flow fields as in figure 9(a,b), the velocity vectors for rapidly settling particles are shown, along with the streamwise fluid velocity contours, in figure 10(a,b), respectively. Note that in figure 10, only particles that settle faster than the maximum r.m.s. vertical fluid velocity fluctuation
 $\langle (u_{2}^{\prime })^{2}\rangle ^{1/2}\approx 1$
and the Stokes terminal velocity
 $\unicode[STIX]{x1D70F}_{p}^{+}g^{+}=1.6324$
were selected to distinguish the rapidly settling particles for
 $St^{+}=5.3$
and 21.2, respectively. In figure 9(a,b), the average particle number density remains almost constant at
 $n\approx n_{0}$
for
 $St^{+}=5.3$
and at
 $n\approx 0.6n_{0}$
for
 $St^{+}=21.2$
throughout the channel width, except in the viscous sublayer near the upper and lower walls. This indicates that a volume fraction of at least
 $\unicode[STIX]{x1D719}_{v}\approx 3.6\times 10^{-5}$
is maintained over the bulk of the flow by the particle injection at the upper wall. The extremely high peak of the average particle number density is observed at the lower wall (i.e. at
 $y=r_{p}$
), in particular for
 $St^{+}=21.2$
, but this may not significantly affect the fluid because the influence of the no-slip condition is still dominant there. In figure 9(a), preferential concentration of particles with
 $St^{+}=5.3$
in regions of low streamwise fluid vorticity fluctuations is clearly observed. This is because the Stokes number
 $St^{+}=5.3$
matches the vortex time scale related to the intense streamwise vorticity fluctuations (Richter & Sullivan Reference Richter and Sullivan2013; Lee & Lee Reference Lee and Lee2015). Furthermore, it corresponds to a Stokes number of
 $St_{K}\approx 1$
in the buffer layer. In homogeneous isotropic turbulence under gravity, preferential concentration of heavy particles is responsible for their preferential sweeping in regions of descending fluid associated with local vortices and thus an increase in their average settling velocity over a similar Stokes number range (
 $St_{K}\approx 1$
) (Wang & Maxey Reference Wang and Maxey1993; Yang & Shy Reference Yang and Shy2005). This preferential sweeping effect also leads to a large downward particle force on the fluid in one side of a local vortical structure, and as a result, the vortical structures are stretched in the direction of gravity (Ferrante & Elghobashi Reference Ferrante and Elghobashi2003; Yang & Shy Reference Yang and Shy2005; Bosse et al.
Reference Bosse, Kleiser and Meiburg2006). In near-wall turbulence, ‘ejections’ of low-speed fluid away from the upper wall and ‘sweeps’ of high-speed fluid toward the lower wall associated with streamwise vortical structures serve as such descending fluid for preferential sweeping. Therefore, particles rapidly settle in regions of ejections and sweeps in the upper and lower parts of the channel, respectively, as clearly seen in figure 10(a). These rapidly settling particles may enhance the surrounding fluid motions by exerting a large downward force on the fluid. In particular, lift-up of low-speed fluid (away from the wall) by ejections associated with streamwise vortices is responsible for a lifted low-speed streak that has been regarded as a fundamental element for the creation of small-scale vortical structures, such as hairpin vortices, in near-wall turbulence (Robinson Reference Robinson1991; Panton Reference Panton2001). As will be confirmed later, this indicates that more small-scale vortical structures are produced far away from the upper wall as low-speed fluid is pulled through preferential sweeping in ejections (see figures 13 and 14
a,b).
Instantaneous distributions of particles near coherent structures in the lower part of the channel in the
 $y^{+}$
–
 $z^{+}$
plane for
 $St^{+}=5.3$
(case F). Solid contour lines of streamwise fluid velocities with a contour level of
 $u_{1}^{+}=(3,5,7,9,11)$
and white arrow vectors of the vertical and spanwise components of the fluid velocity
 $(u_{2}^{+},u_{3}^{+})$
are shown. In (a), black arrow vectors and colours on dots represent the vertical and spanwise components
 $(v_{2}^{+},v_{3}^{+})$
and the streamwise component of the particle velocity
 $v_{1}^{+}$
, respectively. In (b), black arrow vectors and colours on dots indicate the vertical and spanwise components
 $(-(F_{2}/m_{p})^{+},-(F_{3}/m_{p})^{+})$
and the streamwise component of the feedback force of particles on the fluid per the particle mass
 $-(F_{1}/m_{p})^{+}$
, respectively.
Instantaneous distributions of particles near coherent structures in the lower part of the channel in the
 $y^{+}$
–
 $z^{+}$
plane for
 $St^{+}=21.2$
(case H). Solid contour lines, white and black arrow vectors, and colours on dots in (a,b) have the same meaning as in figure 11(a,b), respectively.

Instantaneous distributions of isosurfaces of (a)
 $\unicode[STIX]{x1D706}_{2}^{+}=-0.012$
and (b)
 $u_{1}^{+}=10$
in the lower half of the channel for the particle-free case. Colour contours of the vertical distance from the lower wall
 $y^{+}$
are plotted on the
 $\unicode[STIX]{x1D706}_{2}^{+}=-0.012$
and
 $u_{1}^{+}=10$
isosurfaces. The results are shown throughout the full domain in the horizontal directions.

Instantaneous distributions of isosurfaces of (a,c)
 $\unicode[STIX]{x1D706}_{2}^{+}=-0.012$
and (b,d)
 $u_{1}^{+}=10$
in the upper part of the channel based on the peak of
 $\langle u_{1}^{+}\rangle$
(upside-down view) for (a,b)
 $St^{+}=5.3$
(case F) and for (c,d)
 $St^{+}=21.2$
(case H). Colour contours of the vertical distance from the upper wall
 $2\unicode[STIX]{x1D6FF}^{+}-y^{+}$
are plotted on the
 $\unicode[STIX]{x1D706}_{2}^{+}=-0.012$
and
 $u_{1}^{+}=10$
isosurfaces. The results are shown throughout the full domain in the horizontal directions.

Instantaneous distributions of isosurfaces of (a,c)
 $\unicode[STIX]{x1D706}_{2}^{+}=-0.012$
and (b,d)
 $u_{1}^{+}=10$
in the lower part of the channel (based on the peak of
 $\langle u_{1}^{+}\rangle$
) for (a,b)
 $St^{+}=5.3$
(case F) and for (c,d)
 $St^{+}=21.2$
(case H). Colour contours of the vertical distance from the lower wall
 $y^{+}$
are plotted on the
 $\unicode[STIX]{x1D706}_{2}^{+}=-0.012$
and
 $u_{1}^{+}=10$
isosurfaces. The results are shown throughout the full domain in the horizontal directions.

Several previous investigators have shown that the local accumulation of heavy particles due to turbophoresis, i.e. the preferential accumulation in ejections associated with near-wall streamwise vortices (see figure 2 of Soldati & Marchioli Reference Soldati and Marchioli2009), becomes efficient for similar Stokes numbers to our
 $St^{+}=21.2$
case, assuming that the effect of gravity is negligible or is directed in the mean flow direction (Marchioli et al.
Reference Marchioli, Giusti, Salvetti and Soldati2003, Reference Marchioli, Picciotto and Soldati2007; Lee & Lee Reference Lee and Lee2015). However, when the gravitational settling occurs at this Stokes number, it appears in figure 9(b) that this accumulation pattern disappears near the upper wall due to a large Stokes terminal fall velocity of
 $\unicode[STIX]{x1D70F}_{p}^{+}g^{+}=1.6324$
, which is even greater than the maximum
 $\langle (u_{i}^{\prime +})^{2}\rangle ^{1/2}$
. Furthermore, in figure 10(b), the rapidly settling particles exhibit very little spanwise motion until their arrival at the bottom, indicating the significance of the effect of crossing trajectories, which accounts for a decrease in the turbulent dispersion of heavy particles with a large terminal fall velocity in comparison with that of fluid or light particles (Yudine Reference Yudine1959; Csanady Reference Csanady1963; Reeks Reference Reeks1977; Wells & Stock Reference Wells and Stock1983; Elghobashi & Truesdell Reference Elghobashi and Truesdell1992). Dorgan & Loth (Reference Dorgan and Loth2004) also observed the effect of crossing trajectories for heavy particles settling in a horizontal turbulent boundary layer. A distinctive feature of flow modification due to the particles is that near-wall low-speed fluid is very efficiently transported away from the upper wall with rapidly settling particles, across almost the channel half-width
 $\unicode[STIX]{x1D6FF}$
in the vertical direction (in particular, at
 $z^{+}\approx 600$
), and approximately
 $2\unicode[STIX]{x1D6FF}$
apart intermittently in the spanwise direction, as observed in figure 10(b). Furthermore, a comparison between figures 9(b) and 10(b) shows that streamwise vortex structures appear along the regions of low-speed fluid, vertically extended by rapidly settling particles in the upper part of the channel. In fact, as will be shown later, the number of small-scale vortical structures increases at quite large distances from the upper wall, as in the case of
 $St^{+}=5.3$
(see figure 14
c).
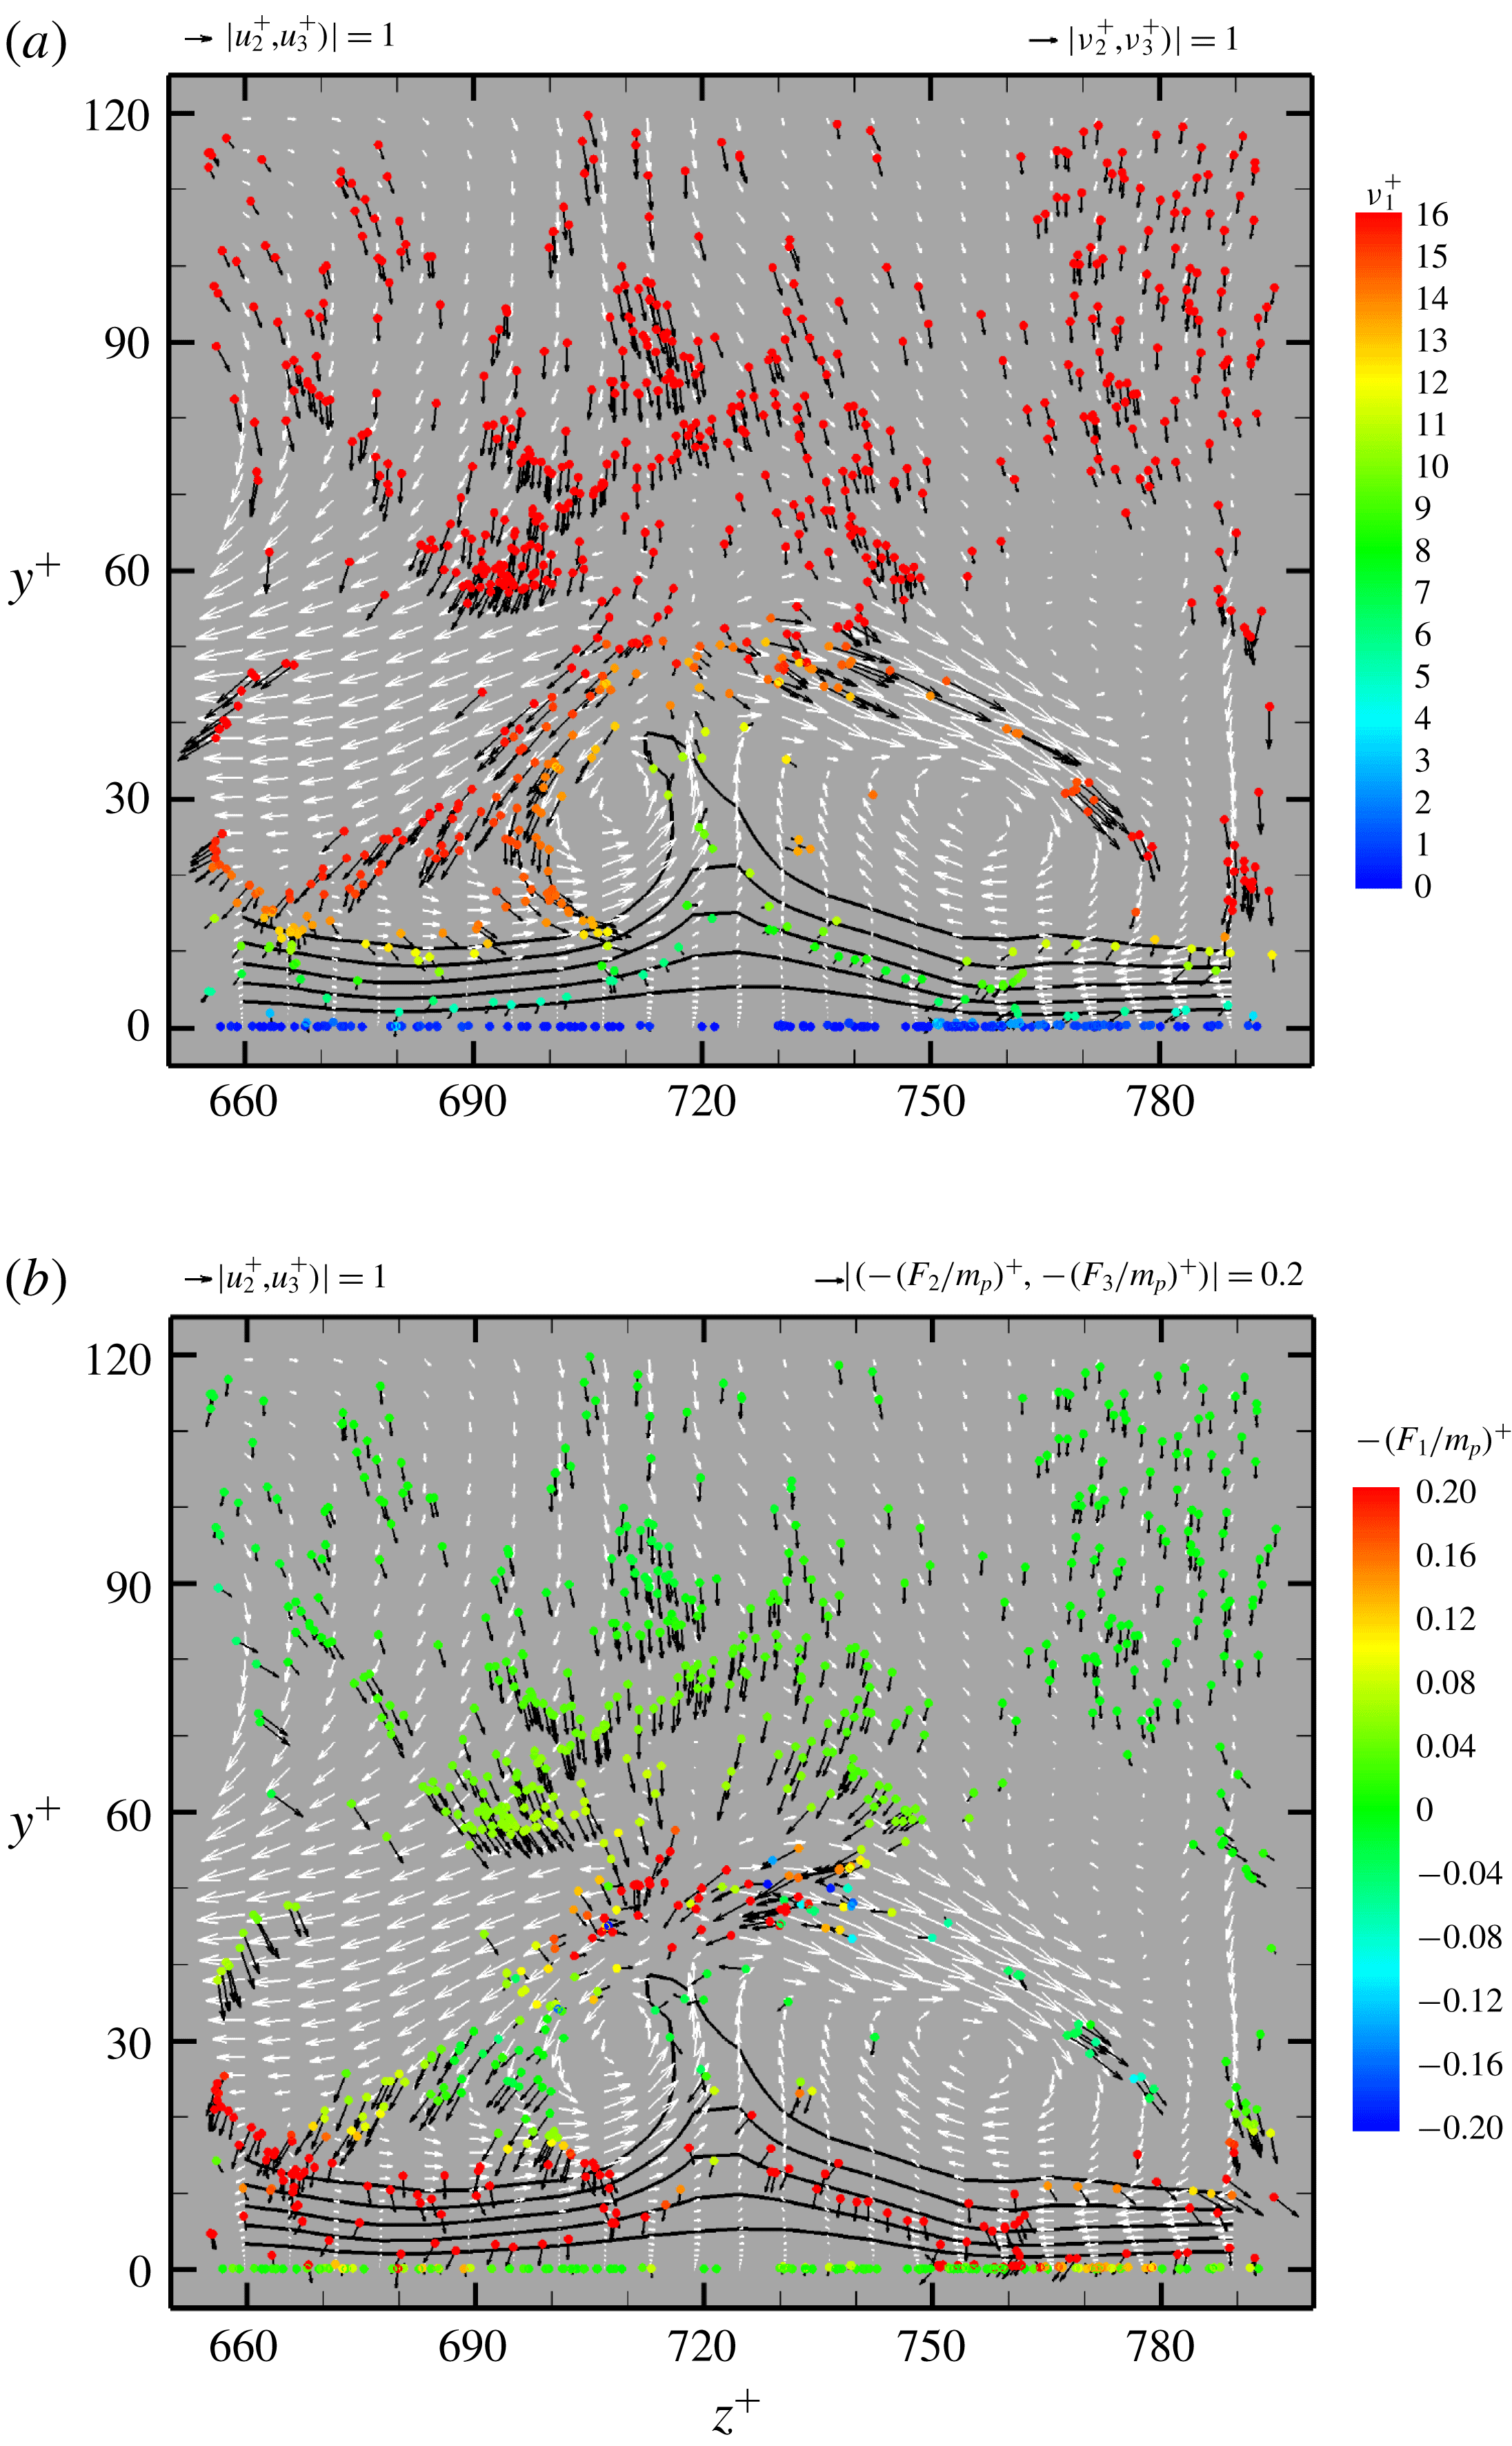
Figures 11 and 12 show the instantaneous particle velocities and feedback accelerations along with coherent near-wall streamwise vortices and a lifted low-speed streak near the lower wall in the
 $y^{+}$
–
 $z^{+}$
plane for
 $St^{+}=5.3$
and
 $St^{+}=21.2$
, respectively. It appears from figure 11(a) that when settling particles reach the wall region (the buffer layer and lower part of the log layer) where near-wall streamwise vortices are commonly observed, preferential sweeping occurs in coherent sweeps, consistent with the observation near the lower wall shown in figure 10(a). During the fast settling via sweeps, the particles maintain the high streamwise momentum of the outer layer (figure 11
a). Therefore, they experience a deceleration in the streamwise direction as the lower wall is approached, thereby exerting a positive streamwise feedback force on the fluid, as indicated by the red dots close to the lower wall in figure 11(b). These high-speed particles (i.e. swept to the wall by the preferential sweeping effect) contribute to the strong mean streamwise deceleration and negatively skewed streamwise acceleration distribution of the droplets near the lower wall found in the Gerashchenko et al.’s (Reference Gerashchenko, Sharp, Neuscamman and Warhaft2008) experiment and in Lavezzo et al.’s (Reference Lavezzo, Soldati, Gerashchenko, Warhaft and Collins2010) DNS and also shown in the present study (figures 3 and 4). Since the settling particles in sweeps can acquire enough vertical momentum to reach the wall without being affected by the ejection motion associated with the streamwise vortex from both gravity and the sweep motion of the fluid, it seems from figure 12 that only a few particles overcome the effect of gravity and move to the ejection region.
In figure 12, the effect of preferential concentration due to small-scale vortical structures is almost imperceptible, and the settling particles simply cross the regions of not only streamwise vortices but also a lifted low-speed streak with very little spanwise motion. Then, the feedback forces act to suppress the fluid motions associated with the coherent structures. In particular, the particles just passing vertically through a lifted low-speed streak exert large streamwise and vertical feedback forces against the turbulent velocities, as indicated by the red dots in the ejection region in figure 12(b). This eventually affects the formation of near-wall streamwise vortices, as will be shown later (see figure 15).
In figure 13, two typical coherent structures responsible for production of near-wall turbulence, lifted low-speed streamwise streaks and near-wall streamwise vortices, are visualized for an instantaneous flow field of the particle-free case, through an isosurface of the streamwise fluid velocity and the
 $\unicode[STIX]{x1D706}_{2}$
method, respectively (Jeong & Hussain Reference Jeong and Hussain1995; Jeong et al.
Reference Jeong, Hussain, Schoppa and Kim1997). Figures 14 and 15 exhibit the modifications of these structures in the upper and lower parts of the channel, respectively, for two particle-laden cases of
 $St^{+}=5.3$
and 21.2. When gravitational settling occurs in the upper part of the channel, more small-scale vortical structures are generated at the log layer and even in the vicinity of the geometric channel centreline (at
 $y/\unicode[STIX]{x1D6FF}\approx 1$
) (figure 14
a,c), as low-speed streaks are lifted farther in the direction of gravity (figure 14
b,d), particularly, for the largest Stokes number case. On the other hand, when particles settle in the lower part of the channel, the opposite is true; lifted low-speed streaks and near-wall vortical structures are damped compared to the particle-free case (figure 15). This trend is much stronger, again, for the largest Stokes number case (figure 15
c,d). The modification behaviour of coherent turbulent structures shown here is consistent with that of the turbulence statistics shown in figures 7 and 8.
5 Comparison of results with and without the gravitational settling
By assuming the absence of wall-normal gravity, several previous investigators have shown that strong accumulation of heavy particles is evident in the region of coherent ejections (Rouson & Eaton Reference Rouson and Eaton2001; Marchioli & Soldati Reference Marchioli and Soldati2002; Marchioli et al. Reference Marchioli, Giusti, Salvetti and Soldati2003; Narayanan et al. Reference Narayanan, Lakehal, Botto and Soldati2003). However, our results in the previous section indicated that this may not be always true at least under the experimental conditions of Gerashchenko et al. (Reference Gerashchenko, Sharp, Neuscamman and Warhaft2008). For a more detailed investigation of this difference, in this section, we compare the results obtained with and without considering gravitational settling.
Again, the two Stokes numbers,
 $St^{+}=5.3$
and 21.2, were considered in this section, as in § 4.2, but without the effect of gravity. For these non-sedimenting cases, a particle mass fraction of 20 % was used, at which previous two-way coupled DNS studies showed a significant two-way coupling effect for non-sedimenting particles (Li et al.
Reference Li, McLaughlin, Kontomaris and Portela2001; Nasr et al.
Reference Nasr, Ahmadi and McLaughlin2009). Note that this mass fraction is four times larger than that for the cases of settling particles (cases D–H). Despite this difference, the degree of turbulence attenuation is similar or becomes greater when the gravitational settling occurs, as will be shown below. This may indicate that heavy particles damp near-wall turbulence more efficiently during their settling through it. As the initial conditions, the particles were uniformly released over the channel and their velocities were given by the interpolated fluid velocities. Time averaging for fluid velocity statistics started when 250 wall time units passed from the initial uniform distribution, which were at least 10 times larger than the particle response time scales considered, and continued for 2000 wall time units. For the treatment of the particle–wall interaction without wall-normal gravity, instead of retaining the procedure discussed in § 2.3, which is relevant only to the cases of settling particles, we decided to follow the method by Nasr et al. (Reference Nasr, Ahmadi and McLaughlin2009), who also performed the two-way coupled DNS of the turbulent channel flow for similar Stokes numbers (
 $St^{+}=14$
and 20) at the same mass fraction (
 $\unicode[STIX]{x1D719}_{m}=0.2$
) assuming zero gravity. Therefore, once a particle touched the wall, it was no longer considered, and instead, a new particle was injected at a random location. In addition, in this study, since the initial velocity for the new particle was given artificially (i.e. as the interpolated fluid velocity), we chose to wait for two particle response times so that this particle would adapt to the local surrounding flow after injection, and then began to include its feedback force in the simulation. The detailed parameters for the
 $St^{+}=5.3$
and 21.2 cases without the effect of gravity are listed as cases I and J, respectively, in table 1.
Instantaneous distributions of particles near the channel bottom in zero gravity in the
 $x^{+}$
–
 $z^{+}$
plane for (a)
 $St^{+}=5.3$
(case I) and (b)
 $St^{+}=21.2$
(case J). Black dots denote the particle locations at
 $1<y^{+}<5$
and colour contours indicate
 $u_{1}^{+}$
at
 $y^{+}=10.52$
. For visual clarity, in (a,b) only every sixteenth particle and second particle are shown, respectively.

Instantaneous distributions of particles near the channel bottom under gravity in the
 $x^{+}$
–
 $z^{+}$
plane: (a)
 $St^{+}=0.81$
(case D), (b)
 $St^{+}=2.65$
(case E), (c)
 $St^{+}=5.3$
(case F), (d)
 $St^{+}=10.6$
(case G) and (e)
 $St^{+}=21.2$
(case H). Black dots denote the particle locations at
 $1<y^{+}<5$
and colour contours indicate
 $u_{1}^{+}$
at
 $y^{+}=10.52$
. For visual clarity, in (a,b) only every sixteenth particle and third particle are shown, respectively.

Mean streamwise fluid velocities near the lower wall in a semi-log plot for the particle-free case and cases F,H,I and J.

Root-mean-square (a) streamwise, (b) wall-normal and (c) spanwise fluid velocity fluctuations, and (d) Reynolds shear stresses near the lower wall for the particle-free case and cases F, H, I and J.

Figures 16 and 17 show the instantaneous distributions of particles in the vicinity of the lower wall
 $1<y^{+}<5$
along with the streamwise fluid velocity fields at
 $y^{+}\approx 10$
in the
 $x^{+}$
–
 $z^{+}$
plane for the cases without and with the effect of wall-normal gravity, respectively. For visual clarity, the particles located at
 $y^{+}<1$
were excluded from the figures. In figure 16, strong particle localization occurs along low-speed streaks for our non-sedimenting cases, in particular for
 $St^{+}=21.2$
, as a result of turbophoretic drift, consistent with the previous observation (Marchioli & Soldati Reference Marchioli and Soldati2002; Marchioli et al.
Reference Marchioli, Giusti, Salvetti and Soldati2003; Sardina et al.
Reference Sardina, Schlatter, Brandt, Picano and Casciola2012; Zhao et al.
Reference Zhao, Andersson and Gillissen2013). The phenomenon is also the case for near-neutral-density particles in horizontal turbulent channel flows (their settling rate will not be as large as that for our cases) (Rashidi, Hetsroni & Banerjee Reference Rashidi, Hetsroni and Banerjee1990; Pedinotti, Mariotti & Banerjee Reference Pedinotti, Mariotti and Banerjee1992; Pan & Banerjee Reference Pan and Banerjee1996; Kaftori, Hetsroni & Banerjee Reference Kaftori, Hetsroni and Banerjee1998). This turbophoresis effect becomes pronounced at
 $St^{+}\approx 5$
–50 for heavy particles (Rouson & Eaton Reference Rouson and Eaton2001; Sardina et al.
Reference Sardina, Schlatter, Brandt, Picano and Casciola2012; Lee & Lee Reference Lee and Lee2015) and at
 $St^{+}\approx 3$
for near-neutral-density particles (Pedinotti et al.
Reference Pedinotti, Mariotti and Banerjee1992). However, the strong accumulation rarely occurs for particles settling at the dimensionless gravitational acceleration
 $g^{+}=0.077$
, as shown in figure 17. In figure 17(a), particles with
 $St^{+}=0.81$
are distributed almost uniformly due to their very low inertia. In this case, the resulting terminal fall velocity is also very small, i.e.
 $\unicode[STIX]{x1D70F}_{p}g\approx 0.06u_{\unicode[STIX]{x1D70F}}$
. On the other hand, a combined effect of preferential concentration (due to particle inertia) and gravitational settling at
 $g^{+}=0.077$
results in the effect of preferential sweeping (see figure 11), as in homogeneous isotropic turbulence (Wang & Maxey Reference Wang and Maxey1993; Wang, Ayala & Grabowski Reference Wang, Ayala and Grabowski2007). An interesting observation in figure 17(b–d) is that clusters of settling particles are found in the high-speed regions during the process of preferential sweeping for
 $St^{+}=2.65$
, 5.3 and 10.6. Since the effect of particle inertia on preferential concentration is maximized for
 $St_{K}\approx 1$
(Wang & Maxey Reference Wang and Maxey1993), this clustering effect is most pronounced for
 $St^{+}=5.3$
(
 $St_{K}\approx 1$
in the buffer layer). This feature should gradually disappear with further increase in the Stokes number (
 $St^{+}>5$
or
 $St_{K}>1$
in the buffer layer), since particle clustering is affected by length scales larger than those of near-wall streamwise vortices for a larger particle response time scale compared to the main vortex time scale in the buffer layer (see Richter & Sullivan Reference Richter and Sullivan2013). Furthermore, a large terminal fall velocity is responsible for the effect of crossing trajectories (Yudine Reference Yudine1959; Elghobashi & Truesdell Reference Elghobashi and Truesdell1992). Eventually, as shown in figure 17(e), no distinct clustering pattern is observed for particles with
 $St^{+}=21.2$
since not only are they less affected by the action of streamwise vortices, but also their spanwise dispersion is significantly reduced at the large terminal fall velocity
 $\unicode[STIX]{x1D70F}_{p}g\approx 1.6u_{\unicode[STIX]{x1D70F}}$
(figure 12), indicating a dominant role played by gravity. This is partly due to the particles that rebound from the wall, because they can reach a distance of
 $y^{+}\approx 10$
from the wall during the collision process, as shown in figure 1(e). Fundamentally, the effect of gravity prevents preferential migration of particles with
 $St_{K}\gtrapprox 1$
to regions of coherent ejections, and consequently they deposit on the wall without strong accumulation in low-speed streaks.
Figure 18 shows the modifications of the mean streamwise fluid velocity
 $\langle u_{1}^{+}\rangle$
near the lower wall by particles with
 $St^{+}=5.3$
and 21.2 in the presence and absence of gravity. For the zero gravity case, a significant enhancement of the mean fluid velocity is observed at
 $y^{+}>20$
by particles with
 $St^{+}=21.2$
, while it is little affected by particles with
 $St^{+}=5.3$
. This increase in the mean fluid velocity only for
 $y^{+}>20$
is consistent with the previous results for non-sedimenting particles at similar Stokes numbers (Dritselis & Vlachos Reference Dritselis and Vlachos2008; Zhao et al.
Reference Zhao, Andersson and Gillissen2010, Reference Zhao, Andersson and Gillissen2013). However, when gravitational settling occurs, the high streamwise momentum of the outer layer is carried toward the wall more efficiently. Note that in the region
 $5<y^{+}<20$
, this effect is more pronounced for
 $St^{+}=5.3$
rather than for
 $St^{+}=21.2$
, due to the preferential sweeping effect in the buffer layer.
Figure 19 shows the changes in the r.m.s. fluid velocity fluctuations
 $\langle (u_{i}^{\prime +})^{2}\rangle ^{1/2}$
and the Reynolds shear stresses
 $\langle u_{1}^{+}u_{2}^{+}\rangle$
for
 $St^{+}=5.3$
and 21.2 in the presence and absence of gravity. In the figure, the modification behaviour due to non-sedimenting particles is generally consistent with the previous results (Li et al.
Reference Li, McLaughlin, Kontomaris and Portela2001; Dritselis & Vlachos Reference Dritselis and Vlachos2008, Reference Dritselis and Vlachos2011; Zhao et al.
Reference Zhao, Andersson and Gillissen2010, Reference Zhao, Andersson and Gillissen2013). In both cases with and without gravity, the wall-normal and spanwise r.m.s. fluid velocity fluctuations and the Reynolds shear stresses are suppressed, although the degree of turbulence modification is quite different (figure 19
b–d). This trend can be attributed to the fact that the near-wall vortical structures are damped in both cases (Richter & Sullivan Reference Richter and Sullivan2014; Lee & Lee Reference Lee and Lee2015). On the other hand, the turbulence is enhanced in the streamwise direction by particles with
 $St^{+}=21.2$
in the absence of gravity (figure 19
a). A physical explanation for this modification behaviour was provided by Richter (Reference Richter2015): the strength of low-speed (upwelling) streaks is increased because their low momentum is carried from the near-wall region by the particles accumulated in them, thereby increasing the streamwise r.m.s. fluid velocity fluctuations. As a result, low-speed streaks become longer in the streamwise direction and less tortuous in the spanwise direction while small scales associated with the streamwise velocity are attenuated (Li et al.
Reference Li, McLaughlin, Kontomaris and Portela2001; Zhao et al.
Reference Zhao, Andersson and Gillissen2010; Richter & Sullivan Reference Richter and Sullivan2013; Richter Reference Richter2015). However, heavy particles do not exhibit such strong accumulation in low-speed streaks during their settling at
 $g^{+}=0.077$
, as shown in figure 17, indicating that the turbulence enhancement in the streamwise direction is no longer seen during the gravitational settling (figures 7
a and 19
a).
6 Conclusions
The effect of wall-normal gravity on particle-laden near-wall turbulence was investigated through two-way coupled DNS of turbulent channel flow with Lagrangian tracking of small, heavy spheres for the Stokes number range
 $1\lessapprox St^{+}\lessapprox 20$
at
 $g^{+}=0.077$
. Motivated by the experimental study of Gerashchenko et al. (Reference Gerashchenko, Sharp, Neuscamman and Warhaft2008), our interest was in direct interactions between particles and coherent turbulent structures during transport of particles through near-wall turbulence due to a combination of the drag force and gravity.
We found that near-wall turbulence is modified differently depending on the sign of the mean shear rate that settling particles experience. We investigated this in detail by considering two different cases,
 $St^{+}=5.3$
and
 $St^{+}=21.2$
, which represent a small Stokes number of
 $St_{K}\approx 1$
and a large Stokes number of
 $St_{K}>1$
, respectively.
When
 $St^{+}=5.3$
, the so-called preferential sweeping effect appears along with preferential concentration due to coherent streamwise vortices. However, unlike preferential sweeping in one side of randomly oriented local vortical structures in homogeneous isotropic turbulence, in near-wall turbulence, preferential sweeping occurs in association with coherent ejections and sweeps generated by streamwise vortices in the upper and lower parts of the channel, respectively. Through preferential sweeping in ejections, low streamwise momentum is more effectively transported from the inner layer to the outer layer. As a result, more small-scale vortical structures are produced in the outer layer in the upper part of the channel. On the other hand, in the process of preferential sweeping in sweeps, clusters of settling particles are found in the high-speed (downward) fluid regions near the lower wall. The clustered particles acquire enough vertical momentum to reach the lower wall without being affected by the ejection motion. During this fast settling across the mean shear, they are strongly decelerated in the streamwise direction. This may be a more detailed physical explanation for why the droplets in the experiment of Gerashchenko et al. (Reference Gerashchenko, Sharp, Neuscamman and Warhaft2008) experience such a strong mean deceleration in the streamwise direction.
Particles with
 $St^{+}=21.2$
settle with very little spanwise motion, indicating the significance of the effect of crossing trajectories. In this case, more small-scale vortical structures are generated along the large-scale vertical flows of near-wall fluid from the upper wall, which are created by the rapidly settling particles, in the upper part of the channel. Near the lower wall, the particles simply cross regions of lifted low-speed streaks as well as streamwise vortices, thereby suppressing turbulence production significantly.
In either case, the settling particles deposit on the wall without their strong accumulation in low-speed streaks, differently than non-sedimenting particles, indicating the significance of considering the effect of wall-normal gravity. This also indicates that they are no longer able to increase the strength of the low-speed streaks, and hence no enhancement of the r.m.s. streamwise fluid velocity fluctuations is observed in the presence of wall-normal gravity, in contrast with the case of non-sedimenting particles. A parametric study for several different values of
 $g^{+}$
is needed for a comprehensive understanding of the roles of particle inertia and gravity.
Although the effect of large-scale or very-large-scale motions should be considered for high Reynolds numbers (Bernardini, Pirozzoli & Orlandi Reference Bernardini, Pirozzoli and Orlandi2013), we believe that our findings are still valid when
 $Re_{\unicode[STIX]{x1D70F}}>180$
because the coherent turbulence structures that we have focused on, such as the near-wall streamwise vortices and lifted low-speed streaks, are the general attributes of wall-bounded turbulence.
Acknowledgement
This research was supported by Samsung Science & Technology Foundation (no. SSTF-BA1702-03).



