Introduction
The present breeding scheme for sheep in Norway was mainly established during the course of the 1960s (Gjedrem, Reference Gjedrem1969) and was made operative through the breeding plan from 1968 (Haugen et al., 1968). Key elements were selection of ram lambs on pedigree and own performance, selection of rams on progeny test results in ram circles and selection of ewes according to a selection index (Gjedrem, Reference Gjedrem1969; Eikje, Reference Eikje1977; Steine, Reference Steine1982a; Vangen et al., 2003). Early calculations clearly indicated a positive genetic change from selection (Eikje, Reference Eikje1975a; Eikje and Steine, Reference Eikje and Steine1976), although the gain for some traits was not significantly different from zero. These studies also suggested a genetic loss for fleece weight. Later, other authors have also found positive genetic change, also for fleece weight (Steine, Reference Steine1982b, Reference Steine1986; Olesen and Steine, Reference Olesen and Steine1988; Olesen et al., Reference Olesen, Svendsen, Klemetsdal and Steine1995).
Since the early 1990s, the breeding programme has undergone some changes, primarily that some of the breeds were merged into one breeding group (Norwegian White Sheep), that progeny data from randomly sampled slaughter groups were replaced by carcass data transmitted directly from the abattoirs to a central databank and that a multivariate best linear unbiased prediction (BLUP) procedure replaced the selection index procedure for calculation of breeding values (Olesen et al., Reference Olesen, Svendsen, Klemetsdal and Steine1995). In addition to an index including all characters, sub-indices for the various traits in the aggregate genotype have been presented.
Later, index calculation groups have been enlarged by joining data from several counties. Furthermore, ultrasound measurements of muscle depth and fat cover have been examined under Norwegian conditions (Olesen and Husabø, Reference Olesen and Husabø1994; Larsgard and Kolstad, Reference Larsgard and Kolstad2003) and to some degree have been used for selection of ram lambs and in ewe replacement. Lately, the use of artificial insemination (AI) has become more frequent, with about 5300 ewes inseminated in 1991 (Landsrådet for saueavl, 1992), increasing to about 38 000 ewes in 2001 (Colbjørnsen, Reference Colbjørnsen2002). Also the flock structure has changed, becoming fewer and larger. Regarding management practice, and with possible consequence for breeding, more emphasis has been placed on finishing small lambs for slaughter in the autumn. Supplemental feeding of young lambs in the spring, especially triplets, with concentrates is no longer uncommon.
No estimates of expected genetic change before the present breeding programme with the changes mentioned are available.
In the present paper, the realised effect, both genetic and phenotypic, is examined for the largest breeding population, the Norwegian White Sheep.
The effect of the present programme is of interest both when investigating economic return and in connection with further development, for instance, more use of AI.
However, first of all, a description of the Norwegian sheep breeding scheme will be provided.
The Norwegian sheep breeding scheme
The Norwegian sheep population in June 2001 was recorded as about 980 000 adult ewes, distributed in about 21 000 flocks, spread over most of the country (Statistisk sentralbyrå, 2003). In Norway, sheep farm operations are based on the extensive use of forest and mountain pastures in summer, although grazing on cultivated pasture over the whole season is becoming more common in some areas (Statens landbruksforvaltning, 2000; Statistisk sentralbyrå, 2001).
About 30% of the national sheep population participates in the National Sheep Recording Service. This percentage has remained fairly stable since the late 1980s and currently involves 22.5% of flocks (Fagsenteret for kjøtt, 2002) and 18 registered breeds. Since 1991, the most numerous breeds, the Dala, Rygja and Steigar (www.ansi.okstate.edu/breeds/sheep), have been regarded as belonging to one breeding group, the Norwegian White Sheep.
Of the ewes recorded as Norwegian White Sheep in 2002 (1994), 120 900 (106 100) ewes were in the flocks of the ram circles that also progeny tested ram lambs, i.e. in the breeding population. These were distributed in 1512 (1895) flocks in 91 (95) ram circles. Additionally, in 2002, 182 flocks progeny tested ram lambs by the use of AI only. The average size of the breeding flocks was 71 ewes. For breeds other than Norwegian White Sheep, where breeding values were calculated in 2002, the Spælsau, Cheviot and Norwegian Fur Sheep had 23 300, 2700 and 1500 ewes in their breeding populations, respectively.
To improve carcass quality, Texel has, to a certain extent, been crossed into Norwegian White Sheep and its breeds over a period of 30 to 40 years (Eikje, 1976; Maurtvedt, Reference Maurtvedt1994). Lately, with renewed interest, Texel has also been used to establish a specialised sire line (Kvame, 2005). To improve fertility of Norwegian White Sheep, crossing with Finnish Landrace was introduced in the 1970s (Våbenø et al., Reference Våbenø, Bekken, Eri and Gjedrem1974; Steine et al., Reference Steine, Våbenø, Bekken and Eikje1978; Ådnøy, Reference Ådnøy1988). Furthermore, in the 1990s, in an attempt to increase the milking capacity of ewes, there was some crossing with East Friesian Dairy Sheep (Larsgard and Standal, Reference Larsgard and Standal1999). In Spælsau, some crossing with Icelandic sheep has been carried out to improve carcass quality (Eikje, 1979; Røyseland, Reference Røyseland2005).
The Norwegian sheep breeding scheme is organised by the Norwegian Sheep Breeding Council (NSBC), which is part of the Norwegian Sheep and Goat Breeders Association. The same rules, given by NSBC, apply for all flocks and regions in the breeding population. The expectation is therefore that genetic gain is similar for all regions. However, if there is a variation between regions as to the practice of the programme, a difference between regions with respect to gain may appear.
For all breeds, each flock in the breeding population should evaluate ram lambs according to pedigree, weaning weight (adjusted for non-genetic factors), wool scores (quality and weight) and conformation scores. To be approved, the ram lambs have to satisfy minimum requirements for both trait scores and total score (Landsrådet for saueavl, 2003). The ram lamb approval takes place in September and October, when the ram lambs are about 5 months of age. The selected ram lambs (test rams) in a ram circle are progeny tested in the same circle as they were born. Other approved ram lambs can be sold to flocks outside the ram circles.
In the ram circle, the test rams are moved to a new flock in the ram circle almost every day during the mating season, mating all the ewes being in heat (except ewes to be mated to proven rams). By use of ram circles, the constraint of small flock size, with respect to selection differential and accuracy of selection, is efficiently cancelled, i.e. test rams are selected from a larger number of approved ram lambs, and a fairly high number of test rams can be tested with adequately large progeny groups each. To become a ram circle, it should have at least 600 ewes and progeny test at least 12 test rams per year. For Norwegian White Sheep, the average number of ewes per circle in 2002 (1994) was 1225 (1117), and altogether 1992 (1965) test rams were progeny tested, including 42 test rams progeny tested by the use of AI.
To have their predicted breeding values published, the test rams are required to have at least 30 and 15 progeny with records for weaning weight and carcass data, respectively. Predicted breeding values are calculated by the beginning of November. Based on the so-called O-index, where the predicted breeding values for all traits in the aggregated genotype (to be described later) are weighted by their corresponding economic values, the highest-ranked progeny tested rams should be selected as elite rams. Correspondingly, the top-ranked ewes within each flock in a circle are classified as elite ewes, at present 35%. Elite rams are used within the ram circles to serve the elite ewes, where the main purpose is to produce ram lambs for the next generation. The mating season usually starts between the beginning of November and the beginning of December and lasts for a month or so. To reduce genetic differences between circles and improve the prediction of breeding values through more genetic ties, the elite rams should not be used in a ram circle for more than 1 year before being shifted to another circle. The rams in a circle are owned by the ram circle co-operative.
For farmers who are not members of any ram circle but members of the recording scheme, co-operation is also possible through the so-called ram-keeping groups. These groups use progeny-tested rams 1.5 years of age or older. These rams have been tested in ram circles in their 1st year and may, if certain criteria are met, have their indices recalculated on the basis of data from the ram-keeping groups. Rams that once have been elite, and which have indices above average, and which are not requested in ram circles or ram-keeping groups, can be sold to other flocks.
Progeny testing of young test rams through AI with fresh semen has been carried out since 1998 in Rogaland (Landsrådet for saueavl, 1999), induced because ram circles were closed down or split up in this county (Landbruksdepartementet, 1995a and 1995b), due to outbreaks of scrapie and mædi visna (Hopp and Jarp, Reference Hopp and Jarp1998; Knutsen et al., Reference Knutsen, Krogsrud, Mork and Jarp2000; Hopp et al., Reference Hopp, Ulvund and Jarp2001). Later, also Hordaland has progeny tested ram lambs through AI, due to restrictions on breeding work also in this county.
To reduce the risk of spreading of disease, movement of live sheep over any county boarder is no longer allowed (Mattilsynet, 2002). However, exeptions from the regulations are given, for example, when moving rams to AI stations.
From the two smaller AI stations situated in Rogaland and Hordaland, with a capacity of, respectively, 100 and 35 rams in 2005, fresh semen is distributed. Additionally, in year 2000 an AI station with a capacity of 400 rams, also producing frozen semen, was made operative in Hedmark.
The efforts with AI led to intensified research to increase the non-return rate (Paulenz et al., Reference Paulenz, Soderquist, Perez-Pe and Berg2001, Reference Paulenz, Ådnøy, Fossen, Soderquist and Andersen Berg2002 and Reference Paulenz, Soderquist, Ådnøy, Fossen and Andersen Berg2003). One decisive factor has been the establishment of a simple vaginal insemination technique known as ‘shot in the dark’, making it easier for the farmer to inseminate his own ewes.
Genetic change
Assumptions
Genetic change was calculated using the breeding values predicted in autumn 2002. The animals’ breeding values for traits recorded in autumn, i.e. weaning weight including its maternal component, carcass weight, carcass and fat grade and fleece weight of lambs (only recorded on ram lambs to become test rams), were predicted by a multi-trait BLUP reduced animal model as described and used by Olesen et al. (Reference Olesen, Svendsen, Klemetsdal and Steine1995). All traits were adjusted for fixed effects of flock–year, birth–rearing type–sex combination, age of dam and age of lamb at weaning, for the latter as a regression. For the birth–rearing type–sex combination, weaning weight had also been pre-adjusted multiplicatively to account for heterogeneous variance.
For fleece weight, age of lamb at weaning was replaced by a regression on age at shearing. For carcass weight and carcass and fat grade, number of days from weaning to slaughter was also adjusted for, as a nested regression within flock, to possibly account for the practice of slaughtering at maturity. In the evaluation, pedigree information on animals born in 1988 and later was used.
Breeding values were originally predicted countywise, but from 2002 calculations for the traits recorded in autumn have been done in three groups: group 1 made up of counties on the south-west coast of Norway (Vest-Agder, Rogaland, Hordaland and Sogn og Fjordane); group 2, mainly inland counties (Østfold, Akershus, Oslo, Oppland, Buskerud, Vestfold, Telemark, Aust-Agder and Møre og Romsdal); and group 3, mainly the most northern counties (Hedmark, Sør-Trøndelag, Nord-Trøndelag, Nordland, Troms and Finnmark).
For traits recorded in the spring, i.e. for number of lambs born at 1, 2 and 3 years of age as well as for fleece weight of 1-year-old ewes (mandatory registration until 1994 (Landsrådet for saueavl, 1993), but with only 305 records in 2002), a four-trait BLUP animal model (Olesen et al., Reference Olesen, Svendsen, Klemetsdal and Steine1995), only correcting the traits for a fixed flock–year effect, was implemented over all counties, using the same pedigree information, from 1988 onwards. Number of lambs born is used as a measure of fertility, because it has a higher heritability than the number of lambs at weaning (Eikje, Reference Eikje1975b) and because the traits are highly correlated (Eikje, Reference Eikje1975b).
The genetic and environmental (co)variances used in the prediction of breeding values for traits recorded in the spring are the same as given by Olesen et al. (Reference Olesen, Svendsen, Klemetsdal and Steine1995), based on estimates by Eikje (Reference Eikje1975b) and Baker and Steine (Reference Baker and Steine1986). However, according to Morten Svendsen (personal communication), for traits recorded in autumn, i.e. for weaning weight and carcass weight and carcass grade and fat grade, the parameters were re-estimated in 1996, when the EUROP system (Johansen et al., Reference Johansen, Aastveit, Egelandsdal, Kvaal and Røe2006) was introduced to judge carcasses. The same data as used by Svendsen et al. (Reference Svendsen, Olesen and Sangholt1996) were then analysed by Svendsen, after assigning carcass and grade scoring linearly to the EUROP scale, ensuring similar phenotypic variances as in a reference data set. The statistical model was that of Svendsen et al. (Reference Svendsen, Olesen and Sangholt1996) with the exception of the flock effect, which now was considered fixed. The genetic correlations between the analysed traits and fleece weight of lambs were adjusted for the updated estimates of the genetic covariances. The corresponding environmental correlations were restricted to zero, with the exception of that for weaning weight, as fleece weight was only recorded for test rams, with no carcass records. For the maternal component of weaning weight, the additive genetic correlation to weaning weight and the heritability were kept unchanged, while the additive genetic variance was updated from the new estimate of the phenotypic variance (σ p = 5.0 kg). The genetic parameters are given in the Appendix.
The relative economic values of Olesen et al. (Reference Olesen, Svendsen, Klemetsdal and Steine1995) were modified in the spring of 1995. In this regard, the NSBC decided the gain that would be desirable for the various characters in per cent of gain in the aggregate genotype (Landsrådet for saueavl, 1995). The modification was then done by adjusting the relative economic values of Olesen et al. (Reference Olesen, Svendsen, Klemetsdal and Steine1995) (recalculated to Norwegian kroner (NOK) in the Appendix), so that the product of the actual economic value and the genetic standard deviation (s.d.) (Appendix) of the respective trait resulted in the desired per cent, as per cent of the sum of the products of the genetic s.d. of each trait and the respective traits’ economic values. These new economic values were used in an adjusted index. Compared with the values of Olesen et al. (Reference Olesen, Svendsen, Klemetsdal and Steine1995), more weight was placed on carcass grade and on the maternal effect on weaning weight and less weight on carcass weight and on the number of lambs born. When the EUROP system was introduced in 1996, the economic values had to be adjusted once again (Appendix) so that they fitted with the decision made by NSBC.
Worth noting is the fact that the individual effect of weaning weight has an economic value of zero and is thus not included in the aggregate genotype. In fact, the trait is included in the evaluation to account for selection, i.e. slaughtered animals are not a random sample of all lambs.
Results
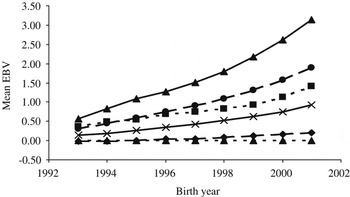
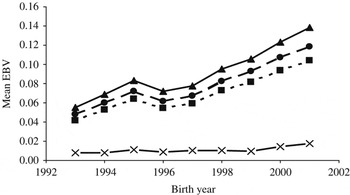
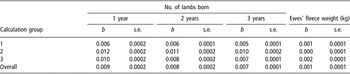
By averaging breeding values by birth year over calculation groups, genetic trend on the national level can be depicted as in Figures 1 and 2, while corresponding values, also per calculation group, are given in Tables 1 and 2. Table 3 gives the estimated annual change as a percentage of the phenotypic average, for all traits (also as a percentage of one genetic s.d. or as a percentage of the aggregated economic genotype).
Average of estimated breeding values (EBV) of Norwegian White Sheep for lamb traits, and maternal effect on weaning weight, by birth year.  weaning weight, kg
 carcass weight, kg
 maternal effect of weaning weight, kg
 carcass grade, 41 (P−), 55 (E+)
 fat grade, 1 (1−), 15 (5+)
 lambs’ fleece weight, kg.

Average of estimated breeding values (EBV) of Norwegian White Sheep for ewe traits by birth year.  no. of lambs born, 1 year
 no. of lambs born, 2 years
 no. of lambs born, 3 years
 ewes’ fleece weight, kg.

Annual genetic change of Norwegian White Sheep for the period 1993 to 2001, estimated as linear regression (b) and standard errors (s.e.) of regression of estimated breeding values on birth year, for lamb traits and maternal effect of weaning weight

Calculation groups are (1) counties on south west coast of Norway, (2) mainly inland counties and (3) mainly the most northern counties
†41 (P−), …, 55 (E+).
‡1 (1−), …, 15 (5+).
Annual genetic change of Norwegian White Sheep for the period 1993 to 2001, estimated as linear regression (b) and standard errors (s.e.) of regression of estimated breeding values on birth year, for ewe traits

Estimated annual genetic change in Tables 1 and 2 in percentage of uncorrected phenotypic averages over the years 1998 to 2002

Overall, also as (1) a percentage of one genetic standard deviation (s.d.), as given in the Appendix and (2) as a percentage of the summed economic genotype (10.87 Norwegian kroner).
†41 (P−), …, 55 (E+).
‡1 (1−), …, 15 (5+).
The figures and tables illustrate the same fact, that genetic trend for nearly all traits in the aggregated breeding goal have been positive. The only exceptions are the fleece weight of lambs, which does not show any change at all, and the upward trend for fat grade that actually has a negative economic value, as leaner animals are desirable (Appendix).
In percentage of the phenotypic average (Table 3), the largest genetic gain was obtained for carcass grade, carcass weight and weaning weight. Annual genetic change varied somewhat between calculation groups, with group 1 showing the poorest results for all traits, except for the fleece weight of ewes.
When comparing the genetic change of traits in percentage of one genetic s.d. (Table 3), the largest changes were again for weaning weight, carcass weight and carcass grade (each around 20% per year). For maternal effect on weaning weight and number of lambs born at a specific age, the corresponding percentages were around 6%.
The change in the aggregated (summed) economic genotype amounted to 10.87 NOK per year (Table 3). Of this, altogether 70% is from gain in carcass grade and carcass weight. About 32% is from gain in ewe traits, i.e. maternal effect on weaning weight, number of lambs born and ewe fleece weight. When the sum of these percentages exceeds 100, the reason is that the economic loss of about 2% from increased fatness is taken into account when calculating the genetic change of 10.87 NOK.
Comparison with previous Norwegian results
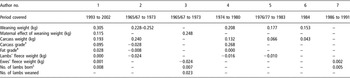
In Table 4, the current estimates of annual genetic change are compared with the previous Norwegian results.
Annual genetic change in the current study and in previous Norwegian studies

(1) Current study, (2) Eikje (Reference Eikje1975a), breeds: Dala, Rygja, Cheviot, Steigar, Spælsau, (3) Eikje and Steine (Reference Eikje and Steine1976), breeds: Dala, Rygja, Cheviot, Steigar, Spælsa, (4) Steine (Reference Steine1982b), breeds: Dala, Rygja, Cheviot, Steigar, Spælsau, (5) Steine (Reference Steine1986), breeds: Dala (average for nine counties), (6) Olesen and Steine (Reference Olesen and Steine1988), breeds: Dala, Rygja, Steigar, Spælsau, (7) Olesen et al. (Reference Olesen, Svendsen, Klemetsdal and Steine1995), breed: Norwegian White Sheep.
†Study 1 used the EUROP system (15 classes), while studies 2 and 4 used a carcass grading system from 1 to 10.
‡Study 1 used the EUROP system (15 classes), while studies 2 and 4 used the weight of kidney and kidney fat.
§In studies 1 and 7, the average for ewes 1 to 3 years of age is given.
For the individual effect of weaning and carcass weight, as well as the maternal effect of weaning weight, our estimates of genetic change, in size, correspond well with those obtained when starting the breeding programme. Results from the late 1970s and 1980s showed considerably lower values. However, our larger annual genetic change for weaning weight, than for carcass weight, contrasts with the results of Eikje (Reference Eikje1975a), who found similar values for genetic change of both traits, actually indicating an increase of the dressing percentage. One explanation for the results stated was a high heritability for carcass weight, and also the pattern of genetic correlation found between dressing percentage and carcass and weaning weight (0.62 and −0.18), respectively (Gjedrem, 1971). Another explanation mentioned was the impact of the crossing with Texel. In fact, Eikje (Reference Eikje1973) found that use of Texel rams in the ram circles did not affect the weaning weight, while the carcass weight of half-Texel lambs exceeded the average by about 0.5 kg.
For the maternal effect of weaning weight, our estimate was less than half the estimate of Eikje and Steine (Reference Eikje and Steine1976) but still one-third of the change of the individual effect in size.
As the scale of measurement has changed for carcass and fat grades over time, only direction of results in Table 4 can be compared. For carcass grade, a considerable change has recently been achieved, amounting to approximately 1.7% of the phenotypic average per year. For fat grade, our results indicate that the carcasses are becoming genetically fatter, also due to the minor weighting of this trait to the overall economic genotype (Appendix).
For the number of lambs born, most studies referred to in Table 4 estimated similar annual genetic changes, consistently for larger litters, increasing by about 0.1 lambs over a 10-year period.
Prior to introduction of the BLUP index, some estimates of genetic change were also calculated for the aggregate economic genotype, e.g. in the index produced for selection of 1.5-year-old test rams, including carcass weight, carcass quality and fleece weight of lambs. For this index, Eikje (Reference Eikje1975a) found the gain to be 1.25% per year (1.25 index units change for an average index of 100). To compare our results with previous ones, for the aforementioned index, genetic gain in the aggregate genotype was calculated as the sum of the products between the genetic gain in carcass weight, carcass grade, fat grade and fleece weight of lambs (Table 1) and their economic weights (Appendix). Correspondingly, an aggregate economic phenotype was calculated by multiplying the phenotypes of the same traits (Table 3) by the economic values. In per cent of the aggregate phenotype, the calculated genetic gain in the aggregate genotype turned out to be 1.25%, equal to that of Eikje (Reference Eikje1975a). These results were larger than the values of 1.02% and 0.52% from the late 1970s and early 1980s, obtained by Steine (Reference Steine1982a and Reference Steine1986). Steine (Reference Steine1986) discussed the fact that genetic gain in the aggregate genotype had been reduced prior to 1983. Following Steine, this was due to increased weighting of fleece weight, reducing the indices’ efficiency and thereby the realised genetic gain.
Discussion
The trend for all traits in Figure 1, except for wool, shows a somewhat curvilinear relationship with time, indicating an increase in genetic gain over the later years of the study. This might be explained by several collinear changes.
One explanation is the change of economic weights in 1995 (Appendix) taking effect through breeding values, and also the increasing effect in the progeny, from a steadily larger fraction of the progeny with parents selected from 1995 onwards. Another explanation is the change of the genetic parameters in 1996, taking effect as BLUP priors, with the largest effect in animals with least information, i.e. the youngest. The pattern of trend may indicate that the traits are less heritable than assumed, or that there exists covariances across generations other than genetic, e.g. between the phenotype of the ewe with the permanent environment of the lamb, as proposed in the literature (Eikje, Reference Eikje1975a; Steinheim et al., Reference Steinheim, Mysterud, Holand, Bakken and Ådnøy2002). This latter effect cannot be estimated by the current model. A third reason is the steadily more-frequent use of AI over time, increasing intensity and accuracy of ram selection.
Also, the reliability of the results is dependent on the genetic connectedness between animals in different flocks and years. In the Norwegian breeding scheme, breeding values have been predicted jointly for animals of different ages of Norwegian White Sheep. Selection of rams of various ages is based on these breeding values. This is done on the assumption of genetic connectedness between flocks and years. However, no studies on genetic connectedness have been performed so far.
The trend for lambs fleece weight was flat (Figure 1), a consequence of the close-to-zero genetic correlations to other traits recorded in the autumn (Appendix), and also the recording practice, only on test rams, implying strongly selected data, biasing the breeding values and thus the genetic trend downwards. Estimation of an improved trend would require fleece weight recorded for all rams considered as selection candidates. For ewe fleece weight (Figure 2), recording was scarce, and thus the estimated trend was mainly a correlated response to the number of lambs born (genetic correlation of 0.19 – see Appendix). Hence, given the current lack of information on fleece weight, the logic of placing economic weight on that trait is questionable.
For number of lambs born, a consistent improvement was estimated over time, except for a drop in 1996, and a linear increase thereafter. The drop in 1996 was most likely a consequence of the change of economic weights in 1995.
Generally, for all traits genetic gain was least in calculation group 1 (Vest-Agder, Rogaland, Hordaland and Sogn og Fjordane). One reason may be that Rogaland and Hordaland were the counties that were most heavily affected by the veterinary restrictions to the breeding scheme, e.g. implying smaller ram circles. However, the variation in genetic change may also be explained by the willingness of sheep farmers to carry out the breeding plan. Actually, on data from 1981, Steine (Reference Steine1986), looking at differences between districts in genetic change, found an estimate of zero for growth rate and carcass quality in Rogaland and Hordaland, while the corresponding estimates in other counties were 0.5% to 1.0% per year. Later, on a material from 1984 in Dala, the results were considerably more favourable for Hordaland (Steine, Reference Steine1986), while there was a genetic deterioration of 220 g for carcass weight in Rogaland.
Phenotypic change
Due to the aforementioned problems with fleece weight data, phenotypic trends were only calculated for the other traits, using the same data as before, i.e. weaning weight, carcass weight, carcass grade and fat grade (data available only from 1996 to 2002 for carcass and fat grade, otherwise from 1993 to 2002) and number of lambs born.
Breeding values for number of lambs born are predicted to improve number of lambs at weaning, through correlated response. Therefore, phenotypic change for number of lambs at weaning was also studied.
Trends were estimated as least-squares mean of year solutions from the univariate analysis of each trait with Proc GLM of Statistical Analysis Systems Institute (SAS, 1999), using models that resembled the BLUP models. For all traits, the fixed effect of year, fixed effect of flock and fixed effect of age of dam (nine classes) were taken into account. For weaning and carcass traits, fixed effect of birth type (five classes; number of lambs at birth per ewe) and a regression on age of lamb at weaning and at slaughter, respectively, was included.
The importance of correcting for the two latter effects is given in Table 5, with lambs at weaning being on average 4.5 days younger in 2002 than in 1993, while age at slaughter has increased by about 2.3 days over the same period. Notice also the increased variation in age at weaning and age at slaughter over time, resulting from the steadily more-frequent practice of slaughtering at maturity, within farm. During the 7 years considered, the average age of dam was fairly the same while litter size at birth (birth-type) increased by 0.17 lambs from 1993 to 2002. The proportion of 1-year-old ewes lambing was 22.15% of all ewes lambing in 1996 and 21.47% in 2002.
Average value ( ) and standard deviation (σ) for age of dam, number of lambs at birth per ewe and age of lamb at, respectively, weaning and slaughter, over time

†Omitted because of missing data in sheep recording for dams born before 1988.
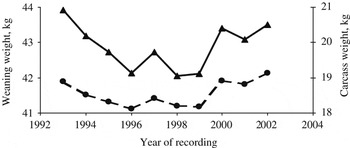
In Figure 3 is shown the least-squares means of weaning weight, dropping over the period 1993 to 1996. Thereafter, the change flattens out more before a positive development in the weights is seen from 1999 onwards. The simple linear regression of least-squares means on year was −0.011 kg. For the years 1996 to 2002, the coefficient was 0.220 kg, corresponding to a 0.51% progress per year.
Phenotypic change as least-square means of, respectively, weaning- and carcass weight by year of recording in Norwegian White Sheep.  weaning weight, kg
 carcass weight, kg.

As for weaning weight, the lowest carcass weights were obtained during 1996 to 1999 (Figure 3). The regression of least-squares means for the entire period was positive, 0.044, while the estimate for the period 1996 to 2002 was 0.164, a change of 0.84% per year.
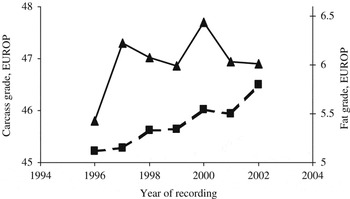
Figure 4 shows that the carcass grade improved approximately linearly over the period studied. The regression coefficient of carcass grade on year was calculated as 0.199, implying an annual phenotypic gain of 3.5%. For fat grade, the phenotypic development was towards fatter carcasses (Figure 4), with a regression coefficient of 0.061. However, notice that for fat grade (Figure 4), the pattern of least-squares mean corresponded very well with the pattern for weaning and carcass weights, in Figure 3, illustrating the well-known fact that heavier lambs also tend to be fatter. Thus, Olesen and Husabø (Reference Olesen and Husabø1994) obtained estimates of phenotypic correlations between weaning and carcass weights and that of fat grade measured ultrasonically of 0.40 and 0.49, respectively.
Phenotypic change as least-square means of, respectively, carcass- and fat grade by year of recording in Norwegian White Sheep.  carcass grade, 41 (P−), 55 (E+)
 fat grade, 1 (1−), …, 5 (5+).

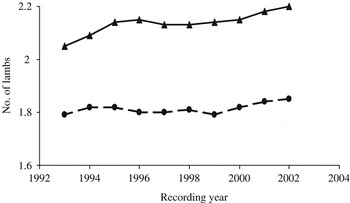
When looking at the entire period from 1993 to 2002 (Figure 5), numbers of lambs per ewe, at both birth and weaning, have steadily increased. Linear regression of least-squares means of number of lambs at birth on year was calculated as 0.0121, corresponding with a phenotypic change of 0.56% per year. For number of lambs at weaning the corresponding figure was 0.0040, i.e. a phenotypic change of 0.22% per year. The larger number of lambs at birth than at weaning might be due to higher death rates of lambs with increasing litter size at birth (Fimland et al., Reference Fimland, Eri, Liland and Gjedrem1969; Gjerde, 1979). Another cause might be increased lamb losses over years due to predators (Asheim and Mysterud, 1999). Also, indirect selection for numbers of lambs at weaning through direct selection on numbers of lambs at birth, resulting in the largest gain for the latter, might contribute to the same pattern.
Phenotypic change as least-square means of, respectively, number of lambs at birth and weaning by year of recording in Norwegian White Sheep.  no. of lambs born
 no. of lambs at weaning.

Although the number of lambs born per ewe increased slightly from 1995 to 1996, the number of lambs weaned decreased somewhat, implying a higher lamb loss from birth to weaning in 1996. This might be explained by the possibly poorer environmental conditions that existed in 1996, with relatively light lambs that were less fat (Figures 3 and 4). In 1997, the number of lambs born per ewe was relatively low, which might be due to ewes being in less good condition at mating in 1996. However, the number of lambs at weaning did not drop correspondingly, which at least partly might be explained by a higher rate of lamb survival for a reduced number of lambs at birth.
Genetic v. phenotypic change
It should be noted that the genetic change in weaning weight was the sum of the change in the individual effect (0.305 kg/year; Table 1) and the change in the maternal effect (0.115 kg/year; Table 1), which totals to 0.420 kg. This was nearly twice the phenotypic change, amounting to a maximum of 0.220 kg/year (years 1996–2002). Similarly, for carcass weight, the annual genetic change (0.193; Table 1) was larger than the largest estimate obtained for phenotypic change (0.164). Genetic change for maternal effect on carcass traits also has to be assumed, but cannot be calculated by the current model.
The phenotypic changes for carcass grade, fat grade and number of lambs born were larger than the genetic change. Carcass grade was phenotypically 2.09 times the genetic change, while corresponding numbers for fat grade and numbers of lambs born were 2.18 and 1.51, respectively.
These results indicate that the environmental conditions have not been good enough for the sheep to realise their improved genetic potential for growth. Environment, e.g. feed supply, may be fairly well controlled while the ewes and lambs are fed indoors, or on cultivated, top-dressed pastures, if necessary with supplement of concentrates. This may, in many cases, last until the lambs are 1 to 2 months of age, a period when the lambs are very much dependent on the dams’ milking ability. Thereafter, most sheep are moved to mountain and forest pastures, where the feed supply cannot be controlled, and will vary from year to year.
Using figures from the 200 ram circle-flocks that were reporting birth-, spring- and weaning-weight records in both 1996 and 2002, the daily growth rates in the 2 years were: from birth to spring weighing 0.293 to 0.326 kg, and from spring to weaning weighing 0.262 to 0.264 kg. Thus, growth rate in spring, in the more controlled environment, seems to have increased considerably, while the growth rate in summer, mostly on natural pastures, has not.
As the number of days from weaning weight recording to slaughter has increased from 13.7 to 20.4 days between 1993 and 2002 (Table 5), this points to the fact that finishing of small and immature lambs on aftermath, fodder rape and concentrates after weaning weight recording has become more common. Consequently, the estimated phenotypic change in carcass weight (0.164 kg) has been larger than the change (0.090 kg) that can be calculated from the estimated change in weaning weight (0.220 kg), assuming a dressing percentage of 41. The considerable phenotypic change in carcass grade compared with the genetic change also points to the more-frequent practice of finishing lambs for slaughter.
Number of lambs born can, to a certain extent, be controlled through feeding and ewe condition around mating, so that they can show their genetic potential.
However, any discrepancy between genetic and phenotypic change might also arise if the genetic trend is overestimated or underestimated. For example, an overestimation may occur if there is any carryover of environmental effects in the birth year of the ewe to later years. This may have an effect on the predicted breeding values. If there is, for example, a systematic improvement of environment in the lamb-rearing period from year to year, there will be a confounding between birth year and lamb-rearing environment. This can lead to an overestimation of genetic gain since the effect of environment and birth year may be difficult to disentangle.
Further, the predicted breeding values of the youngest animals are to a great extent based on information of relatives, and not so much on what the animals themselves have produced. Thus, they have not yet had the possibility to realise the potential of their breeding value. Accordingly, the apparent genetic change in the last years of the period considered might in that case be looked at more as expected rather than realised. A difference between realised genetic change (which results in phenotypic change) and expected genetic change might, for example, be due to less-efficient selection indices (predicted breeding values) if the models and genetic parameters do not fully represent the real situation.
Acknowlegdements
This research was financed by the Research Council of Norway and the Agricultural Marketing Board. The support is greatly appreciated. Thanks also to The Meat Research Center for making data for this study available, and to Dr Morten Svendsen for valuable discussions.
Appendix
Genetic and environmental parameters used for analysing the different traits of Norwegian White Sheep

Heritabilities in bold on diagonal, genetic correlations above diagonal, environmental correlations below diagonal, and genetic s.d. (σg) on the line beneath.
aNumber of lambs born, 1 year.
bNumber of lambs born, 2 years.
cNumber of lambs born, 3 years.
dEwes’ fleece weight.
eWeaning weight, individual.
fWeaning weight, maternal.
gCarcass weight.
hCarcass grade.
iFat grade.
jLambs’ fleece weight.
Weights on different traits in the aggregate breeding value of Norwegian White Sheep

†Relative economic values of Olesen et al. (Reference Olesen, Svendsen, Klemetsdal and Steine1995) recalculated to Norwegian kroner (Landsrådet for saueavl, 1995).
‡In per cent of the rate of gain in aggregate genotype (Landsrådet for saueavl, 1995).