Implications
Live S. cerevisiae supplemented from pig weaning may limit the effects of Escherichia coli F4ac (ETEC) infection due to the favorable influence on the jejunal transcriptome. A protective effect inducing a delay in the occurrence of diarrhea was observed after the yeast supplementation at the moment of ETEC infection. The yeast upregulated several gene sets related to cell nuclear activity, cell multiplication and to lymphocyte differentiation and proliferation. The effects of yeast on the transcriptome pattern in the jejunal mucosa partially resemble the favorable effect obtained after antibiotic administration, strengthening its capacity in reducing the use of antibiotics as a preventive approach.
Introduction
Several yeast products (S. cerevisiae) are listed under the EC Regulation N. 1831/2003 as feed additives for pigs in EU. The beneficial properties for maintaining proper gut microbiota have been demonstrated, primarily for Saccharomyces boulardii (Justino et al., Reference Justino, Melo, Nogueira, Costa, Silva, Santos, Mendes, Costa, Franco, Lima, Ribeiro, Souza and Soares2014). On the other hand, colibacillosis is the most relevant bacterial infection in the pre-and post-weaning phase of pig production and ETEC is one of the most diffuse causative agents. To overcome this problem without the use of antibiotics, there is a need for alternatives. Positive effects of the yeast strains in promptly counteracting the diarrhea have been obtained in animal models and human (McFarland, Reference McFarland2010), whereas there are studies showing effects of yeasts on intestinal barrier, absorption and E. coli binding in pig (Daudelin et al., Reference Daudelin, Lessard, Beaudoin, Nadeau, Bissonnette, Boutin, Brousseau, Lauzon and Fairbrother2011). Nevertheless, an in-depth understanding of the early response of the small intestine after the administration of Saccharomyces spp. in combination with enteropathogens is of practical interest to refine the feeding strategies based on yeast in order to promote pig gut health.
A larger study was designed to test the dietary supplementation of S. cerevisiae CNCM I-4407 (Sc) at different times and doses for counteracting the infection from ETEC in weaned piglets (Trevisi et al. Reference Trevisi, Colombo, Priori, Fontanesi, Galimberti, Calò, Motta, Latorre, Fanelli, Mezzullo, Pagotto, Gherpelli, D’Inca and Bosi2015a). Our previous results indicated the ability of live yeast to reduce the mortality of piglets, whereas maintaining growth performance, within two weeks post-infection. Probiotic Sc administration may modulate host mucosal reactions directly through receptor-mediated signaling (Sougioultzis et al., Reference Sougioultzis, Simeonidis, Bhaskar, Chen, Anton, Keates, Pothoulakis and Kelly2006) or indirectly through effects on the intestinal microbiota (Brousseau, et al., Reference Brousseau, Talbot, Beaudoin, Lauzon, Roy and Lessard2015). We hypothesized that such modulatory effects will also change the host response against ETEC infection, but this may depend on the time point of Sc administration. The aim of this study was to elucidate the biological basis of the ability of supplemented yeasts to maintain the homeostasis of porcine intestinal mucosa 24 h after ETEC infection, in comparison with the efficacy of an antibiotic effective against ETEC.
Material and methods
Animals, housing and diets
The procedures complied with the Italian laws pertaining to experimental animals and were approved by the Ethic-Scientific Committee for Experiments on Animals of the University of Bologna.
In total, 20 Large White piglets (eight females, 12 males) were selected from a farm where ETEC infection has been frequently evidenced and on the basis of the polymorphism for the Mucin4 gene (Jensen et al., Reference Jensen, Frydendahl, Svendsen, Jørgensen, Cirera, Fredholm, Nielsen and Møller2006), to obtain ETEC-susceptible pigs.
At 24 days of age (day 0), the pigs were weaned, divided into four groups, balanced for sex, litter and BW and assigned to one of four diets: control (CO, typical weaning diet); CO+1 g colistin/kg of feed (AB) from day 0; CO+5×10¹⁰ colony-forming unit (CFU) of Sc/kg of feed, from day 0 (PR, preventive dose); CO+5×10¹⁰ CFU of Sc/kg of feed from day 7 (CM, competitive dose). The dietary concentrations of Sc are based on CFU values detected at the moment of the start of the trial. The base diet – better detailed in Trevisi et al. (Reference Trevisi, Colombo, Priori, Fontanesi, Galimberti, Calò, Motta, Latorre, Fanelli, Mezzullo, Pagotto, Gherpelli, D’Inca and Bosi2015a) was based on wheat shorts, corn, barley, extruded barley, soybean meal 50, whey dehydrated and skimmed, potato, protein concentrate, vegetable oil, dehydrated beet pulp, calcium carbonate, monosodium phosphate hydrated, sodium chloride, vitamin and trace mineral mixture, and was integrated with 0.4% l-lysine HCl, 0.2% dl-methionine, 0.15% l-threonine, 0.07% l-tryptophan. The colistin (Sintofarm, Guastalla, Reggio Emilia, Italy) treatment was used as a positive control owing to its activity against the ETEC strain used for the challenge, following a procedure frequently used for this purpose in other trials involving an ETEC challenge (Trevisi et al., Reference Trevisi, Corrent, Mazzoni, Messori, Priori, Gherpelli, Simongiovanni and Bosi2015b). The pigs were individually penned in cages, kept at a controlled temperature (30°C at the beginning and 25°C at the end of the experiment, with a 1°C decrease every 3 days), heated additionally by IR lamps for the first 7 days, and had always free access to their assigned experimental diet feed and water, starting on day 0.
Escherichia coli F4ac challenge and sampling
On day 7 post-weaning, all the pigs were orally dosed with a 1.5 ml suspension containing 108 CFU of ETEC O149:F4ac/ml, prepared as described by Trevisi et al. (Reference Trevisi, Corrent, Mazzoni, Messori, Priori, Gherpelli, Simongiovanni and Bosi2015b). A lyophilized live yeast strain of Sc (CNCM I-4407, Actisaf; Phileo–Lesaffre Animal Care, Marcq-en-Baroeul, Nord-Pas-de-Calais-Picardie, France) was mixed in the diet.
The pigs were sacrificed 24 h after challenge (day 8). At slaughter, the animals were deeply anesthetized and sacrificed via an intracardiac injection of Tanax (0.5 ml/kg BW).
For each animal, on day 8, blood was sampled in 10 ml vacutainers tubes containing ethylenediaminetetraacetic acid as an anticoagulant. Immediately after collection, the blood was centrifuged at 3000 r.p.m. for 10 min at 4°C; the serum was removed and stored at −80°C. At sacrifice, three samples from the jejunum at 75% of the small intestine length were collected after three washings with buffer saline solution and first, formalin fixed for microscopic analysis; second, snap frozen in liquid nitrogen and preserved at −80°C for transcriptome analyses; third, washed with a storing buffer solution (Van den Broeck et al., Reference Van den Broeck, Cox and Goddeeris1999), gently scraped to isolate the villi and stored in the same buffer solution at −80°C until in vitro adhesion test.
In Vitro Villus Adhesion Assay, morphometric analyses
The susceptibility to ETEC was assessed using the procedure of Van den Broeck et al. (Reference Van den Broeck, Cox and Goddeeris1999). Briefly, the villi were examined by phase contrast microscopy after incubation with ETEC. The number of bacteria adhering along a 50 μm length of villous brush border was counted in 20 fields, and the pigs were considered positive when showing values ⩾6.
For morphometric analyses, the intestinal samples were pinned tautly to balsa wood and fixed in 10% buffered formalin (pH 7.4). After embedding in paraffin wax 4 µm thick sections were dewaxed in xylene and stained with hematoxylin–eosin. For each subject, the height of 20 villi and the depth of 20 crypts were measured. The sections were examined at low magnification with Zeiss Axioplan microscope (Carl Zeiss, Oberkochen, Germany), interfaced to a digital camera equipped with Cytometric software (Byk Gulden, Cormano, Milano, Italy).
Haptoglobin and C-reactive protein determination
In the blood serum, Haptoglobin (Hp) (mg/ml) and C-reactive protein (CRP) (µg/ml) were quantified using the Tridelta Phase Hp Assay and the Tridelta Phase Porcine CRP Assay Kit, (Tridelta Development Ltd, Maynooth, Co., Kildare, Ireland), respectively, following the manufacturers’ instructions. For the Hp determination, the blood serum was diluted 1 : 3 and the plates were read at 630 nm. For the CRP determination the blood serum was diluted 1 : 100 and the plates were read at 450 nm.
Immunohistochemistry
Tissue samples of the jejunum at 75% of the small intestine length were fixed overnight in 10% neutral buffered formalin and processed for paraffin or cryostat-embedding. Sections (7 µm thick) were cut, mounted on poly-l-lysine-coated slides and processed for chromogenic or fluorescence immunohistochemistry. Anti Ki67 rabbit monoclonal antibody 1 : 100 (cod. Ab16667; Abcam, Cambridge, UK) was used as a proliferation marker, the Apoptag® Plus Peroxidase in situ Apoptosis Detection Kit (cod. S7101; Millipore Corporation, Billerica, Massachusetts, USA) was used to detect the cells in apoptotic phase and anti zonula occludens 1 (ZO-1) rabbit polyclonal 1 : 200 (cod. 617300; Invitrogen, Carlsbad, California, USA) was used as a marker for the integrity of the cell tight junctions (TJ).
For each piglet, the Ki67-immunoreactive (-IR) and the apoptotic-IR cells were counted in the epithelium, randomly selecting 10 villi and 10 crypts. The expression of ZO-1 at the apical domain, as an indicator for ZO-1 bound in the TJ complex, was analyzed along 10 entire villus as described in Klunker et al. (Reference Klunker, Kahlert, Panther, Diesing, Reinhardt, Brosig, Kersten, Dänicke, Rothkötter and Kluess2013).
RNA isolation, microarray processing, quality control
Total messenger RNA was isolated from 50 mg of frozen jejunum tissue according to the Takara Fast Pure kit (Takara Bio, Shiga, Japan) protocol. The purity and concentration of the total RNA were checked using the Nanodrop ND 1000 (Nanodrop Technologies, Wilmington, Delaware, USA), whereas RNA integrity was assessed by Agilent Bioanalyzer 2100 (Agilent Technologies, Santa Clara, California, USA).
The analysis of whole transcript expression was carried out using Affymetrix©Porcine Gene 1.1 ST array strips. Hybridized arrays were scanned on a GeneAtlas imaging station (Affymetrix, Santa Clara, California, USA). Performance quality tests of the arrays including the labeling, hybridization, scanning and background signals from a Robust Multichip Analysis were carried out on the CEL files using Affymetrix Expression ConsoleTM.
Statistical analysis
Blood serum and intestinal morphology data were analyzed with ANOVA using the GLM procedure of SAS (SAS Institute. Inc., Cary, NC, USA) with a completely randomized design with the dietary treatment as fixed effect and pig as random effect. The DF for the dietary treatments were used to test the following orthogonal contrasts: CO v. yeast (PR, CM), PR v. CM and CO v. AB. P<0.05 was statistically significant and 0.05<P<0.10 was considered a trend.
The Affymetrix Transcripts IDs were associated to 13 406 Human gene names, based on Sus scrofa Ensembl (release 69, www.ensembl.org). An exploratory functional analysis was carried out on the processed gene expression values with Gene Set Enrichment Analysis using the C5.BP catalog of gene sets (based on Gene Ontology (GO)) (http://www.broadinstitute.org/gsea/msigdb/Index.jsp). The normalized enrichment score (NES) was calculated for each gene set, and statistical significance was defined when the False Discovery Rate % was <25 and the P-values of NES were <0.05. The P-values of the enrichment score were estimated using a gene set-based permutation test procedure.
The overlap in enriched GO terms was visualized using the Enrichment Map (http://baderlab.org/Software/EnrichmentMap20) plugin for Cytoscape 2.8.0 (http://www.cytoscape.org/21), including gene sets having a P-value <0.005 and an false discovery rate (FDR) q-value <0.10. The nodes were joined when the overlap coefficient was ⩾0.5.
The expression for each gene in the experimental groups was assessed using the Student’s t test against the control group, and the statistically significant genes (P<0.05) were listed when the linear fold change for log2 values was 2.0 in the case of the contrast AB v. CO, or 1.5 for PR or CM v. CO.
Results
The in vitro adhesion test confirmed that all the pigs were ETEC-susceptible. No signs of diarrhea were observed up to the time of slaughter. However, in additionally challenged pigs that were kept for another two weeks, the fecal scores worsened rapidly, but with a favorable effect of AB and, partially, of yeast treatments (Trevisi et al., Reference Trevisi, Colombo, Priori, Fontanesi, Galimberti, Calò, Motta, Latorre, Fanelli, Mezzullo, Pagotto, Gherpelli, D’Inca and Bosi2015a). Overall mortality varied from 70% in CO to 10% in AB.
Inflammatory proteins in blood and intestinal morphology
The concentrations of Hp and CRP did not show differences between the experimental groups, with average values of 322 mg/ml (SEM=23.6) and 1.75 µg/ml (SEM=0.32), respectively.
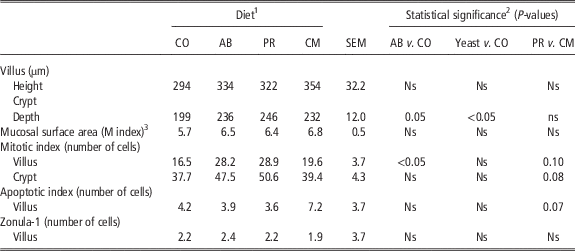
Table 1 shows the effect of the dietary supplementation of yeast at different times on the mucosa of the distal jejunum. Between the experimental groups, no significant differences were observed for villus height, villus width and crypt width, mucosal surface area and ZO-1 protein expression on the intestinal villi. Crypt depth increased with both antibiotic and yeast administration compared with the control group (P=0.05 and P<0.05, respectively).
Effect of dietary supplementation of Saccharomyces cerevisiae CNCM I-4407 at different times or of colistin, on the jejunum morphology of pigs, 24 h after Escherichia coli F4 (ETEC) challenge

1 Ns=P-value>0.10.
2 CO: no live yeast+challenge; AB: antibiotic+challenge; PR: preventive administration pattern of live yeast (5×10¹⁰ CFU/kg of feed from day 0 to sacrifice)+challenge; CM: competitive administration of live yeast (5×10¹⁰ CFU/kg of feed for 1 day after ETEC challenge)+challenge.
3 Calculated as described by Kisielinski et al.(2002).
In the jejunum villi, the AB group had a greater number of cells in mitosis than the CO group (P<0.05). The PR group tended to have more mitotic cells both in villi and crypts as compared with the CM group (P=0.10 and P=0.08, respectively), and the number of apoptotic cells tended to be lower in PR group than in CM group (P=0.07).
Microarray analysis
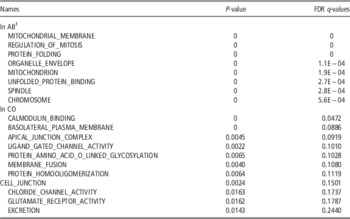
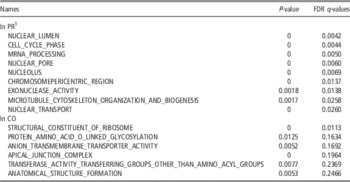
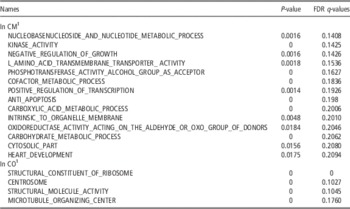
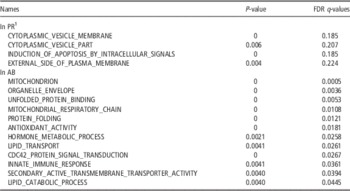
Tables 2 to 4 show the gene set enriched in the mucosa of the distal jejunum after the various dietary treatments as compared with the controls, whereas Table 5 shows gene set enrichments after PR compared with AB treatment.
First gene sets enriched in the jejunum tissue 24 h after oral Escherichia coli F4 (ETEC) challenge in pigs supplemented or not with colistin

1 AB=colistin+challenge; CO=no colistin+challenge; FDR=false discovery rate.
First gene sets enriched in the jejunum tissue, 24 h after oral Escherichia coli F4 (ETEC) challenge, in pigs supplemented for all the experimental period (PR) or not (CO) with Saccharomyces cerevisiae CNCM I-4407

1 PR: preventive administration pattern of live yeast (5×10¹⁰ CFU/kg of feed from day 0 to sacrifice)+challenge; CO: no live yeast+challenge; FDR = false discovery rate.
First gene sets enriched in the jejunum tissue, 24 h after oral Escherichia coli F4 (ETEC) challenge, in pigs supplemented from the day of the infection (CM) or not (CO) with Saccharomyces cerevisiae CNCM I-4407

1 CM: competitive administration of live yeast (5×10¹⁰ CFU/kg of feed) for 1 day after ETEC challenge); CO: no live yeast+challenge; FDR = false discovery rate.
First gene sets enriched in the jejunum tissue, 24 h after oral Escherichia coli F4 (ETEC) challenge, in pigs supplemented for all the experimental period with Saccharomyces cerevisiae CNCM I-4407 (PR) or with colistin (AB)

1 PR: preventive administration pattern of live yeast (5×10¹⁰ CFU/kg of feed from day 0 to sacrifice)+challenge; AB: colistin + challenge; FDR = false discovery rate.
When comparing AB v. CO, 143 and 17 gene sets were significantly enriched for AB and CO, respectively (Table 2). In the AB group, several gene sets involved in mitosis and in mitochondrial development ranked among the highest, whereas in the CO group the gene sets related to cell junction and anion channel ranked the top. The comparison of PR v. CO showed that 209 and 10 gene sets were significantly enriched for PR and CO, respectively (Table 3). In the PR group, several gene sets involved in mitosis and cell development ranked the top. Moreover, the gene set T_CELL_ACTIVATION was enriched in PR group. In CO several gene sets for anion channel and apical junction ranked among the highest. When comparing CM v. CO, 118 and 4 gene sets were significantly enriched for CM and CO, respectively (Table 4). In the CM group, the gene sets linked to the metabolic process and transcription ranked among the highest, but so did also the gene set which negatively regulates growth. When comparing PR v. AB, 4 and 72 gene sets were significantly enriched for PR and AB, respectively (Table 5).
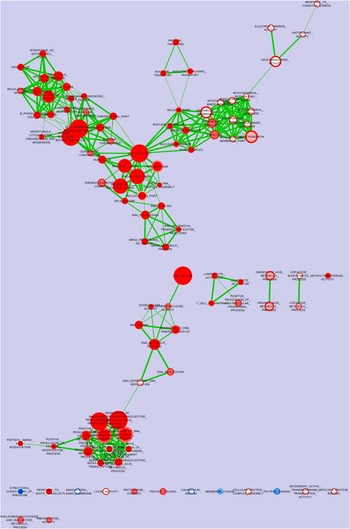
Particularly, for AB, gene sets related to mitochondria, lipid metabolism, innate immunity and glycoprotein-specific chaperone activity were enriched. Figure 1 depicts the nodes of the gene sets in common or those regulated separately by PR and AB, both compared with CO. The nodes represent gene sets. The color at the center of the node visualizes the PR treatment, the color on the ring represents the AB treatment, whereas the edges represent the mutual overlap. The enrichment significance (P-value) is proportional to the node color intensity where red represents upregulation and blue downregulation. The node size represents the number of genes enclosed in the gene set. The AB and PR groups show three well-defined common nodes containing the gene sets involved in cell mitosis, nuclear activity and transcriptional factors. Moreover, the AB group shows an independent node, for the most part containing gene sets for mitochondrial development and a small node related to the response to the oxidative stress. A low number of nodes in the gene sets were downregulated in the comparison of groups AB or PR v. the CO group.
Nodes of the gene sets regulated jointly or separately in the jejunum tissue, 24 h after oral Escherichia coli F4 (ETEC) administration, in pigs supplemented with Saccharomyces cerevisiae CNCM I-4407 from day 0 (the center of the nodes, PR group) or with colistin (the ring of the nodes AB group), both compared with untreated pigs (CO group). Enrichment significance (P-value) is conveyed as node color intensity, where red stands for upregulation, and blue for downregulation with PR or CO treatments, and white for no effect of the treatments. The size of the nodes represents how many genes are in the gene set.

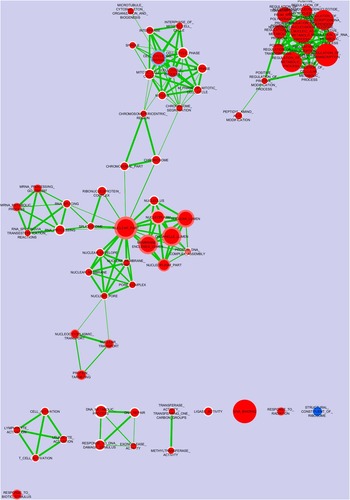
Figure 2 depicts the nodes of the gene sets which were regulated jointly or separately by PR (the center of the nodes) and CM (the ring of the nodes), both compared with CO. A large cluster of nodes related to the nucleotide metabolic process and to the positive regulation of transcription was upgraded both in PR and CM as compared with CO. Another cluster upregulated with both yeast treatments was related mainly to constitutive genes of nucleoplasma, whereas other sets related to nuclear structure and function were mainly upregulated in PR.
Nodes of the gene sets regulated jointly or separately in the jejunum tissue, 24 h after oral Escherichia coli F4 (ETEC) administration, in pigs supplemented from day 0 (the center of the nodes, PR group) or from the day of the infection (the ring of the nodes, CM group) with Saccharomyces cerevisiae CNCM I-4407, both compared with untreated pigs (CO group). Enrichment significance (P-value) is conveyed as node color intensity, where red stands for upregulation, and blue for downregulation with PR or CM treatments, and white for no effect of the treatments. The size of the node represents how many genes are in the gene set.

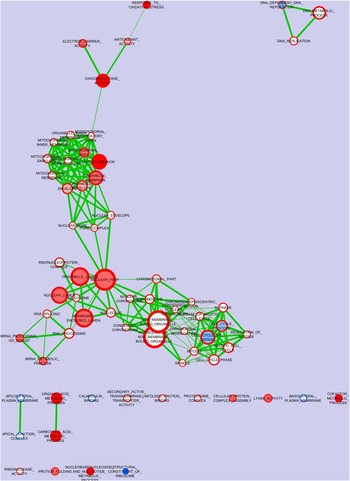
Figure 3 depicts the nodes of the gene sets which were regulated jointly or separately by CM (the center of the nodes) and AB (the ring of the nodes), both compared with CO.
Nodes of the gene sets were regulated jointly or separately in the jejunum tissue, 24 h after oral Escherichia coli F4 (ETEC) administration, in pigs supplemented from the day of the infection with Saccharomyces cerevisiae CNCM I-4407 (the center of the nodes, CM group) or with colistin (the ring of the nodes, AB group), both compared with untreated pigs (CO group). Enrichment significance (P-value) is conveyed as node color intensity, where red stands for upregulation, and blue for downregulation with CM or AB treatments, and white for no effect of the treatments. The size of the node represents how many genes are in the gene set.

A few nodes overlapped in both CM and AB. Among these, intense upregulation was seen in these treatments for nodes related to oxidative stress response, generally involved in the oxidoreductase activity as compared with CO. The upregulation of the genes related to the mitochondrial and nuclear structure was also seen to be associated.
Genes showing statistical significance and with linear fold change between treatments for log2 values equal or >2.0 (AB v. CO), or >1.5 (PR or CM v. CO) are reported in Supplementary Tables. When comparing AB v. CO (Supplementary Table S1), eight genes were upregulated: ectonucleotide pyrophosphatase/phosphodiesterase 7, SEC14-like protein 2, Carbonic anhydrase 12, Deoxyribonuclease I-Like 3, solute carrier family 5 member 4 (SLC5A4), glutamic pyruvate transaminase (alanine aminotransferase) 2, Stearoyl-CoA desaturase (SCD) and Apolipoprotein C-III, and 4 genes were downregulated: N-Acetyl-Glucosaminy Transferase 3, Mucin Type (GCNT3), G-protein coupled receptor 126 (GPR126), Chemokine (C-C Motif) Ligand 20 (CCL20) and Dual oxidase 2 (DUOX2).
When comparing PR v. CO (Supplementary Table S2), 12 genes were upregulated and the first seven were Transcription initiation factor TFIID subunit 7, Stearoyl-CoA desaturase, Cluster of Differentiation 69, Granzyme K (GZMK), Protein kinase C theta (PRKCQ), Neurolysin, Ikaros family zinc finger protein 3 (IKZF3), RAS guanyl-releasing protein 1, Cluster of Differentiation 8, and seven genes were downregulated: Interferon-related developmental regulator 1 (IFRD1), 6-Phosphofructo-2-Kinase/Fructose-2,6-Biphosphatase 3, Lipase member H, Vascular Endothelial Growth Factor A (VEGFA), P2Y purinoceptor 4, Trefoil factor 3 (TFF3) and CCL20.
When comparing CM v. CO (Supplementary Table S3), 18 genes were upregulated, and the first seven genes were SCD, Phosphoenolpyruvate carboxykinase 1, IGF-1, Neurolysin, Proline-Rich Protein 19, Unc-5 Homolog C (C. Elegans)-Like (UNC5CL), Peroxisome proliferator-activated receptor γ coactivator 1-α (PPARGC-1), phosphatidylethanolamine N-methyltransferase, Solute carrier family 6, member 20 and Chemokine-Like Factor Superfamily Member 7; 10 genes were downregulated, and the first seven were Centromere protein K, Transient receptor potential channel 1 (TRPC1), Fibrinogen-like protein 2 (FGL2), Sterile Alpha Motif Domain Containing 9, Interleukin 7 Receptor, ATP-Binding Cassette, Sub-Family C, member 2.
Discussion
Our previous companion paper reported that the preventive supplementation of Sc reduced the diarrhea occurrence in the first days after infection with ETEC and delayed mortality (Trevisi et al., Reference Trevisi, Colombo, Priori, Fontanesi, Galimberti, Calò, Motta, Latorre, Fanelli, Mezzullo, Pagotto, Gherpelli, D’Inca and Bosi2015a); the results were similar even when the supplementation started immediately before the ETEC challenge.
In the present study, our attention was focused on the modifications occurring in the blood and in the intestinal mucosa 24 h after ETEC infection.
The blood concentrations of CRP and Hp were not affected either by yeast or by antibiotic supplementation. These two acute phase proteins are early markers of for inflammation stimulated by the challenge with bacterial lipopolysaccharide (LPS). However in an ETEC infection model (Badia et al., Reference Badia, Lizardo, Martinez, Badiola and Brufau2012), a strong increase of in the blood concentration of CRP was observed 48 h after infection. This delay in the inflammatory response could have been due to the longer time taken by ETEC to diffuse LPS to the host, than in the case of the challenge with free LPS. Furthermore, live S. cerevisiae (Sc47) reduced the CRP concentration in the blood to the same extent that with as colistin treatment (Badia et al., Reference Badia, Lizardo, Martinez, Badiola and Brufau2012). Thus, a time of 24 h after infection with live ETEC could have not been sufficient in our trial to completely stimulate the liver synthesis of these proteins under the effects of pro-inflammatory cytokines.
ETEC endotoxins affect also the morphology of the intestinal mucosa (Priori et al., Reference Priori, Colombo, Koopmans, Jansman, van der Meulen, Trevisi and Bosi2016). In 28-day-old healthy pigs, the administration of S. boulardii improved the ileal morphology and increased the cell mitosis rate (Bontempo et al., Reference Bontempo, Di Giancamillo, Savoini, Dell’Orto and Domeneghini2006). In the present study, the yeast supplementation mimed the effect of the antibiotic on crypt depth and the villus mitotic index (in PR group), confirming the positive effects of Saccharomyces spp. on the small intestine morphology. In our study, ETEC adhered to the intestinal villi of all pigs and presumably started to activate the cell signaling involved in cell turnover and inflammation (Zhou et al., Reference Zhou, Liu, Jiang, Yu and Zhang2012). In the follow-up experiment (Trevisi et al., Reference Trevisi, Colombo, Priori, Fontanesi, Galimberti, Calò, Motta, Latorre, Fanelli, Mezzullo, Pagotto, Gherpelli, D’Inca and Bosi2015a), the fecal score evidenced the first signs of diarrhea from 24 h after infection. Thus, the infection may have reduced the mitotic potential in the villi while the protective effects of the antibiotic preserved the normal proliferative activity of the intestinal mucosa as observed in pigs preventively treated with yeast. Conversely, the competitive administration of yeast did not preserve a positive balance of the mitotic cells. The effect of the timing of supplementation was confirmed by the observation that the number of apoptotic cells in the villi of the PR group tended to decrease compared with the CM group.
No article was found on the effect of yeast administration on the transcriptome profile in the pig intestine under ETEC stimulation. This study showed that already 24 h post-infection before clinical symptoms became apparent, the transcriptome of the small intestine was deeply modified by the treatments. The addition of antibiotic or yeast from the beginning of the trial created conditions in the gut that promoted the upregulation of several clusters of gene sets after ETEC challenge, compared with control. The first cluster was related to the processes associated with cell nuclear activity, RNA processing and cell multiplication. Typically, LPS impairs the enterocyte turnover (Ruemmele et al., Reference Ruemmele, Beaulieu, Dionne, Levy, Seidman, Cerf-Bensussan and Lentze2002), with several tumor necrosis factor α (TNFα)-dependent inflammatory-related effects. The jejunal transcriptome thus confirmed the observations of the higher mitotic index in the villi and demonstrated the favorable effect of the antibiotic, as well as of the continuous supply of yeast starting immediately after weaning, counteracting the impact of ETEC infection.
Shifting in the gut microbiota composition was observed (Le Bon et al., Reference Le Bon, Davies, Glynn, Thompson, Madden, Wiseman, Dodda, Hurdidgec, Paynec, Le Treutd, Craigona, Tötemeyerb and Craigon2010) or not (Li et al., Reference Li, Li, Gong, Ma, He and Zhai2006) after live yeast continuous feeding in pigs, and may also partially explain the changes observed in these gene sets caused by PR.
A cluster of genes related to leukocyte, lymphocyte and T cell activation was upregulated by both the AB and the PR treatments. It could be hypothesized that preliminary treatment for 1 week could have supported the increase in immune-competent cell production as already evidenced during the supply of probiotics in infected pigs (Rieger et al., Reference Rieger, Janczyk, Hünigen, Neumann and Plendl2015). The upregulation of genes involved in the differentiation and proliferation of T and B lymphocytes, after the preventive supply of the yeast, indicated a stronger stimulation of the gut mucosa and the activation of the canonical nuclear factor kappa-light-chain-enhancer of activated B cells (NFκB) pathways (Wullaert et al., Reference Wullaert, Bonnet and Pasparakis2011). On the other hand, the PR diet, like AB, downregulated the CCL20 chemokine, preventing the effect observed in a variety of inflammatory disorders (Sibartie et al., Reference Sibartie, O’Hara, Ryan, Fanning, O’Mahony, O’Neill, Sheil, O’Mahony and Shanahan2009). These data were reinforced by the reduction of the expression of IFRD, an IFN-inducible gene (Mulder et al., Reference Mulder, Schmidt, Stokes, Lewis, Bailey, Aminov, Prosser, Gill, Pluske, Mayer, Musk and Kelly2009), of TFF3, a gene strongly induced after mucosal injury (Taupin et al., Reference Taupin, Pedersen, Familari, Cook, Yeomans and Giraud2001) and of VEGF-A, a target gene involved in the induction of mucosal inflammation (Scaldaferri et al., Reference Scaldaferri, Vetrano, Sans, Arena, Straface, Stigliano, Repici, Sturm, Malesci, Panes, Yla–Herttuala, Fiocchi and Danese2009). These results indicated the role of Sc in maintaining mucosal homeostasis during ETEC infection. A study based on the IPEC-1 cell line showed the ability of this strain of Sc to inhibit the ETEC-induced expression of pro-inflammatory transcripts, but not to contain the reduction of the transepithelial electric resistance (Zanello et al., Reference Zanello, Berri, Dupont, Sizaret, D’Inca, Salmon and Meurens2011).
Both AB and PR downregulated the gene sets involved in the anion channel activity and in the cell junction, which collaborate in modulating the intestinal permeability and integrity. The Claudin 2 gene was downregulated, whereas Claudins 5 and 8 were upregulated by the antibiotic, confirming the interaction between epithelial claudins in the intestine, immediately after pathogen adhesion to the intestinal villi. Mucins can be upregulated by several inflammatory cytokines and the formation of their O-glycans requires the addition of glycosyl groups. In this study, PROTEIN_AMINO_ACID_O_LINKED_GLYCOSYLATION was downregulated by AB and PR. Within this pathway, these treatments prevented the upregulation of GCNT3, involved in the biosynthesis of mucins, observed in previous research by pathogen infection (Li et al., Reference Li, Li, Elsasser, Liua, Garrett and Gasbarre2009; Niewold et al., Reference Niewold, van der Meulena, Kerstens, Smits and Hulst2010).
The protective effect of colistin was also evidenced by the upregulation of gene sets involved in the host cell mitochondria function, that can be impaired by pathogenic E. coli (Ma et al., Reference Ma, Wickham, Guttman, Deng, Walker, Madsen, Jacobson, Vogl, Finley and Vallance2006), and in the antioxidant activity, and by the downregulation of other genes linked to LPS, primarily DUOX2, that generates reactive oxygen species, such as during the gastrointestinal host defense.
Globally, the transcriptomic profile of the AB group supported the other results, showing that the direct effect of the colistin against ETEC increased the cell energy utilization and protected the intestinal mucosa from inflammation, maintaining an optimal health status in the pigs.
In the CM group the transcriptome profile was enriched in some pathways v. the CO group although the yeast was supplied for just 1 day after the ETEC challenge. The upregulation of a complex group of nodes related to the nucleotide metabolic process and to the positive regulation of transcription, overlapped with the effect of the longer yeast treatment. This upregulation was less evident after the treatment with antibiotic and may thus be a particular effect of the yeast. Conversely, a cluster of upregulated gene sets related to antioxidant activity matched with the antibiotic treatment, including particularly IGF-1, a key gene capable of reducing the induction of cell apoptosis while maintaining cell growth under oxidative stress (Baregamian et al., Reference Baregamian, Song, Jeschke, Evers and Chung2006), and THOC5 which reduces bacteria translocation and is a major regulator of homeostatic self-renewal within the intestinal crypt (Saran et al., Reference Saran, Tran, Klebba-Färber, Moran-Losada, Wiehlmann, Koch, Chopra, Pabst, Hoffmann, Klopfleisch and Tamura2013). Moreover, the CM diet was able to reduce the ETEC effect, increasing the expression of PPAR-γ, a gene widely recognized for its anti-inflammatory effect (Ortuño Sahagún et al., Reference Ortuño Sahagún, Márquez-Aguirre, Quintero-Fabián, López-Roa and Rojas-Mayorquín2012) and confirming in vitro data (Zanello et al., Reference Zanello, Berri, Dupont, Sizaret, D’Inca, Salmon and Meurens2011). On the other hand, the competitive administration of yeast did not completely protect the intestinal mucosa from the activation of several genes involved in mucosal inflammation. In summary, the brief administration of Sc slightly restrained the detrimental effects of ETEC infection, partially maintaining some metabolic processes and reducing the impact of post-challenge inflammation. This effect agrees with the other results obtained with this kind of treatment, pairing thus with the ability of inhibiting the severity of diarrhea (Trevisi et al., Reference Trevisi, Colombo, Priori, Fontanesi, Galimberti, Calò, Motta, Latorre, Fanelli, Mezzullo, Pagotto, Gherpelli, D’Inca and Bosi2015a).
In conclusion, the results showed that a dose of 5×10¹⁰ CFU of Sc/kg of feed was effective in counteracting the detrimental effect of ETEC infection in susceptible pigs by means of the modulation of the transcriptomic profile of the intestinal mucosa. Moreover, this study provided evidence that the tested strain of Sc was able to delay the impairment of the intestinal mucosa even when supplied simultaneously to ETEC; perhaps a dose response trial could help to elucidate this preliminary evidence. Nevertheless, the highlighting of a partial similarity between the effects of colistin and of live S. cerevisiae on the transcriptome of the small intestine reinforces the interest in using yeast probiotics in a preventive or competitive way against ETEC around the time of weaning, to limit the use of antibiotics for curative purposes.
Acknowledgements
Supported in part by funding from Phileo–Lesaffre Animal Care, Marcq-en-Baroeul, France.
Supplementary Material
To view supplementary material for this article, please visit http://dx.doi.org/10.1017/S1751731116001178