

In writing economics one is not writing either a mathematical proof or a legal document. One is trying to arouse and appeal to the reader’s intuitions.
—John Maynard Keynes to Robert B. Bryce, 1935
The specialist in the manufacture of models will not be successful unless he is constantly correcting his judgment by intimate and messy acquaintance with the facts to which his model has to be applied.
—John Maynard Keynes to Roy F. Harrod, 1938
I beg for an occasional re-reading of what I did say!
—John Maynard Keynes to Elizabeth W. Gilboy, Reference Gilboy1939
I. INTRODUCTION
After a hiatus of nearly three decades, the “liquidity trap” has experienced a revival as a prominent topic for both academic economists and business journalists. This disorder is said to be a trap for monetary policy—a situation in which vanishingly low short-term interest rates prove an inadequate stimulus for an economy in deep depression. The sudden attention to this possibility in the US was triggered by the collapse of the housing market, the unwinding of collateralized mortgage instruments, and the Lehman Brothers’ bankruptcy in September 2008.Footnote 1 These events produced a credit crisis, precipitated a recession, and threatened deflation or worse. The unemployment rate jumped from 6.1% in September to 7.3% in December. The Federal Reserve responded at first with the orthodox policy, reducing the federal funds rate target from 2% to 1.5%, and then to 1%. The three-month Treasury bill rate fell much lower and remained consistently below those targets through the middle of December.Footnote 2
On December 16 the Fed replaced the single-valued federal funds target with a target range between zero and 0.25%. The three-month Treasury bill rate fell to zero two days later and averaged 0.04% for the last two weeks of December 2008. At that point orthodox monetary policy seemed constrained by the “zero lower bound” (ZLB), since short-term rates could go no lower than zero (Bernanke Reference Bernanke2015, pp. 61–62 and 418). The possibility that short rates might zero out had been contemplated by Fed officials, and a menu of innovative policy responses had been explored as early as 2002 (Bernanke Reference Bernanke2002). One of those proposals was “quantitative easing” (QE).With its conventional anti-recession ammunition spent, the Federal Reserve implemented this non-traditional policy in early January 2009. The move was interpreted by many as an end run around the liquidity trap at the ZLB.
“Quantitative easing” is a policy where the Federal Reserve buys long-term bonds and mortgage-backed securities using newly created reserve balances. The objective is to stimulate investment spending, home purchases, and possibly consumer durable expenditures by lowering long-term interest rates, making it cheaper for potential investors to borrow the needed financing. The program continued for nearly six years and was not concluded until October of 2014.Footnote 3 A “policy normalization process” was initiated fourteen months later in December of 2015. The target federal funds rate was increased to a range of 0.25% to 0.5%. After seven years the American economy, while steadily improving since the summer of 2009, was still operating below par. Wages were stagnant, the employment rate was low, output remained well below the growth path, and inflation was below target (Hall Reference Hall2016).
Until these recent events, the liquidity trap was thought to be merely a theoretical curiosity or—if ever relevant—an almost forgotten and short-lived phenomenon of the Great Depression. The near-zero short-term rate and the Fed’s commitment to an unconventional policy pursued with earnest tenacity for so long has, naturally enough, produced an outpouring of academic literature both theoretical and empirical. Many of these contributions make reference, in passing, to the liquidity trap attributed to John Maynard Keynes as described in The General Theory of Employment, Interest, and Money (1936). Yet, while the citation is evocative, there has been no attempt to mine the richness of Keynes’s treatment to further the understanding of the quantitative easing policy. Keynes not only offered an original analysis of the problem posed by zero interest rates, he actually advocated the very policies recently pursued. His analysis remains surprisingly relevant today. Keynes’s comments on these issues are rarely mentioned in the current discussions because subsequent simplifications and bowdlerization of his theory obliterated this detail.
II. OUTLINE OF THE ARGUMENT
Several of Keynes’s policy prescriptions for the Depression are well known. He advertised them in a widely circulated open letter addressed to President Franklin Roosevelt in December of 1933. He was skeptical of the efficacy of increasing the money supply: “This is like trying to get fat by buying a larger belt.” Foremost in his policy recommendations was a proposal for “a large volume of loan-expenditures under Government auspices.” Yet, it is often overlooked that Keynes had not given up on the possibility of stimulating private investment expenditures. At the time, the short-term rate was stuck well below 0.5%. It had dipped to 0.05% in September. But Keynes was focused not on the short-term rate, but the long: “I put in the second place the maintenance of cheap and abundant credit and in particular the reduction of the long-term rates of interest.”Footnote 4 Speaking directly to the president, he said:
I see no reason why you should not reduce the rate of interest on your long-term Government Bonds to 2½ per cent or less with favourable repercussions on the whole bond market, if only the Federal Reserve System would replace its present holdings of short-dated Treasury issues by purchasing long-dated issues in exchange.Footnote 5
Two years later the General Theory kept the hope for this unconventional policy alive, but at that time Keynes warned there might be a lower limit to the long-term rate, “which in the present circumstances may perhaps be as high as 2 or 2 ½ per cent” (Keynes Reference Keynes and Moggridge1936 [hereafter GT], pp. 218–219).
Keynes offered three reasons why an effective floor to long-term interest rates might be encountered at the depth of a depression.
(1) The term structure of interest rates is not very flexible. When short-term rates are historically low, the maturity structure of interest rates will rise with increasing duration of the securities. Thus, a point might be reached where continued open-market purchases of short-term government debt would reduce the short-term rate close to zero before producing a sufficient decline in the risk-free long-term rate (GT, pp. 201–204 and 233).
(2) Investment projects are inherently risky. The default premiums included as a portion of the interest charged on business loans and on the return to corporate securities could become so great during a widespread depression, it would prove impossible to lower the rate of interest relevant for most business decisions even though the risk-free long-term rate was being reduced (GT, pp. 144–145).
(3) Cash can become a perfect substitute for treasury securities. It is, at least theoretically, possible the demand for money could become unquenchable (“virtually absolute”) at a sufficiently low long-term interest rate on government bonds, and, if so, then increases in the money supply would be absorbed completely by hoarding (GT, pp. 172 and 207–208).
In many descriptions of the “Keynesian liquidity trap,” only reason number three is noted, and even then there is often a failure to recognize that the problem Keynes pointed to was the difficulty of achieving low long-term yields, not low short-term rates.
This essay has three tasks. First, I review and explicate the three-pronged theory of the liquidity trap presented in the General Theory. I believe my interpretation has some advantage for considering QE policies in the presence of the zero lower bound. Second, I describe Keynes’s unconventional monetary policy proposals to address the calamity of the Great Depression. They are surprisingly similar to the unconventional policies pursued recently during the “Great Recession.” Third, I employ a narrative approach to examine the impact of Federal Reserve and Treasury policies during the mid-to late 1930s with Keynes’s views as an organizing devise and a guide.
III. SOME DIFFICULTIES
Several difficulties have so far impeded the discussion of Keynes’s thinking about policy at the zero lower bound. Keynes made a great effort to cast his theory into the specific policy context of his time (Hoover Reference Hoover, Backhouse and Bateman2006, p. 96). Since the problems and the policy context of the modern economy are thought to be so different from those of eight or nine decades ago, some observers are tempted to ignore the detailed analysis of the General Theory as stale or obsolete. Those who do dig in sometimes find Keynes difficult to pin down. As James Tobin explained, when Keynes discussed a phenomenon he generally offered “a number of possible theoretical explanations, supported and enriched by the experience and insight of the author” (Tobin Reference Tobin1958, p. 70). And then, the General Theory’s theoretical novelty, its tantalizing promise to solve the puzzle of sustained unemployment, and its practical (but radical for its time) policy advice attracted no shortage of interpreters with alternative interpretations. As a consequence, there is no agreement on the definition of the liquidity trap. There is even a disagreement on whether Keynes believed the United States was in a liquidity trap at any point during the Great Depression.
The problem here is Keynes did not coin or employ this name for the economic ailment that now flies under the Keynesian flag. The honor of first use belongs to Dennis Robertson, who used the term in 1940 (pp. 34–36). It was then picked up and popularized by John Hicks, who defined the “liquidity trap for saving” as “Mr. Keynes’s doctrine about the difficulty of reducing the rate of interest below a certain minimum level” (Hicks Reference Hicks1942, p. 56). So, it is up to the reader of the General Theory to decide which passages describe the “true” concept and which caveats modify or constrain it.
On one side are those who define the “liquidity trap” as synonymous with a situation when the short-term government security (Treasury bills) or the overnight rate has reached the zero lower bound. Paul Krugman represents this now orthodox interpretation: “Interest rates can’t go below zero (except trivially for very short periods), because investors always have the option of simply holding cash” (Krugman Reference Krugman2013, para. 2). Alternatively, Peter Basile, John Landon-Lane, and Hugh Rockoff proposed a “full-spectrum liquidity trap” that is actually more in line with Keynes than Krugman. “A true liquidity trap requires that the entire spectrum of rates, including rates on long-term government debt and short and long-term private debts, must have reached low sticking points to conclude that the economy had entered a liquidity trap” (Basile, Landon-Lane, and Rockoff Reference Basile, Landon-Lane, Rockoff, Wood, Mills and Crafts2010, p. 3; emphasis added).
This difference in definitions is charged with an emotional tinge because of the implication that when the ZLB trap is present, traditional monetary policy becomes useless: “the quantity of money becomes irrelevant” (Krugman Reference Krugman1998, p. 137). In the context of the 1930s this ineffectiveness corollary meant—in the view of early Keynesians—that deficit spending was the only policy capable of shortening the Depression. A traditional monetary policy to stimulate the economy involved purchasing short-term government securities in the open market to lower short-term rates, obviously impossible to continue at the ZLB. Monetarists, on the other hand, conceptualize a stimulating monetary policy as involving an expansion of some monetary aggregate, however achieved. This action, they point out, is still possible at the ZLB if the Fed is willing to purchase long-term government bonds, corporate bonds, and junk bonds.
That is precisely what the Federal Reserve was doing with its controversial quantitative easing policy during the Great Recession and what Keynes forcefully advocated for the Great Depression.
IV. A KEYNESIAN THEORY OF THE ZLB TRAP
Keynes’s analysis of monetary policy during the Great Depression contains three distinct assertions about the economy of the 1930s. Together, they described the zero lower bound trap.
(1) The collapse of the investment demand schedule had been so great that the long-term borrowing rate would have to be reduced to very low levels before the quantity of investment demanded would be adequate to restore full employment.
(2) Orthodox monetary policies had failed to reduce the long-term interest rate sufficiently because, under depressed conditions, there was an effective floor to short-term bill rates at or near zero.
(3) Unconventional monetary policies would probably be of only minor “practicable” value because there will be an effective minimum for the longer-term borrowing rate available to potential entrepreneurs and investors.
The first phenomenon, the collapse of investment demand, is the defining characteristic of a “Keynesian depression”: that is, a depression caused by inadequate aggregate demand induced by a perception that investment opportunities were exhausted and characterized by a loss of business confidence (Keynes [Reference Keynes, Wright and Moggridge1931a] 1970, p. 344; 1934; and GT, pp. 315–317). The second phenomenon is now commonly called the “liquidity trap.” The third element envisions the possibility that quantitative easing may be limited in its ability to achieve recovery unaided by fiscal stimulus (GT, pp. 164 and 378). It is important to note the floor to long-term lending rates suggested by number 3 is predicated on the requirement that the short-term rate is already at its lower bound. Elements 2 and 3 taken together might be described as the “full-spectrum liquidity trap.”
V. THE COLLAPSE OF FIXED INVESTMENT, 1929–1932
Keynes thought the worldwide depression of the 1930s was produced by a massive collapse of investment demand. His analysis can be found in the first of three lectures he delivered in Chicago in June 1931. “I see no reason to be in the slightest degree doubtful about the initiating causes of the slump. ... I find the explanation … not in the high level of investment which was proceeding up to the spring of 1929, but in the subsequent cessation of this investment” (Keynes [Reference Keynes, Wright and Moggridge1931a] 1970, p. 344). The point is repeated in the General Theory with supporting data from Simon Kuznets’s annual estimates of capital formation in the United States from 1925 to 1933 (GT, pp. 102–104; Keynes Reference Keynes and Moggridge1936b; Kuznets Reference Kuznets1934).Footnote 6 While the available facts supported his view, the question remained: Why was the demand for investment so unstable?
Following the publication of the General Theory, Keynes stated that his most important departure from previous theory was to offer an explanation for this precarious instability of investment. Instability was an implication of his analysis of decision making under uncertainty. Noting that investment is undertaken only “to produce results, or potential results, at a comparatively distant, and sometimes at an indefinitely distant, date,” Keynes insisted the outcome of an investment project was inherently uncertain and not subject to probabilistic calculation: “We simply do not know.” How does the potential investor manage in the face of this uncertainty? Both visionary entrepreneurs and sober business managers employ three “polite [psychological] techniques, made for a well-panelled Board Room and a nicely regulated market.” Taking on the voice of an investor, which of course he was,
(1) We assume that the present is a much more serviceable guide to the future than a candid examination of past experience would show it to have been hitherto. In other words we largely ignore the prospect of future changes about the actual character of which we know nothing.
(2) We assume that the existing … prices and the character of existing output [are] based on a correct summing up of future prospects, so that we can accept it as such unless and until something new and relevant comes into the picture.
And, most significantly,
(3) Knowing that our own individual judgment is worthless, we endeavor to fall back on the judgment of the rest of the world which is perhaps better informed. That is, we endeavor to conform with the behavior of the majority or the average.
But, of course, “a practical theory of the future based … on so flimsy a foundation … is subject to sudden and violent changes. The [polite boardroom] practice of calmness and immobility, of certainty and security, suddenly breaks down. New fears and hopes will, without warning, take charge of human conduct” (Keynes Reference Keynes1937, pp. 212–215).
In Keynes’s formulation each potential investor—whatever his or her hopes about the future and whatever degrees of optimism and confidence are held about them—makes a guess about the benefits to come from a proposed enterprise. The aggregation of all those guesses is the macroeconomic demand for investment as a function of the anticipated rate of return, the “marginal efficiency of capital,” in Keynes’s terminology. Keynes remarked that “it is our innate urge to activity which makes the wheels go round, our rational selves choosing between the alternatives as best we are able, calculating where we can, but often falling back for our motive on whim or sentiment or chance” (GT, p. 163). The collapse of the aggregate investment demand schedule is triggered when a visible event—say, the stock market crash of 1929 or the failure of Lehman Brothers in 2008—influences many prudent investors to turn cautious or pessimistic at the same time or when herd behavior overtakes the psychology of many, causing panic or irrational exuberance as the case may be (Shiller Reference Shiller2000).Footnote 7
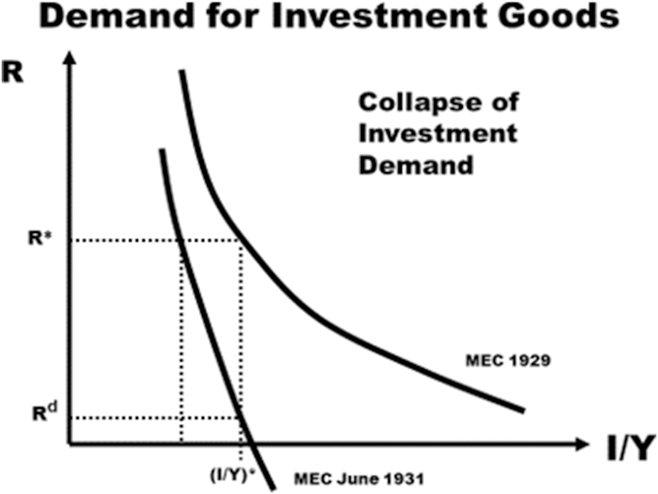
If, as Keynes believed, the demand schedule for investment collapsed sometime after the spring of 1929, one might picture the before and after demand curves portraying the marginal efficiency of capital (MEC) as drawn in Figure 1. The fraction of net national product accounted for by net fixed investment (I/Y) is plotted on the horizontal axis.Footnote 8 The vertical axis indicates both the hoped-for returns of the array of potential projects (MEC) and the relevant rate of interest charged for borrowing to finance them (R). The higher of the two curves is meant to represent the pre-Depression situation (say in early 1929), with (I/Y)* measuring the level of investment compatible with full employment and R* indicating the level of the interest rate consistent with the maintenance of full employment.Footnote 9 The lower of the two curves represents the situation after the collapse in investment (say in mid-1931 when Keynes was in Chicago). As drawn, a substantial fall in the relevant rate of interest to very low levels, from R* to R d, would be needed to return investment demand to the full employment level.Footnote 10
The marginal efficiency of capital (MEC) before and after the spring of 1929 illustrating the collapse of investment demand.

The post-collapse demand curve in Figure 1 is drawn as less elastic than the pre-collapse demand curve at R *. After a depression is underway, many firms will have excess capacity. Before they are willing to undertake new investments to expand their productive capacity, they will want to put the existing plant and equipment back to work. At the bottom of the cycle a reduction in the rate of interest may produce only a very feeble stimulus to new investment. This point seems reasonable, but is not an essential part of the argument.Footnote 11 What is of some importance, though, is whether the investment demand curve intersects the horizontal axis. If so, then it would be possible for the investment demand curve to fall so far it would intersect the horizontal axis at a point to the left of (I/Y)*, so even a rate of interest of 0% would not restore full employment (GT, pp. 316 and 319–320).
The relevant interest rate for this conceptualization of the inducement to invest is the rate charged for borrowed money to the firms and entrepreneurs whose demands are represented by the MEC curves. Keynes described the demand for new fixed investment as a function of the nominal long-term interest rate (GT, pp. 222–229). He preferred to embed all of the uncertainties about the potential returns, including the uncertainty about future prices, into the demand schedule. In the schematic diagram, R* is a long-term borrowing rate, because the MEC curve represents borrowers’ anticipated rate of return on the array of potential long-term investment projects calculated in nominal terms. The curve slopes down because the investment projects are arranged in the order of their projected return, with the most promising projects at the left and the less attractive ones towards the right.
Entrepreneurs are assumed to borrow money to finance any projects undertaken. Maximizing behavior assures that every project where the expected rate of return exceeds the rate of interest charged by willing lenders will be undertaken. As these attractive projects are funded, they must be replaced by a new batch of equally attractive projects or the upper portions of the demand curve will shift to the left. This is what Keynes meant when he conjectured that the slump in 1929 occurred when “all the best propositions had got taken up, and the cream was off the business” (Keynes [Reference Keynes, Wright and Moggridge1931a] 1970, pp. 350).
VI. THE FAILURE OF ORTHODOX POLICY, 1932–1935
Orthodox monetary policy directed the central bank to purchase short-term government securities in the open market (Hawtrey Reference Hawtrey1933, p. 26). The Federal Reserve would pay for the securities by creating reserves (or printing money), which would be deposited in the seller’s bank account. This action would drive up the price of short bills in the market and lower their yield. This was intended to stimulate business activity by cheapening the cost of obtaining working capital, by signaling the central bank’s intention to actively promote recovery, and by encouraging bankers to relax the collateral conditions for making business loans. These consequences would restore confidence and shift the demand for investment schedule up and to the right (Hicks 1939b, pp. 21–22 and 33–35).
Despite this formula for executing a traditional policy, the Federal Reserve was anything but consistent and coherent during the contraction, which lasted from mid-1929 to mid-1932. There was an absence of a system-wide policy and a lack of agreement among those on the Board of Governors about how the economy would respond to alternative actions. George Harrison, who, as president of the New York Federal Reserve Bank, was chair of the open market conferences, was indecisive. Eugene Meyer, chairman of the Federal Reserve, advocated traditional open-market policies but felt constrained by the gold standard and the requirement that Federal Reserve notes be backed by gold. Expansionary polices were frequently opposed because of a conjectured danger of inflation. As a consequence, policy was passive, vacillating, or half-hearted. In late 1931 it was positively perverse.Footnote 12
A major problem was the belief of the monetary and fiscal authorities that the economy was self-correcting. Gerald Epstein and Thomas Ferguson offer this as the primary explanation for the Federal Reserve’s “Jovian indifference” to the collapsing economy (Epstein and Ferguson Reference Epstein and Ferguson1984, pp. 958 and 963). Keynes might well have agreed.
The real obstacle here is, I think, that the minds of most people are still riddled with the fallacy that the volume of investment and the rate of interest are maintained at the right figures by some absolutely reliable automatic mechanism. … If only this deep-seated habit of thought could be eradicated! (Keynes Reference Keynes1932, p. 423)Footnote 13
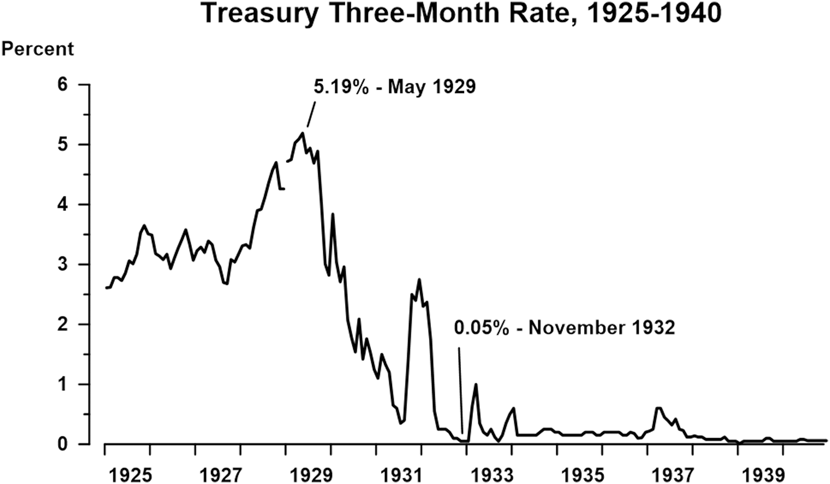
Figure 2 presents monthly data on the short-term rate of interest in the United States from 1925 to 1940. During the collapse short rates declined more as a consequence of a flight to “safe” short-term assets than to Fed policy. But, finally, after succumbing to congressional demands, open-market purchases were conducted between April and August of 1932. The short rate responded dramatically, falling from 1.75% in March to 0.2% in August. It was an election year and considerable uncertainty existed about what economic policy might be in the near future. Many businesses postponed investment plans, and the continuing rush to short-term assets reduced interest rates without additional purchases by the Fed. The three-month rate actually fell to five-one-hundredth of one percent in November of 1932.
The short-term interest rate over the course of the Great Depression. See the section at the end of this article for the sources of the data.

The ZLB had been reached. Keynes was aware in late 1932 that the economy was ensnared in a policy trap. When listing “limitations on the ability of the monetary authority to establish any given complex of rates,” he noted that “in the United States at certain dates in 1932 there was … a crisis of liquidation, when scarcely anyone could be induced to part with holdings of money on any reasonable terms” (GT, pp. 207–208).
With rates near zero and Congress’s demand for low rates temporarily appeased, there was apparently little discussion during the November 1932 and January 1933 meetings of the Open Market Conference of how to further address the ongoing economic paralysis, sky-high unemployment, and falling prices. Attention was focused instead on the threat to gold reserves. Franklin Roosevelt had been elected president, and there was uncertainty about whether he would continue to support the gold standard (Wigmore 1988). If the dollar were devalued, gold would jump in value; if not, those who held gold could return to dollars without a loss. Gold seemed a sure bet (Eichengreen Reference Eichengreen2015, pp. 163–164). The proposal actually discussed at the conferences was to sell short securities (not purchase them, as orthodox stimulus policy would have it). Since gold earned no interest, higher rates resulting from these sales might help to staunch any gold drain. Sales of short assets were made in January of 1933. Those sales and the short-run reaction to bank closures in February and March sent the short-term rate up to 1%. But thereafter the rate quickly subsided. It reached 0.15% in June and stayed close to zero for the rest of the decade (Figure 2). The liquidity trap of the 1930s was not a short-lived episode.
The economy began to recover noticeably after mid-1934. The election of Franklin Roosevelt seemed to produce a shift in expectations, boosting the hopes and confidence of many (Jalil and Rua Reference Jalil and Rua2015; Eggertsson Reference Eggertsson2008). The policy actions undertaken within a few months of his inauguration in March 1933 were a radical change. Roosevelt ended the commitment to tie the value of the dollar to gold, increased government spending without increasing taxes, and promised sweeping reforms. The Federal Reserve’s Index of Industrial Production rose 37% between October 1934 and April 1936 with a revival of business investment leading the expansion. The index of floor space for new construction jumped 90%; the index of machinery production was up 50%.
From the outset Keynes had been skeptical of the logic used to support the conventional policy of operating on the short-term rate to directly influence investment spending. When applied “in the right degree and at the right time,” the traditional policy might work to avoid an acute contraction. But if a depression were allowed to develop, he predicted, orthodoxy would fail. In that event, “if we leave matters to cure themselves, the results may be disastrous.” Near the end of the second volume of the Treatise on Money, Keynes suggested that when the traditional policy failed, as he feared it would, an all-out attack—“open-market operations à outrance”—would be required. When that day arrived, the monetary authorities should “buy long-dated securities either against an expansion of central bank money or against the sale of short-dated securities until the short-term market is saturated” (Keynes 1930, 2, pp. 325–326, 331, and 345–347; emphasis in the original). Yet, from 1933 through 1936 the Fed failed to follow Keynes’s suggestions. The monetary authorities were passive—“in the backseat,” as Allan Meltzer put it. They “watched events take place and failed to respond as long as the level of market interest rates remained low” (Meltzer Reference Meltzer2003, pp. 379 and 415). Keynes lamented “the monetary authority’s own practices in limiting its willingness” to act along the unconventional lines he proposed (GT, p. 207).
VII. THE LIMIT TO UNCONVENTIONAL POLICY, 1935–1936
By the time he was drafting the General Theory, Keynes had all but given up on open-market operations à outrance. “For the moment, the collapse in the marginal efficiency of capital may be so complete that no practicable reduction in the rate of interest will be enough.” The inspiration for his disenchantment is an overlooked, but central, proposition of the General Theory; the “inducement to invest will be found to depend on the relation between the schedule of the marginal efficiency of capital and the complex of rates of interest on loans of various maturities and risks” (GT, pp. 27–28; emphasis added).Footnote 14 As mentioned, Keynes offered a three-part explanation for why an effective floor to long-term interest rates would likely be encountered at the depth of a depression: the relative inflexibility of the term structure, the elevated risks of investment failure and loan default, and an increasingly insatiable demand for money.Footnote 15 To explicate this triplet, Keynes’s model of the term structure is required as it connects the world of banks, bills, and money to long-term lending rates (Keynes 1930, 2, p. 315).
The General Theory was written for an audience of economists, readers who in 1936 Keynes could presume were familiar with his earlier Treatise on Money (1930). While he had changed his mind on a number of critical theoretical points in the intervening years, he did not feel it necessary to repeat those ideas from the Treatise that he still regarded as sound (GT, pp. xxi–xxiii). This puts today’s readers at a disadvantage because the General Theory left his treatment of the term structure to a book now rarely studied.Footnote 16
ViII. TERM PREMIUMS AND INFLEXIBILITY OF THE TERM STRUCTURE
Keynes’s model of the term structure invokes the principle of arbitrage and the reality of uncertainty. There are two ways to invest for the long term. One could invest in a long-term bond and thus earn the long-term yield. Alternatively, a sequence of short-term investments chained end-to-end would carry the investor over the same long period. The long-term rate is known at the outset. If all the future short rates were also known with certainty, then arbitrage between the two alternatives would mean that the long-term rate would adjust to equal the yield from the stream of the future short-term returns. The real-world uncertainty about those future short rates, however, has two significant consequences. First, it means that the long-term rate would respond to the ex ante expected yield from the sequence of short rates.Footnote 17 Second, the uncertainty means there is some risk to the investor who chooses to hold an asset with a maturity length other than that preferred (GT, pp. 168–170).
The first consequence of uncertainty upsets the conventional bankers’ wisdom that the long-term rate would be insensitive to changes in the short-term interest rate (Keynes 1930, 2, p. 316). The explanation for a link between the two is that expectations about future rates will be influenced by both the level of, and recent changes in, the current short rate. When the short-period rate is below its “normal” level, it might be presumed that some persistence of this condition would be anticipated and thus long-period Treasury yields would also be lower than normal.Footnote 18
Still, it is unlikely investors will expect short-rates to be abnormally low for decades. Thus, expectations of the distant future are likely to be “sticky,” reflecting the market participants’ belief that interest rates will return to normal levels after some crisis has passed. That means long-term Treasury yields will be only moderately responsive to the decline in short-term rates; the longer the maturity, the less responsive they will be. Conventional monetary policy targeting the short-term rate can be used to shift the entire term structure of Treasury yields down (or up), but the relative insensitivity of distant expectations makes it difficult for the monetary authority to achieve a substantial decline in the long-term rate. If the short-term rate has reached the zero bound, that may effectively set a floor for the long-term rate when active policy is restricted to the short end of the maturity spectrum.
The second consequence of uncertainty also contributes to establishing a floor to the long-term rate because of positive “term premiums” that attach to long-term rates. The premium is the difference between the actual long-term rate and the rate based on the expected course of short-term rates over the long period. A premium is required to tempt investors with a short-term maturity preference, their “maturity habitat,” to hold a risky position in long-term bonds (Modigliani and Sutch Reference Modigliani and Sutch1966). Keynes described these amounts as “a sort of insurance premium to offset the risk of illiquidity” (GT, p. 202). Temptation is necessary because the market is not “supplied with securities of different types and maturities in the proportions in which it prefers them” (Keynes Reference Keynes1932, p. 415). According to this logic, in the 1930s there were too many long-term bonds relative to the market’s preferred maturity habitats. The premium on the long bonds would then be positive. For this reason, Keynes was keen to advocate the purchase of long-term securities by the Federal Reserve to help correct the imbalance, reduce the long-term premium, and lower the long-term rate.
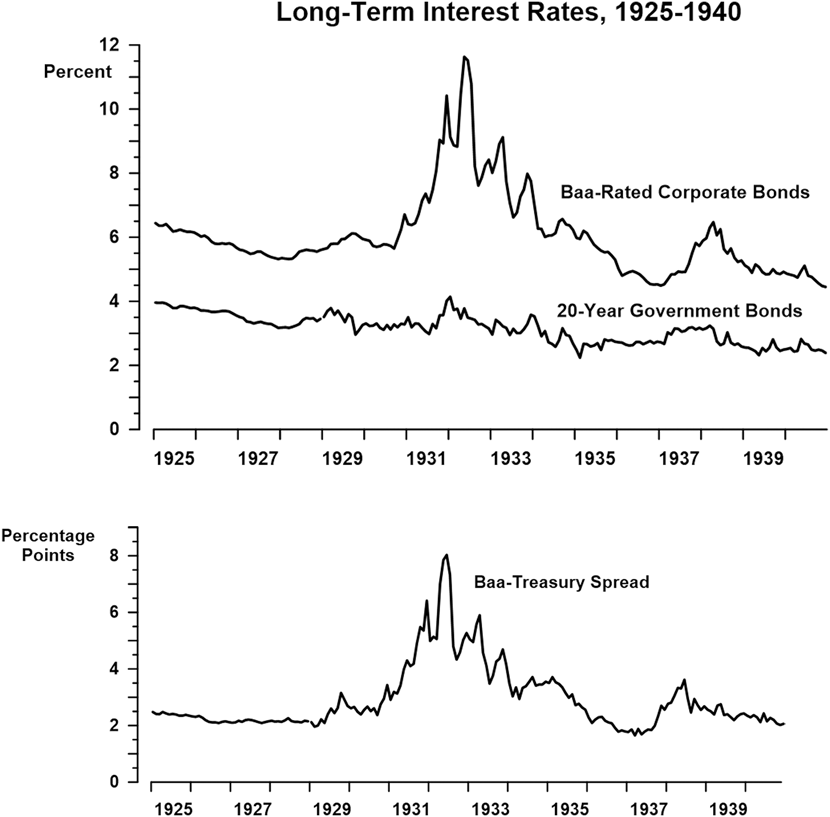
Because of the uncertainty about the future of interest rates and the surfeit of long-term securities, conventional monetary policy would find it increasingly difficult to bring the long rate below some limit. That limit Keynes guessed was at about 2% or 2.5% on long-term government bonds during the Depression (GT, pp. 218–219 and 309). The US twenty-year rate fell below 2.5% only briefly. That was in 1935 when it bottomed out at 2.24% in February. The twenty-year Treasury rate is charted in the top panel of Figure 3. It never fell below 2% during the long course of the Depression.
Long-term interest rates over the course of the Great Depression. The bottom chart graphs the difference, or “spread,” between the corporate bond rate and the government bond rate. The spread is a measure of Keynes’s “lender’s risk.” See the section at the end of this article for the sources of the data.

Lender’s Risk and Default Premiums
The inflexibility of the term structure is relevant for all debt instruments, including the Treasury’s. The yield on a long-term obligation of the US government, however, is free of Keynes’s second impediment to an aggressive monetary policy, the risk of default; a Treasury security is considered to be “default free.” All other borrowers are not free of what Keynes called “lender’s risk” (GT, pp. 144–145). Moreover, he argued, the risk borne by lenders can grow to be quite large during a stubborn depression and send borrowing rates to prohibitive levels.
The interest rate relevant to investment plans, the R in Figure 1, is not the long-term Treasury yield. The relevant rate is the one charged on a bank loan or obtainable in the corporate bond market.Footnote 19 Different borrowers will be charged different rates of interest, depending upon the apparent risk of default by the borrower and the strength of the collateral offered. The resulting gap between the Treasury yield and the borrowing rate charged to would-be investors is commonly known as a “default premium.” R is the sum of an expectations component that depends upon the market’s anticipated path of short-term rates into the future ( $r_{path}^e $), the term premium (p t) arising from the excess of long-term securities in the market, and the additional default premium (p d). The default premium is defined by the difference between the Treasury yield (T) and the borrowing rate, so:
 $$R = r_{path}^e + p^t + p^d = T + p^d $$
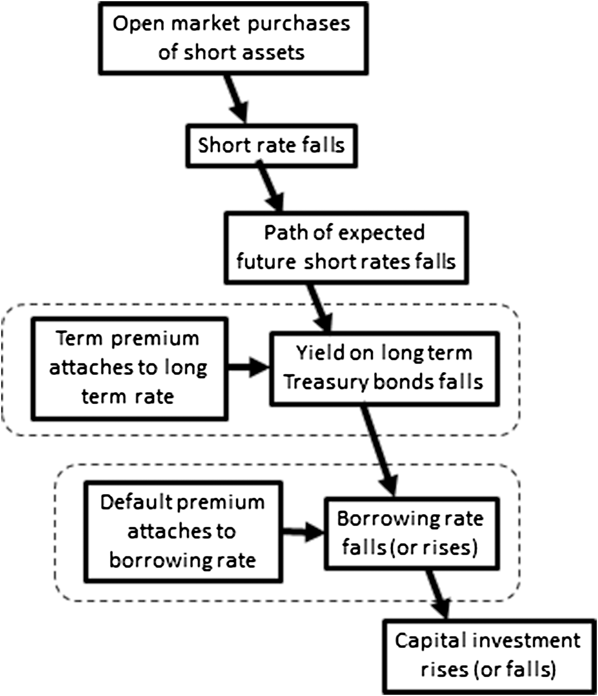
This equation helps to clarify the transmission mechanism diagramed in Figure 4. Open-market purchases of short-term bills will lower their rate of return. That will influence expectations about the future path of the short rate and thus (given the term premium) the long-term Treasury yield (T) will fall. The size of the default premium attaching to each potential borrower will determine the investor’s relevant borrowing rate (R). If the default premium was increasing as r was being reduced (as was the case during the downturn), the reduction in T might be overwhelmed and R could perversely rise—aggravating the slump in investment spending. This happened in 1931. If monetary policy were constrained to operate only on the short rate, once r fell to zero, R would reach its lowest possible level under depressed conditions, possibly at a level higher than before the collapse of investment.
A schematic of the transmission mechanism of traditional open market operations on the flow of capital investment.

As stated earlier, different borrowers will pay different rates of interest, depending upon their apparent default risks. By definition the credit worthiness of an average borrower is less than that of a prime borrower or an Aaa-rated corporation. For the 1920s and 1930s in the United States, it seems reasonable to use the rate charged by banks for middling loans or, as I do here, the yield on Baa-rated corporate bonds as a measure of the interest rate relevant to representative investment decisions (Gordon and Veitch Reference Gordon, Veitch and Gordon1986, p. 289). The top panel of Figure 3 includes the time path of the Baa rate for the period from 1925 through 1940. The bottom panel plots the difference, or “spread,” between the Baa rate and the Treasury rate.Footnote 20 The explosion of lender’s risk during the contraction phase of the Depression can be clearly seen.
Despite the fact that the default-free rate (twenty-year government bonds) held relatively stable between 1929 and late 1931, the rate of interest relevant to typical entrepreneurs began to rise noticeably in early 1929 and rose very rapidly after the first banking crisis in October and November 1930. This is not surprising since bankruptcies and the number of unprofitable corporations rose dramatically during this period. Surely, the perceived risk in lending to a Baa-rated corporation increased as the economy plunged into depression. Note that in 1932 after the short rate had reached zero, the relevant borrowing rate, presumably at its current floor, was over 8% and considerably above its pre-crash level near 6%. The economy was in a full-spectrum liquidity trap.
The premium charged over and above the Treasury yield compensates the lender for assuming the risk associated with the character and collateral of the borrower and the likelihood that the investment will bear fruit. It is worth quoting at length what Keynes had to say about lender’s risk.
Two types of risk affect the volume of investment which have not commonly been distinguished, but which it is important to distinguish. The first is the entrepreneur’s or borrower’s risk and arises out of doubts in his own mind as to the probability of his actually earning the prospective yield for which he hopes. If a man is venturing his own money, this is the only risk which is relevant.
But where a system of borrowing and lending exists, by which I mean the granting of loans with a margin of real or personal security, a second type of risk is relevant which we may call the lender’s risk. This may be due either to moral hazard, i.e. voluntary default or other means of escape, possibly lawful, from the fulfillment of the obligation, or to the possible insufficiency of the margin of security, i.e. involuntary default due to the disappointment of expectation. ...
Now the first type of risk is, in a sense, a real social cost.… The second, however, is a pure addition to the cost of investment which would not exist if the borrower and lender were the same person. Moreover, it involves in part a duplication of a proportion of the entrepreneur’s risk, which is added twice to the pure rate of interest to give the minimum prospective yield which will induce the investment. (GT, pp. 144–145; emphasis in the original)
I interpret this passage in the following way. The “pure rate of interest” is what I call the “default-free rate of interest,” and I measure it by the yield on twenty-year government bonds in Figure 3. The “borrower’s risk” is associated with the project, is assessed by the entrepreneur, and is reflected in the risk-adjusted expected rate of return on a potential investment project, its MEC. In terms of Figure 1, an increase in borrower’s risk caused by entrepreneurs’ increased uncertainty about the future would cause the investment demand curve to shift downward. This is the collapse that is the crux of a Keynesian depression.
Keynes’s statement that a proportion of the lender’s risk represents a duplication of the borrower’s risk means that whenever the demand schedule for new capital falls, the default premiums charged by lenders would rise by at least as much. Thus, if the monetary authorities were to hold the long-term rate of interest on government bonds constant while the investment schedule shifted down, the Baa-rated bond rate would simultaneously rise. The volume of investment spending would fall for two reasons: first, because entrepreneurs were less optimistic about the future profitability of prospective investments (a downward shift in MEC); and, second, because lenders will demand a higher return since they share the borrowers’ heightened doubts about the future. There would be a movement upward to the left along the depressed MEC curve induced by an increase in R.
Keynes’s logic suggests using the rise in the Baa-Treasury spread as a crude index of the shift in the demand for investment. Whenever the MEC shifts down because of an increase in borrower’s risk, the Baa-Treasury spread should rise. Examination of Figure 3 suggests, on these grounds, that the fall in the investment schedule began in February of 1929, eight months before the stock market crash in October. The day after the stock market crash of 1929, “Black Thursday,” Keynes wrote to the New York Evening Post predicting a “bad winter of unemployment,” blaming “the dear money which prevailed during the summer and early autumn.” Critics of this view will be quick to note that the magnitude of the rise in the spread during this period was not very impressive. But Keynes noted that “the world always underestimates the influence of dear money as a depressing influence” (Keynes 1929, pp. 2–3). The Baa-Treasury spread begins rising rapidly after the first wave of bank failures in November 1930. Thereafter, matters deteriorated greatly. June of 1931 saw another run on banks, even as Keynes was advocating the use of monetary policy in Chicago. A much larger wave of bank failures came in August, September, and October of 1931. By then the American economy was in full decline.
Bank suspensions, apart from their impact on the demand for money and its supply, were harmful in two ways.Footnote 21 They had a direct effect on those who would seek to borrow from a banker with whom they had a close and trusting relationship only to find their customary lines of credit terminated when the bank abruptly closed. Establishing new banking connections would be costly and would result in a reduced quality of the credit intermediation (Bernanke Reference Bernanke1983, pp. 263–268). The bank failures also raised widespread doubts about the stability of the banking system. Banks that suspended business were in trouble, not because their past loans were bad, but because they lacked liquidity (Postel-Viney Reference Postel-Vinay2016). The uncertainty and fear for the future caused borrowers to reconsider their plans and lenders to become more cautious. It is not surprising, then, that default premiums measured by the Baa-Treasury spread rose to seven percentage points.
To offset a decline in the marginal efficiency of capital, the government long-term rate would have to be brought down by twice as many interest points as the fall in the prospective rates of return on potential capital projects. In other words, if entrepreneurs felt the MEC had fallen by one percentage point, the Treasury bond rate would have to be reduced by two percentage points in order to prevent a decline in investment. Monetary policy would have to work twice as hard to stop a recession as to start one.
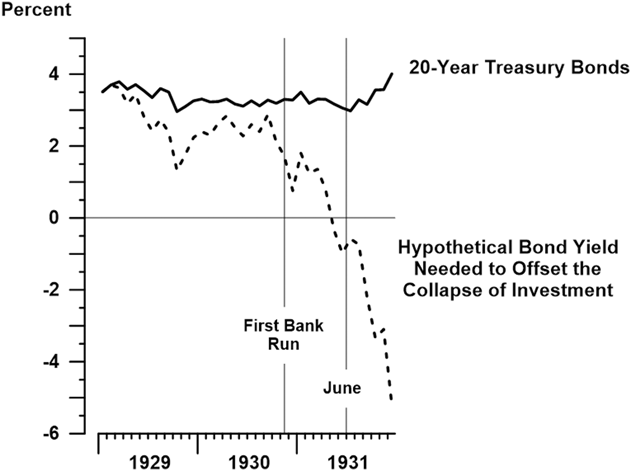
As a counterfactual exercise, I have calculated what the yield on US Treasury bonds would have had to have been to offset the fall in the investment schedule. I begin this conjectural calculation in March of 1929 and assume that the rise in the Baa-Treasury spread provides an exact instantaneous measure of the vertical fall in the marginal efficiency of capital. The hypothetical bond yield is compared with the actual yield in Figure 5. In the initial phase of the Great Depression, before the first bank run, the analysis suggests that a modest fall in bond yields would have done the trick. Thereafter, however, significant declines would have been required. If I take the month of June 1931, when Keynes was in Chicago, as a noteworthy date, I can say on the basis of Figure 5, first, that monetary policy had yet to be applied in sufficient force to bring down the long-term default-free rate of interest (the “pure” rate), and, second, that an effective monetary policy would have required a fall in the bond yield from the prevailing level to negative numbers. If negative nominal yields are deemed impossible, then Keynes was whistling in the Windy City when he advocated monetary policy during his Chicago lectures. By mid-1931 monetary policy, even though it had yet to be effectively pursued, was facing a depression too large for it to handle.
A simulation of the Treasury bond yield required to end the Great Depression suggested by Keynes’s discussion of lender’s risk. See text.

Absolute Liquidity Preference
“Liquidity-preference,” Keynes’s preferred term for the demand for money, refers to the public’s desire to hold cash and bank deposits. Keynes theorized that this demand had two components. One was the classical demand for money to satisfy transactions and precautionary requirements; in addition there could arise a demand for money to satisfy a “speculative motive.” The first component, which Keynes labeled L 1 and which responded primarily to the level of income, would be relatively insensitive to the level of, or changes in, the rate of interest. The speculative demand, L 2, on the other hand, would depend upon the current rate of long-term interest and uncertain expectations about the future of that rate. Recall that Keynes believed there were more assets with a long-dated maturity in the market than the public would prefer to hold. Some investors who would normally feel safer holding wealth for the short term would need to be lured out of their short-maturity habitats to hold long bonds. Those investors would, in Keynes’s terms, be speculating since the future of long-term rates is uncertain and their holdings would be at risk (GT, pp. 166–172 and 194–204).
This induced speculation has two consequences of note. First, Keynes suggested, the term premiums attaching to the long rate would rise as the economy fell into a deep depression. “The dismay and uncertainty as to the future” would cause some speculators to sell long assets and flee to safety, filling their portfolios with cash or short-term assets; that is, they would demand more liquidity. Second, this increase in L 2 would drive down long-term bond prices and increase their yields (GT, p. 316). Keynes advocated the purchase of long bonds to remove them from the market. The object was to prevent the rise in long-term rates that would otherwise aggravate the decline in investment.
Keynes, of course, wanted bond purchases to go beyond this point in order to lower bond yields further. However, there was a danger lurking: the fear of capital loss might become acute if interest rates were driven far below normal, and for two reasons. First, the lower the rate of interest, the more likely imminent capital losses would seem. Second, when long-term rates are low, the volatility of bond prices will be greater than when long-term rates are at their normal level. Small changes in percentage points of interest—apparently equally probable in the eyes of the investor whether rates are high or low—will produce larger changes in bond prices when rates are low. A rise from 2% to 2½% would produce a 20% decline in long-term bond prices, while an equal increase from 10% to 10½% would generate only a 4.8% capital loss. “Unless reasons are believed to exist why future experience will be very different from past experience, a long-term rate of interest of (say) 2 per cent leaves more to fear than to hope” (GT, p. 202). Liquidity preference could become “virtually absolute” if a large proportion of the public became convinced that no financial asset appeared that offered a positive rate of return over the short term (GT, p. 207). To avoid this explosion of the demand for money, Keynes suggested that aggressive bond purchases and reductions in the long-term rate should be a second act, “the second wave of attack on the slump after the tide has been turned by the expenditures of public authority” (Keynes Reference Keynes1933; also GT, p. 316).
The proposition that investors will attempt to sell long-term assets when their price is expected to fall seems sensible, but the funds they receive in exchange would be better invested in short-term government assets than in cash. Short-term bills, for example, present no risk of capital loss if they are held to maturity. A flight from long-term to short-term assets will drive the short-term rate lower, but as long as that rate is above zero, short-term assets should dominate cash. So the speculative demand for cash cannot become absolute until the rate of interest on short-term assets is zero. Yet, Keynes was worried that even after reaching a zero short-term rate of interest, the flight from long-term assets could continue. In that case the money created to purchase and retire bonds would simply be absorbed in speculative holdings of cash. A continuing and unlimited policy of purchasing long bonds would no longer have an impact on interest rates. “The least easily shifted element in our contemporary economy … may prove in the future [to be] the minimum rate of interest acceptable to the generality of wealth owners” (GT, p. 309).
Whatever the theoretical merits of the absolute liquidity preference argument, Keynes did not think this ultimate nail in the coffin of monetary policy had been hammered in at the time he was writing the General Theory. “I know of no example of (absolute liquidity preference) hitherto. Indeed, owing to the unwillingness of most monetary authorities to deal boldly in debts of long term, there has not been much opportunity for a test” (GT, p. 207).
IX. KEYNES’S MONETARY PRESCRIPTION: “LOW-FOR-LONG” AND QUANTITATIVE EASING
The short rate had fallen to five-one-hundredth of one percent in November of 1932 and was stuck there at essentially zero. The ZLB trap had been reached and, because of the Fed’s unwillingness to deal boldly in debts of long term, the full-spectrum trap had also been reached. However, the demand for money had not yet become absolute. Keynes was doubtful, even pessimistic, yet he continued to propose in the General Theory an aggressive monetary policy. By then the contraction had been checked. The tide had turned. But, since he thought the recovery was destined to be protracted, it was time for the second act.
While open-market purchases of short-term assets would be ineffective at the ZLB, the central bank could hope to lower the long-term borrowing rate. Considering the links in the transmission chain pictured in Figure 4, Keynes saw three possible points of leverage. First was the link between the short-term rate and the path of expected future short rates. Keynes reasoned that expectations could be guided by policy because the prevailing public view of the future “is not rooted in secure knowledge.” Therefore, “persistence and consistency of purpose by the monetary authority” might modify the conventional expectation (GT, p. 204). A policy of low interest rates should be accompanied by a credible commitment to maintaining the long-term rate at low levels for a long time—as long as it takes (Woodford Reference Woodford2012, p. 3). “It might be sufficient merely to produce a general belief in the long continuance of a very low rate of short-term interest” (Keynes 1930, 2, p. 346). Credibility, of course, is the key: “A monetary policy which strikes public opinion as being experimental in character or easily liable to change may fail in its objective of greatly reducing the long-term rate of interest” (GT, p. 203). “Low-for-long” is the current moniker for this dictum.Footnote 22
The second point of attack would be to lower the term premiums that attach to the long-term rate. These premiums arise because there are more long-term assets in the market than the public desires. Reducing the supply would then lower term premiums and along with them the long-term Treasury rate. To this end Keynes advocated the purchase of bonds. Indeed, an “offer by the central bank to buy and sell at stated prices gilt-edged bonds of all maturities, in place of the single bank rate for short-term bills, is the most important practical improvement which can be made in the technique of monetary management” (GT, p. 206). This is quantitative easing pure and simple.Footnote 23
The third potential opening for monetary policy would focus on the default premium and the role of public confidence. Keynes worried there would be a difficult obstacle to be faced even if low-for-long interest rates and quantitative easing were working to lower the yield on long-dated Treasury bonds. The soaring and persistently high level of default premiums might overwhelm unconventional monetary policy. The loss of business confidence, the frequent experience of negative profits, and the increase in bankruptcies create the problem of “bringing the borrower and the ultimate lender together.” The lender would demand an allowance for risk. Stating his view in 1936, Keynes insisted that “it is not so easy to revive the marginal efficiency of capital, determined, as it is, by the uncontrollable and disobedient psychology of the business world.” Only “a return of confidence … which is so insusceptible to control” would shift the marginal efficiency of capital schedule upward (GT, pp. 316–317). In the General Theory Keynes offered no clear policy to inspire public confidence. In his private papers and political activities, however, it is clear that he gave this issue a great deal of thought. Writing in January 1935 to a former member of parliament from the Labour Party, he stated that before his policy suggestions could be translated into practice, they had “to be mixed with politics and passions.” He urged the adoption of a “reformist,” rather than a “revolutionary policy,” to alter public opinion.Footnote 24 In his letter to Roosevelt in 1933, Keynes suggested that a policy to stabilize exchange rates would improve confidence. But the essential point he emphasized was “the necessity of a profound change of methods.” He applauded the new president for promoting change “without intolerance, tyranny or destruction” and without an ideological commitment “to the details of a particular technique.” He advocated continued “energy and enthusiasm” and a healthy dose of public expenditures “to start the ball rolling.” The US was ready, he thought, “to roll towards prosperity, if a good hard shove can be given in the next six months.” The recovery, once it began, would then become a “comfort to men’s minds through a restoration of their faith in the wisdom and the power of Government!” (Keynes Reference Keynes1933). It is apparent Keynes thought the New Deal would be a boost to confidence (Dimand Reference Dimand2015, p. 23).
Low-for-Long, 1934–1940
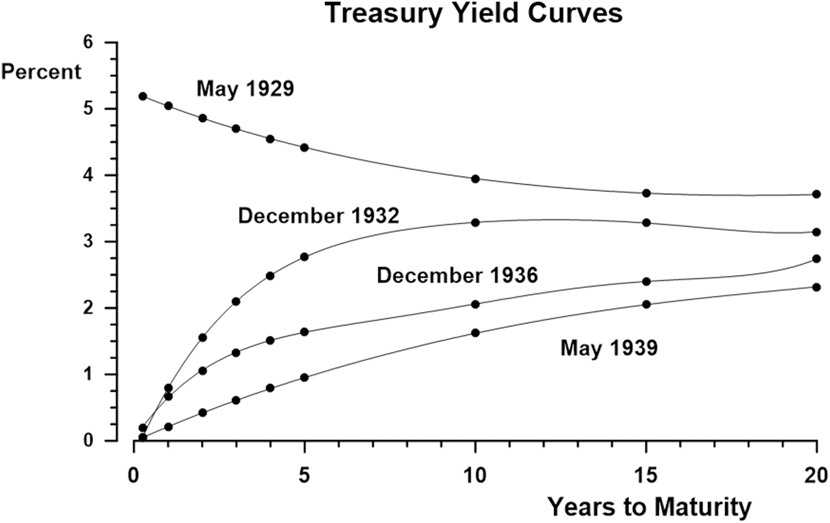
Keynes advocated a steadfast and public commitment by the monetary authority to keep interest rates low for a very long time, permanently low, if necessary. The idea was to influence expectations about the future of short rates and thus lower the expectations component of the long rate. During the Fed’s recent effort to escape the liquidity trap during the Great Recession, a policy that mimicked Keynes’s proposal was named “forward guidance,” an explicit commitment to keep the target for short-term rates near zero into the indefinite future.Footnote 25 During the ZLB period of the Great Depression, by contrast, the Federal Reserve made no attempt to influence expectations about the future course of interest rates. With the Fed inactive and making no promises, any impact on expectations would have to come from the demonstration effect of persistently low short-term rates. It is possible to infer something about the impact of this protracted spell of near-zero rates by examining the shape of the Treasury “yield curve”—a graph of the yields on each US Treasury security plotted against its own term to maturity.
Figure 6 displays the Treasury yield curve at four selected dates. Each long-term rate has two elements, the pure expectations component and a term premium sufficient to entice the marginal investor to hold a bond of that maturity despite their lack of short-term liquidity. Term premiums on long-term assets were positive throughout the interwar period, thus the yield curve usually rose with maturity. On occasion, however, the curve is seen to slope downward. This was the case, for example, in May 1929 when the three-month rate was 5.19% and the twenty-year yield was 3.71%. Short-term rates on that date were abnormally high. The three-month rate had reached a peak in May 1929 after a significant increase over the course of 1928 and the first five months of 1929 from the more normal range of 3% to 3.5%. The Federal Reserve had intentionally driven the short rate to these heights in their campaign against stock market speculation, a move, incidentally, that Keynes opposed (Keynes Reference Keynes and Moggridge1928; Meltzer Reference Meltzer2003, pp. 227–235). Because the run-up in short rates was dramatic, policy-induced, and recent, the market expected those rates to fall back to more normal levels in the future. Long-term rates were lower than the short-term rate since they embodied this long-term expectation of a return to moderate levels.
The yield curve for securities issued by the Treasury Department, four dates. Source: Cecchetti (Reference Cecchetti1988, Appendix).

The second yield curve charted in Figure 6 is for December 1932—immediately after the zero bound for short rates had been reached. Even though the three-month rate was a miniscule 0.05%, long rates had fallen by only 0.5 percentage points. This underscores Keynes’s view that long rates would not easily or rapidly be shifted downward. Apparently the market’s expectation at that point was that the liquidity crisis of late 1932 was temporary and short-term rates would soon rise. But that did not happen. Instead, the short rate was held at the ZLB for the next four years. By October 1936 the long rate had fallen from its 1929 level by nearly a full percentage point from 3.71% to 2.76%. This suggests that a persistently low short rate could lower near-term expectations and thus have an effect on the longer rates. Indeed, an additional three years of low short-term rates brought the long rates down by another half point by May 1939. Low-for-long might said to be working to lower expectations, but working slowly.
Backdoor Quantitative Easing, 1934–1939
Perhaps because of the zero lower bound, the Federal Reserve took few active monetary actions from 1933 to 1936. While it is true the monetary base grew from April 1934 to December 1936, this growth was engineered by the Treasury, not the Fed. The rise in the base was produced when gold flowing in from abroad and new production from domestic mines was purchased by the Treasury, which then dutifully created gold certificates backed by the gold and then deposited the certificates in one of its accounts in a commercial bank or at the Federal Reserve (Hanes Reference Hanes2006, p. 177). Richard Anderson suggests this increase in the monetary base is similar to today’s QE policies in its effect on the banks’ balance sheets (2010). This “backdoor” version of QE was achieved without the help of the Fed and without retiring long-term assets.
Keynes would have argued, I think, that this would be of only modest help and only if it worked indirectly to lower the critical long-term rate of interest. In fact, much of the monetary increase went straight into bank reserves; they increased more than 70% in this period. Commercial banks did, however, spend a portion of the injection to increase their portfolios of long-term government securities. Holdings of US government notes, bonds, and guaranteed securities by banks that were members of the Federal Reserve System rose from $7.3 billion in March 1934 to $12.5 billion at the end of 1936. The share of privately held government securities owned by member banks rose from 34.6% from 1931 to 1933 to 42.1% from 1934 to 1936. The heightened demand for bonds in the absence of any substantial increase in their supply helped to raise their price. The rate on twenty-year government bonds fell about 10% from 2.91% in March 1934 to 2.69% in November of 1936; not a startling change and perhaps one that owed more to revised expectations about future interest rates than to the banking system’s purchases of government securities. If so, this experience gives credence to the power of a sustained period of near-zero short rates to reduce the slope of the Treasury yield curve. Of greater significance for the economic recovery was that the default premium declined as the investment picture brightened (Figure 3).
In mid-1936 the ongoing expansion was augmented by a significant fiscal stimulus. Congress—overriding Roosevelt’s veto—authorized a deficit-financed veterans’ bonus of $1.8 billion payable beginning June 15.Footnote 26 Over $1.1 billion of the bonds issued to vets were cashed by the end of July. The typical veteran received $550, “more than annual per capita income, and enough money to buy a new car.” Joshua Hausman calculated the bonus added 2.5 to 3 percentage points to 1936 GDP growth (2016).
The recovery was not sustained. A severe drought afflicting the Corn Belt sent agricultural prices rising in mid-1936.Footnote 27 By August the wholesale price of corn in Chicago had doubled since the beginning of the year. The producer price index, which had been steady at 86.0 from November 1935 through June 1936, took a baby step up to 86.6 in July. At this point the monetary authorities panicked, confidence was shaken, and default premiums rose. It was not so much the measured inflation that frightened the Fed, but the fear of inflation. Sumner Slichter claimed the Federal Reserve confronted a dilemma: “Had they failed to act, inflationary fears would have been stimulated by their inaction. When they did act, the fear of price rises was stimulated by the very fact that the monetary authorities were taking cognizance of the danger” (Slichter Reference Slichter1938, p. 98).
The Fed did act. It raised reserve requirements. At the time, this was an extraordinary action. Legal reserve requirements at Federal Reserve banks had remained unchanged since 1917. But during the depression, banks became so reluctant to lend or hold long-term securities, they amassed considerably more reserves than were required. The first increase in requirements came in August 1936. Reserve requirements were raised again in March 1937, and after a third increase in May they had been doubled across the board.
The board’s visible concern about its ability to control inflation (should it come) and the Fed’s expressed conviction that the hikes in the reserve requirement would have no effect on banks’ ability to lend apparently convinced many bondholders that the Fed must soon act to increase interest rates and bring about a depreciation in asset prices and result in capital losses (Eggertsson and Pugsley Reference Eggertsson and Pugsley2006; Calomiris, Mason, and Wheelock Reference Calomiris, Mason and Wheelock2011; and Park and Van Horn 2015). The public, including the commercial banks, sought to flee long-term securities, but since the Fed wasn’t buying, total public holdings could not be reduced and bond prices tumbled (Stauffer Reference Stauffer2002, p. 170). The fear that rates would rise became a self-fulfilling prophesy. Treasury bond yields obligingly rose and by March of 1938 they exceeded the level of March 1934, wiping out all of the improvement in long-term rates achieved from 1934 to 1936.
The economy, which had been recovering well since March 1933, fell into a recession in early spring of 1937. Business confidence took a great plunge, which is indicated in Figure 3 by a sharp rise in the Baa-Treasury spread. Keynes was right to think long-term rates and business confidence were the keys to investment demand. The index of floor space for new construction fell dramatically and the index of machinery production followed it down. The economy stopped growing early in 1937, began to decline in the spring of 1937, and collapsed in the autumn of 1937.
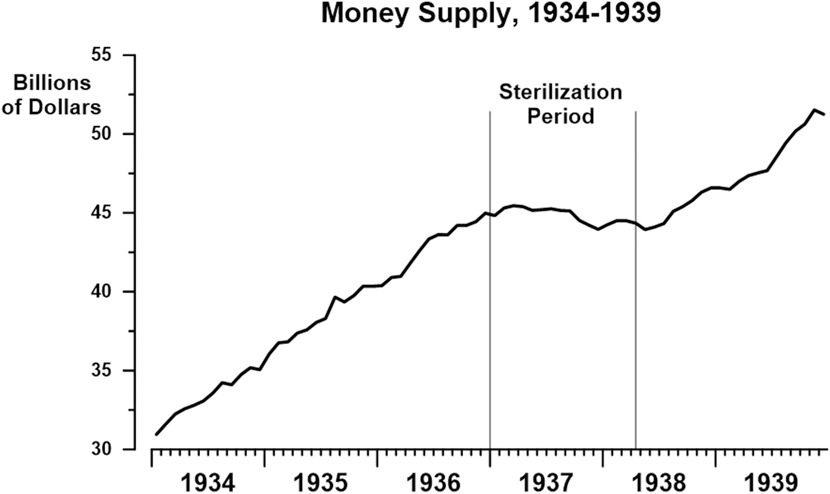
The Federal Reserve was not the only contributor to the downturn. In December of 1936 the Treasury, in an attempt to support the Fed’s campaign against excess reserves, abandoned its policy of monetizing gold inflows and thus abruptly halted the rise in the monetary base. By “sterilizing” gold inflows, bank reserves would not inflate (Meltzer Reference Meltzer2003, pp. 503–507). Douglas Irwin has estimated that “as much as a 10 percent increase in the monetary base in 1937 was prevented as a consequence of the program” (Irwin Reference Irwin2012, p. 251). Franklin Roosevelt’s election-year decision to adopt more orthodox fiscal policies and to move the budget toward balance has also been seen as an error that contributed to the economic reversal (Brown 1956; Romer 2009; Krugman Reference Krugman2010).
In February 1938, having realized its error, the Treasury ended its sterilization policy. In April 1938 it began monetizing its inactive gold holdings, the gold it had previously sterilized, at the Fed’s request. The Treasury’s substitute for QE was back in play. The money supply resumed its growth; see Figure 7. However, member banks did not significantly increase their holdings of government securities in this second phase of backdoor QE, so the indirect balance-sheet channel was no longer working to lower interest rates. Nevertheless, long-term rates retreated and the Baa-Treasury spread shrank as business confidence improved. In June 1938 the economy resumed its interrupted recovery. The reductions of long-term borrowing rates in this period would be accounted for in Keynes’s model by the reduction in the expectations component of long rates, which I credit to the fact short-term rates were kept at the zero lower bound for the entire period, and the reduction in default premiums, which I credit to improving lender confidence.
The supply of money (currency held by the public plus demand deposits at commercial banks) over the course of the Great Depression. The impact of the Treasury’s temporarily halt in the monetization of gold inflows is clearly seen. Source: Estimates by Friedman and Schwartz (Reference Friedman and Schwartz1963) as reported in Carter et al. (Reference Carter, Sigmund Gartner, Haines, Olmstead, Sutch and Wright2006, Series Cb64).

It is difficult to know what to make of the backdoor easing. The Treasury’s monetization of gold inflows during 1933 to 1936 apparently was assisting the economic recovery of those years through an impact on long-term rates. But Roosevelt’s “profound change of methods,” his “energy and enthusiasm,” and the public expenditures required for the veterans’ bonus added a dramatic “hard shove” in the same direction. When the monetary expansion was abruptly halted by Treasury’s sterilization policy, the economy plunged back into serious decline five months later. Employment fell 21% between May 1937 and June 1938. New investment in plant and equipment plummeted. But, the sterilization coincided with the rise in long-term rates, the doubling of the reserve requirements, and Roosevelt’s election-year pivot to budget balance. A statistical project designed to tease out the separate impact of those policy setbacks is impossible without a clear understanding of fragility of business confidence and the mechanisms that produce hair-trigger instability (Akerlof and Schiller [Reference Akerlof and Shiller2009] 2010, p. xii). The economic collapse of 1937 underscores Keynes’s concern that any adverse event could trigger a catastrophic reversal.
Enterprise only pretends to itself to be mainly actuated by the statements in its own prospectus. … If the animal spirits are dimmed and the spontaneous optimism falters, leaving us to depend on nothing but a mathematical expectation, enterprise will fail and die;—though fears of loss may have a basis no more reasonable than hopes of profit had before. (GT, pp. 161–162; emphasis added)
Not quite a controlled experiment, the 1937–38 recession nevertheless hints that (1) Keynes was right about the role of animal spirits; and that (2) a suitable combination of quantitative easing, sustained low short-term interest rates, and significant deficit spending can promote recovery. It leaves unanswered what the optimal mix of the three might be.
X. SUMMARY AND CONCLUSION
Since the crisis in 2008 economists and financial journalists have pointed to the parallels between the Great Depression and the Great Recession. This review has pointed to the parallels between John Maynard Keynes’s analysis of the Great Depression and the rationale behind recent policies directed at recovering from the Great Recession. I have highlighted three similarities: the downturn initiated by a collapse of demand for new fixed investment, the role of the zero lower bound liquidity trap in hampering conventional monetary policy, and the stimulating effect of a multi-year period of near-zero short-term interest rates. A major difference between then and now is that in the current situation, the monetary authorities actively pursued large-scale purchases of long-term government securities and mortgage-backed assets. This is the primary monetary policy Keynes advocated for a depressed economy at the zero lower bound. Keynes was unable to persuade US authorities to pursue such a policy, and it is unclear whether the backdoor version of quantitative easing engineered by the Treasury was an adequate substitute.
While the current monetary activism is to be welcomed, unconventional policies then and now appear to be slow acting. In both regimes recovery came only after multiple painful years during which uncertainty damped optimism. Improvement came only after many lives were seriously marred by unemployment and many businesses experienced or were threatened with bankruptcy.
Economists are notoriously poor forecasters and Keynes is not excepted from this generalization,Footnote 28 but at least on this concluding point he was remarkably prescient. While other experts were predicting immediate and rapid recovery,Footnote 29 Keynes opened his series of Chicago lectures in June of 1931 expressing the fear that, just possibly,
when this crisis is looked back upon by the economic historian of the future it will be seen to mark one of the major turning-points. For it is a possibility that the duration of the slump may be much more prolonged than most people are expecting and that much will be changed, both in our ideas and in our methods, before we emerge. Not, of course, the duration of the acute phase of the slump, but that of the long, dragging conditions of semi-slump, or at least subnormal prosperity which may be expected to succeed the acute phase. (Keynes [Reference Keynes, Wright and Moggridge1931a] 1970, p. 344)