

Our favourite toy and the promise of democracy
Inequality is in vogue. Since the turn of the century, much comparative politics scholarship has explored whether and how income inequality affects the prospects of democratization (Acemoglu and Robinson Reference Acemoglu and Robinson2006; Ansell and Samuels Reference Ansell and Samuels2010, Reference Ansell and Samuels2014; Boix Reference Boix2003; Freeman and Quinn Reference Freeman and Quinn2012; Haggard and Kaufman Reference Haggard and Kaufman2012, Reference Haggard and Kaufman2016; Houle Reference Houle2009, Reference Houle2016; Teorell Reference Teorell2010) and, to a lesser extent, whether democracy reduces income inequality. Any work on inequality and regime type invariably mentions political economists’ ‘favourite toy’ (Przeworski Reference Przeworski2010: 85) – the Meltzer–Richard median voter model (Meltzer and Richard Reference Meltzer and Richard1981). Stripped to its barest form, the model states that a government's tax rate decision depends on the position of the median voter on the income distribution. Since income distributions are right-skewed, the median voter will prefer a higher tax rate on the wealthy in anticipation of redistributive benefits under democracy.Footnote 1
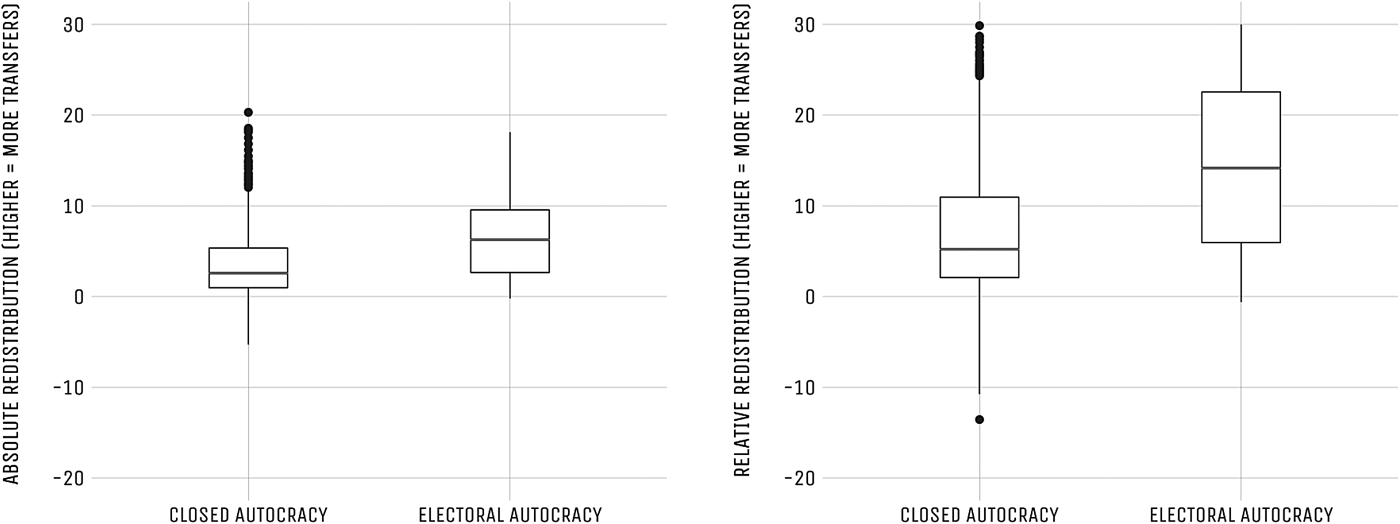
Unfortunately, a recent body of mounting evidence has dashed the hopes that economic equality will follow political equality (Albertus Reference Albertus2015; Piketty Reference Piketty2014). Put simply, there is no empirical relationship between democracy and the level of income inequality (Acemoglu et al. Reference Acemoglu, Naidu, Restrepo, Robinson, Atkinson and Bourguinon2015; Timmons Reference Timmons2010). What is more, democracies do not seem to be any more likely to redistribute income compared to autocracies, even at high levels of inequality (Iversen and Soskice Reference Iversen and Soskice2009; Morrison Reference Morrison2009; Scheve and Stasavage Reference Scheve and Stasavage2012; Slater et al. Reference Slater, Smith and Nair2014).Footnote 2 Using Frederick Solt's (Reference Solt2016) measure of absolute and relative redistribution, Figure 1 shows that while median levels of absolute redistribution are higher in democracies, median levels of relative redistribution – which take into account pre-tax/pre-transfers levels of inequality (or market Gini) – are higher in autocracies.
Relative Redistribution is Higher under Authoritarian Rule
Sources: Inequality measures from Solt (Reference Solt2016); regime type variable from the Varieties of Democracy Project, version 7.1 (2017).
Notes: Democracy includes electoral and liberal democracies; autocracy includes electoral and closed autocracies. Absolute redistribution is the difference between market and net Gini. Relative redistribution is calculated by dividing absolute redistribution by market Gini. Higher values indicate greater redistribution.
The grey line indicates the median (or 50th percentile) value; the dots indicate outliers whose values are either: (1) less than the 25th percentile value minus 1.5 × the inter-quartile range (IQR), or (2) more than the 75th percentile value plus 1.5 × IQR. The IQR is the difference between the 75th and 25th percentile values.

Given the pivotal role that income inequality plays in influential theories of democratization, the relative dearth of work on the variation in income inequality under authoritarian rule is a curious gap in the literature. I argue that the current emphasis on democratic inequality paints an incomplete picture of how authoritarian institutions affect the extent of inequality, and the subsequent effects of inequality on regime stability. The legacy of authoritarian institutions and the nature and initial distribution of assets under authoritarianism have persistent and pernicious effects on political and socioeconomic outcomes well after democratization (Albertus and Menaldo Reference Albertus and Menaldo2018). Not all transitions to democracy are critical junctures (Capoccia and Kelemen Reference Capoccia and Kelemen2007).Footnote 3 Drawing from the literature on authoritarian institutions, I show that electoral competition, party ideology and party institutionalization help explain the pattern of income inequality under authoritarian rule. In particular, I examine how political competition between ruling and opposition parties under electoral authoritarianism, the effect of left leaders and the extent to which parties are institutionalized or develop long-term goals create incentives for ruling parties to lower income inequality.
Electoral authoritarian (EA) regimes allow multiple parties to compete legally in legislative elections (Levitsky and Way Reference Levitsky and Way2010; Schedler Reference Schedler2006). Electoral rules in these regimes are like shifting sands, and electoral integrity is lacking. Despite this less-than-level playing field, I argue that competition between ruling party and opposition elites and the desire to win elections generate pressures for the ruling party to redistribute, which in turn lowers income inequality. Using a panel data set of authoritarian regimes from 1960 to 2016, I find that EA regimes have lower levels of income inequality compared with non-EA regimes, a result that is robust to specifications such as fixed effects and instrumental variable regressions.
Furthermore, existing studies that examine the effects of EA regimes tend to emphasize their electoral aspects and the impact of electoral competition on outcomes (Miller Reference Miller2015). I contend, however, that the effect of competition in EA regimes on income inequality depends on: (1) leader ideology, and (2) party institutionalization. An extensive literature exists on the impact of ideology on policy preferences and outcomes in democracies, with effects contingent on voting rules (majoritarian vs. proportional representation) and the method of executive selection (presidential vs. parliamentary). While the role of ideology in authoritarian regimes is less well defined, I find that EA regimes with left leaders have lower inequality compared with non-left leaders. I further find that EA regimes with more institutionalized party systems, in which both ruling and opposition parties value long-term survival over short-term gains, have lower inequality as well.
The contribution of this article is twofold. First, it provides a first look at how authoritarian elections and parties affect the distribution of inequality, which adds to our understanding of the stability of authoritarian rule. The level of income inequality is often taken as given in existing theories of democratization, with little heed to its trajectory and attempts – successful or otherwise – to manage its rise. Second, it extends the scholarship on EA regimes and shows that the effects of authoritarian electoral competition on social and economic outcomes depend on leader ideology and the degree of party institutionalization.
The shackles of the past
Barbara Geddes’ (Reference Geddes1999) seminal work on classifying authoritarian regimes – a response to what was then a neglect of the variation across authoritarian regimes – spurred a vibrant literature that sought to explain the nature and purpose of this institutional variation. Yet in contrast to the considerable amount of work on authoritarian institutions, scholarship on inequality – and other policy outcomes more broadly – in authoritarian regimes lags behind the work on democracies. The central focus of what Thomas Pepinsky (Reference Pepinsky2014) calls the ‘institutional turn in comparative authoritarianism’ is regime durability and the resilience of authoritarian rule.Footnote 4 Yet to explain regime survival – in light of our existing theories of democratization – requires us in part to investigate how political and socioeconomic outcomes vary under authoritarianism, especially given the supposed central role that inequality plays in democratization, and the spread of nominally democratic institutions such as parties, elections, legislatures, courts and constitutions across authoritarian regimes.Footnote 5
What is more, Figure 2 shows substantial variation in the level of income inequality across authoritarian regimes. In particular, EA regimes have higher levels of absolute and relative redistribution compared with non-EA regimes. To my knowledge, only two studies directly examine how the level of income inequality varies across authoritarian regimes.Footnote 6 Mary Gallagher and Jonathan Hanson (Reference Gallagher and Hanson2009) argue that authoritarian rulers have both carrots (public good provision) and sticks (repression) to preserve their rule. The specific carrot–stick blend a ruler chooses to use depends on each regime's historical, geographic, economic, social and international context, which affect the costs of each approach, and subsequent distributional outcomes. In South Korea, Japan and Taiwan, resource scarcity and the neighbouring communist threat led rulers to forge bargains with capitalist elites and to focus on delivering growth, development and lower inequality. The Chinese Communist Party, facing a different threat configuration, walked a tightrope between growth and repression, with lower inequality in coastal provinces, and higher levels inland. Applying Guillermo O'Donnell's (Reference O'Donnell1998) concepts of horizontal and vertical accountability to the authoritarian context, Hanson (Reference Hanson2013) contends that dictators rely on institutional arrangements to juggle elite (horizontal pressures) and mass demands (vertical pressures). Policies that respond to horizontal pressures tend to increase inequality compared with those that deal with vertical pressures. Hanson (Reference Hanson2013) finds that the presence of a legislature positively increases the level of social subsidies as a proportion of government spending and is associated with lower income inequality.
Redistribution is Higher in Electoral Authoritarian Regimes
Sources: Inequality measures from Solt (Reference Solt2016); regime type variable from the Varieties of Democracy Project, version 7.1 (2017).
Notes: Absolute redistribution is the difference between market and net Gini. Relative redistribution is calculated by dividing absolute redistribution by market Gini. Higher values indicate greater redistribution.
The grey line indicates the median (or 50th percentile) value; the dots indicate outliers whose values are either: (1) less than the 25th percentile value minus 1.5 × the inter-quartile range (IQR), or (2) more than the 75th percentile value plus 1.5 × IQR. The IQR is the difference between the 75th and 25th percentile values.
The dot indicates the predicted level of income inequality and the whiskers indicate 95% confidence intervals. All control variables are held at their respective means.

Gallagher and Hanson's (Reference Gallagher and Hanson2009) short case studies of East Asia, while instructive, do not reveal broader patterns of inequality across authoritarian regimes. While Hanson (Reference Hanson2013) includes a dummy variable for communist regimes, he does not examine the effects of electoral authoritarian regimes, or the moderating impact of leader ideology and party system institutionalization on the level of inequality. In addition, his empirical approach does not account for possible endogeneity between inequality and institutions. As Jennifer Gandhi (Reference Gandhi2008) notes, rising inequality may force the regime to allow opposition parties as a way for the dissatisfied to vent their frustrations. With respect to inequality, this suggests that the causal arrow might run the opposite way (Pepinsky Reference Pepinsky2014).
Dynamics of authoritarian rule
Authoritarian politics revolve around two fundamental conflicts: control and power-sharing (Svolik Reference Svolik2012). Power-sharing is akin to a tug-of-war contest in which elites at both ends agree to pull with just enough force to keep the rope taut so that no one falls over. A dictator must be ever vigilant; he must ensure and maintain a monopoly of power with full cognizance that his ruling coalition – be it economic, ethnic, religious, military elites or some combination thereof – seeks either to curtail his power or to take his place. But constant vigilance drains vital resources, and a state of perpetual tension is inefficient.
Control presents something of a quandary. To ensure the quiescence of the masses, a dictator can either repress dissent using force, or maintain dissent at low levels using redistributive policies or co-optation, both of which involve the expenditure of assets better left in private coffers. Yet if the dictator devotes resources to repression, ‘[the] very resources that enable the regime's repressive agents to suppress its opposition also empower them to act against the regime itself’ (Svolik Reference Svolik2012: 124). In authoritarian regimes, what repressive agents provideth, repressive agents can taketh away. As such, institutions in authoritarian regimes, despite their democratic veneer, reflect a ruler's concern for and need to manage the dynamics of these twin conflicts.
The spectre of electoral authoritarianism
Since the 1990s, electoral authoritarianism – sometimes referred to as competitive authoritarianism (Howard and Roessler Reference Howard and Roessler2006; Levitsky and Way Reference Levitsky and Way2010) or democratic authoritarianism (Brancati Reference Brancati2014) – is the dominant form of authoritarian regime. Andreas Schedler (Reference Schedler2006) paraphrases Marx, calling this development ‘the specter of electoral authoritarianism’; Yonatan Morse (Reference Morse2012) goes further, christening it the ‘era of electoral authoritarianism’. EA regimes permit multiple parties to compete legally in legislative elections, with the distinction that electoral integrity in these regimes is either compromised or absent.Footnote 7 The absence of electoral integrity, however, does not mean the absence of competition and electoral pressures (Miller Reference Miller2015).
Existing scholarship stresses the instrumental nature of authoritarian elections. Elections help rulers acquire information on adversaries (Gandhi and Lust-Okar Reference Gandhi and Lust-Okar2009; Magaloni 2006) and project dominance (Magaloni Reference Magaloni2008; Simpser Reference Simpser2013). Alberto Simpser (Reference Simpser2013) shows how Russia and Zimbabwe manipulate electoral outcomes as a show of strength to opponents, which prolongs party and leader tenure. Similarly, during the halcyon days of Mexico's Partido Revolucionario Institucional (PRI), the party nonetheless spent significant resources to mobilize voters despite the lack of credible opposition so as to project an illusion of invulnerability (Magaloni Reference Magaloni2008). Elections also allow rulers to reward loyalty and punish disloyalty (Blaydes Reference Blaydes2011; Lust-Okar Reference Lust-Okar2006). Lisa Blaydes (Reference Blaydes2011), for instance, finds that opposition-supporting areas in Mubarak's Egypt were punished by the withholding of public sewer and water lines. Likewise, the handful of opposition-controlled districts in Singapore receive a lower share of government funds.
Moreover, elections can act as a release valve for simmering tensions by allowing citizens to express their discontent through the ballot box. At the same time, they also permit regime supporters to voice their approval en masse. More importantly, elections can serve as focal points for collective action and coordination in an otherwise restrictive and low-information authoritarian environment. The primary goal of EA ruling parties, therefore, is to ensure that any dissent remains minimal, and the most effective strategy is to dominate elections. This not only demoralizes opposition parties but ensures that any societal opposition to their reign remains weak. While EA rulers can control electoral outcomes, they face what Schedler (Reference Schedler2006) calls a credibility–flexibility trade-off. Too much control reduces electoral credibility, which can be a powerful impetus for mass mobilization and elite defections, as in the Philippines in 1986. Perceptions of stolen or fraudulent elections can arouse protests strong enough to topple the regime (Kuntz and Thompson Reference Kuntz and Thompson2009). Too little control, on the other hand, and the ruling party runs the risk of an outcome that weakens its aura of invincibility, which may in turn embolden and unite the opposition. Electoral manipulation is risky and may undermine the legitimacy that ruling parties seek.
Consequently, I argue that EA ruling parties, compared to their closed counterparts, are more likely to adopt preventive strategies – such as the provision of public goods and redistributive policies – that minimize the threat of mass discontent on the one hand and cultivates support from key societal groups on the other.Footnote 8 These strategies mitigate the credibility–flexibility trade-off by gathering support from the citizenry, and thereby assuring favourable electoral outcomes without the need for excessive manipulation and control. That authoritarian elections can be uncertain and competitive further motivates EA ruling parties to enact welfare-enhancing policies (Hyde and Marinov Reference Hyde and Marinov2012; Miller Reference Miller2015). Even if the risk of electoral defeat is minimal, failing to receive a commanding share of the vote represents a public loss of face and legitimacy that ruling parties want to avoid. Examples include the PRI's 1988 narrow win (50.7%) in Mexico (the worst showing for a winning candidate since 1917), Singapore's ruling People's Action Party's (PAP) 1991 loss of an unprecedented four parliamentary seats, and more recently, in the 2011 elections its lowest vote share (60.1%) since independence, and Russia's United Party's loss of 77 seats in the 2011 legislative elections.Footnote 9 What is more, contested elections create incentives for EA regimes to select skilled leaders, broaden support bases, increase party competence and invest in bureaucratic development and institutional capacity, all of which improve the capacity of EA regimes to redistribute (Miller Reference Miller2015; Slater Reference Slater2008; Svolik Reference Svolik2012).
Closed authoritarian regimes, which include regimes without electoral institutions such as Saudi Arabia and Brunei, and regimes in which a single party stars in elections as in China and North Korea, may similarly provide public goods to their citizens. Unlike EA regimes, however, these rulers do not face pressure from opposition parties, which reduces the incentive to redistribute. In addition, the prospects of losing power is minimal, and repression as a fallback strategy is more amenable in the absence of opposition political entrepreneurs and elections around which dissent can coalesce.
In sum, electoral competition may not be the ‘only game in town’ in EA regimes, but winning – dominating electoral margins – is paramount. Incumbent rulers have left office in approximately 20% of national elections in EA regimes since 1946 (Hyde and Marinov Reference Hyde and Marinov2012), and the threat of democratization looms large when ruling parties lose elections as they did in Malawi in 1994 and Malaysia in 2018. As such, ruling parties in EA regimes spend significant resources to campaign, cultivate and control their support coalitions. Moreover, individual members within a ruling party may lose their seats in the legislature if they ignore constituency demands. Finally, while some authoritarian leaders spend their twilight years on tropical island paradises, others face exile, imprisonment or even death (Debs and Goemans Reference Deb and Goemans2010; Goemans Reference Goemans2008). Elections in increasingly competitive arenas therefore require even entrenched ruling parties to ensure that enough of their citizens are placated. As such, I expect that:
Hypothesis 1:
EA regimes reduce income inequality compared to non-EA regimes.
Parties
Parties are a cornerstone of authoritarian rule (Huntington Reference Huntington1968; Levitsky and Way Reference Levitsky and Way2010). Scholars typically view parties, like elections, from the perspective of ruling parties and see them as strategic instruments that facilitate the coordination of expectations and behaviour (Gandhi Reference Gandhi2008; Gandhi and Przeworski Reference Gandhi and Przeworski2006). Parties allow authoritarian rulers to co-opt potential rivals (Gandhi and Przeworski Reference Gandhi and Przeworski2006), distribute spoils and patronage (Blaydes Reference Blaydes2011; Geddes Reference Geddes2006; Lust-Okar Reference Lust-Okar2006; Svolik Reference Svolik2012) and muster citizen support for the regime (Lust-Okar Reference Lust-Okar2006; Svolik Reference Svolik2012). Parties can even coup-proof a regime by increasing the number of regime stakeholders, which motivates members to mobilize their networks in the event of a coup threat (Geddes Reference Geddes2006).
Existing studies of EA regimes tend to focus on the effects of electoral pressure and the response of ruling parties on outcomes (Donno Reference Donno2013; Miller Reference Miller2015).Footnote 10 With regard to inequality, however, I argue that an emphasis on electoral competition alone does not explain the variation across EA regimes. In the absence of additional information and context, the impact of authoritarian parties on inequality is indeterminate. If parties consolidate elite power and facilitate bargaining and rent-sharing among elites, then income inequality may increase. On the other hand, if parties cultivate and build support coalitions among key segments of society, such as workers or farmers, then inequality may be reduced. As Michael Albertus (Reference Albertus2015: 18) writes, ‘coalitional dynamics are the political origins of redistribution’.
To resolve this issue, I turn to a factor that has been left by the wayside amidst the new institutional analysis on authoritarian regimes – party ideology. To be sure, ideology is a coarse proxy for the support coalitions on which all rulers rely to stay in power. Yet it nonetheless captures a key aspect of ruling parties. Ample research in the democratic literature shows how party ideology exerts influence over policy preferences and outcomes in the advanced industrialized democracies (Garrett Reference Garrett1998; Iversen and Soskice Reference Iversen and Soskice2006; Persson and Tabellini Reference Persson and Tabellini2000; Rueda Reference Rueda2007). Right governments place liberty above equality, and prefer lower taxes and lower welfare spending. Left governments, on the other hand, are more concerned with equality and prefer progressive taxation and a more expansive welfare regime.
While the role of ruling party ideology in less developed countries is less clear, governments with labour bases of support tend to have more generous welfare programmes (Esping-Andersen Reference Esping-Andersen1990; Huber and Stephens Reference Huber and Stephens2001), though David Rueda (Reference Rueda2005) points out that in some instances, this generosity is unevenly distributed to supporters at the expense of the broader working class. On the other hand, Evelyne Huber, Thomas Mustillo and John Stephens (Reference Huber, Mustillo and Stephens2008) find, in contrast to OECD countries, that partisanship is not associated with health and education spending in 18 Latin American countries from 1970 to 2000. With respect to authoritarian regimes, Stephan Haggard and Robert Kaufman (Reference Haggard and Kaufman2008) show that Eastern European governments enacted significant welfare programmes under authoritarianism. Indeed, in a sample of 73 countries, Isabela Mares and Matthew Carnes (Reference Mares and Carnes2009) find that the majority of social programmes including old-age, sickness and disability were adopted under autocracy. Furthermore, that citizens outside the advanced democracies use the left–right dimension in thinking about politics suggests that ruling parties must pay attention to and reflect these preferences in their platforms and policies (Ha Reference Ha2012).
I argue that what differentiates authoritarian from democratic ruling parties is the former's emphasis on control. The role of ideology matters insofar as it relates to the type of control the ruling party prefers. While the right might prefer coercive force, the left chooses coercive distribution (Albertus et al. Reference Albertus, Fenner and Slater2018). For instance, while Nicaragua's Sandinista National Liberation Front and Mexico's Partido de la Revolución Democrática are left parties, Singapore's PAP and Malaysia's Barisan Nasional are conservative parties. To be sure, this discussion suggests that ruling party ideology plays a role not only in EA regimes, but in one-party closed authoritarian regimes as well. However, the absence of a viable alternative that an opposition party provides, and the impossibility of losing power in elections in closed regimes tip the scales towards the use of coercive force as opposed to coercive distribution in the face of challenges. Ultimately, as Robert Kaufman and Alex Segura-Ubiergo (Reference Kaufman and Segura-Ubiergo2001: 563) argue in their analysis of social spending in Latin America, ‘the question … is whether their policy behavior is constrained by their constituent base or partisan supporters – an issue that should be resolved empirically, rather than by definition’. As such, I test the following conditional hypothesis:
Hypothesis 2.1:
EA regimes with left leaders have lower income inequality compared to those with centre or right leaders.
At the same time, parties help rulers make talk less cheap by creating an environment of regular and structured interactions. Parties facilitate information flows and allow elites to monitor and enforce leader behaviour, not unlike the role of legislatures (Boix and Svolik Reference Boix and Svolik2013; Wright Reference Wright2008). For instance, Scott Gehlbach and Philip Keefer (Reference Gehlbach and Keefer2011) argue that ruling party institutionalization promotes domestic investment by providing information to party members, thereby facilitating collective action among party members, and making credible the ruler's commitment to treat investments by party members and political allies in a proper manner. They find that the age of the ruling party – their proxy for party institutionalization – has a positive impact on domestic investment.Footnote 11
Yet opposition parties in EA regimes can be institutionalized as well. Samuel Huntington (Reference Huntington1968: 1) opens Political Order in Changing Societies by stating that ‘The most important political distinction among countries concerns not their form of government but their degree of government’ and in discussing the critical role of political institutions, goes on to define institutionalization as ‘the process by which organizations and procedures acquire value and stability’ (Reference Huntington1968: 12). With respect to the ubiquitous political party, party institutionalization refers to the process and extent to which political parties become and stay stable, and survive over time (Bizzarro et al. Reference Bizzarro, Hicken and Self2017; Huntington Reference Huntington1968). Institutionalized parties have long-term goals that take precedence over the short-term goals of their individual members (Levitsky Reference Levitsky2003). Institutionalized parties – both ruling and opposition – therefore, privilege long-term party survival over short-term individual rewards. As such, the degree of party institutionalization influences the amount of authority and control party leaders have over their members. I argue that in EA regimes, institutionalized ruling parties are cohesive and expect to stay in power by (always) winning elections. Elections and electoral competition amplify these goals and further encourage the ruling party to provide public goods and undertake redistributive policies. What is more, institutionalized opposition parties pose a greater threat to ruling parties for similar reasons: institutionalization increases opposition elite cohesion and increases the likelihood that citizens will perceive the opposition as a viable alternative to the ruling party. Consequently, I expect that:
Hypothesis 2.2:
EA regimes with greater party institutionalization have lower income inequality compared to those with lower institutionalization.
Research design
To assess the impact of electoral authoritarianism on inequality, I compile a time-series cross-sectional (TSCS) data set on approximately 90 authoritarian regimes from 1960 to 2016, with the country-year as the unit of analysis. Since my focus is authoritarian regimes, I exclude all countries that are electoral or liberal democracies throughout the period of analysis.Footnote 12
Outcome
The outcome of interest is income inequality. There are two potential issues in existing measures of income inequality: accuracy and missingness. To deal with the former, I run my models on multiple operationalizations of the outcome. Common approaches to the latter problem of missing data include: taking the average of existing data for a given country over a fixed time period (Acemoglu et al. Reference Acemoglu, Naidu, Restrepo, Robinson, Atkinson and Bourguinon2015; Boix Reference Boix2003) or using imputation methods (Solt Reference Solt2009). While imperfect, these methods are the best available at this point. Solt's (Reference Solt2009, Reference Solt2016) Standardized World Inequality Indicators Database (SWIID) combines data from the Luxembourg Income Study and other sources to derive a comparable, cross-national and standardized data set of Gini coefficients.Footnote 13 To deal with missing data, Solt (Reference Solt2009) uses available data from nearby country-years. I use the net Gini (gini_net) variable, which measures income inequality after taxes and transfers. As a robustness check and to more directly test whether EA regimes are more redistributive than non-EA regimes, I use data on social, and welfare and insurance spending from Michael Albertus and Victor Menaldo (Reference Albertus and Menaldo2014). I show these results in the online Appendix.
Explanatory variables
Like inequality, there are a number of potential measures for authoritarian regime type (Geddes et al. Reference Geddes, Wright and Frantz2014; Svolik Reference Svolik2012; Wahman et al. Reference Wahman, Teorell and Hadenius2013). The Varieties of Democracy (V-Dem) data set is the most comprehensive longitudinal data set of democracy indicators available to date, and contains a four-category regime-type variable – closed autocracy, electoral autocracy, electoral democracy and liberal democracy – that is well-suited for my analysis. This e_v2x_regime variable comprises a measure of polyarchy – the V-Dem Electoral Democracy Index (EDI) – and two other categorical indicators that capture the extent of multiparty, and free and fair elections.Footnote 14 Electoral democracies score above 0.5 on the EDI, and above 2 on both the multiparty, and free and fair elections indicators. Electoral autocracies fail to meet one or more of the criteria for electoral democracies but score above 1 on the multiparty election indicator. I therefore create a binary variable (EA) coded 1 if a regime is EA and 0 otherwise. As a robustness check, I use the margin of majority maj from the 2017 Database on Political Institutions (Cruz et al. Reference Cruz, Keefer and Scartascini2016), which measures the proportion of seats in the legislature held by the ruling party. Lower values of maj indicate a more competitive regime. I show these results in the online Appendix.
Moderators
There are few data on government ideology outside the advanced industrialized democracies. As a proxy for party ideology, I use execrlc from the 2017 Database on Political Institutions, which measures a country's chief executive's orientation on economic issues along a three-category left–centre–right scale using party descriptions and platforms (Cruz et al. Reference Cruz, Keefer and Scartascini2016), and create a binary variable (left leader) coded 1 if a leader has a left economic orientation and 0 otherwise.
I rely once more on V-Dem for a measure of party institutionalization (v2xps_party). V-Dem conceptualizes party institutionalization as a composite of five sub-components that include: (1) the number of permanent party organizations at the national level; (2) the number of parties that have permanent local branches; (3) the number of parties with distinct and publicized party platforms; (4) the extent to which party members vote together; and (5) the most common form of linkage to a party's constituents.Footnote 15 This variable ranges from 0 to 1, where higher values indicate greater party institutionalization.
Control variables
Finally, I control for other variables that can potentially affect income inequality. The usual suspects include the level of economic development, the rate of economic growth, and oil income as a percentage of gross domestic product (GDP), all from the World Development Indicators (World Bank 2016). I use the natural log of per capita GDP to capture economic development (per capita GDP) and expect a positive relationship between development and inequality. I further expect that inequality decreases with higher economic growth (growth), and that regimes with greater oil revenues (oil income) have higher inequality. Following Rafael Reuveny and Quan Li (Reference Reuveny and Li2003), I include two variables – capital openness and trade openness – to capture the degree of economic openness. Trade openness is the sum of imports and exports as a percentage of GDP from the World Development Indicators, and I use the Chinn–Ito (Chin and Ito Reference Chinn and Ito2008) de jure index of capital openness, which uses the IMF's Annual Report on Exchange Arrangements and Exchange Restrictions to code the extent of restrictions on cross-border financial transactions. Finally, I include ethnolinguistic fractionalization (Alesina et al. Reference Alesina, Devleeschauwer, Easterly, Kurlat and Wacziarg2003).
Model specification
TSCS data present two challenges to inference: unit heterogeneity and serial correlation. To handle these issues, I run the following sets of models: First, I run ordinary least squares (OLS) regression on five-year averages of each variable in the model with country and half-decade fixed effects. Averaging all variables over five-year intervals accounts for the fact that income inequality and regime type tend to be slow-moving and relatively stable, and guards against artificial inflation of the sample size.Footnote 16
 $$\eqalign{& {\rm net\ Gin}{\rm i}_{it}_\; = {\rm \alpha} + {\rm \beta} _1{\rm E}{\rm A}_{it} + {\rm \beta} _2{\rm per\ capita\ GD}{\rm P}_{it} + {\rm \beta} _3{\rm growt}{\rm h}_{it} + {\rm \beta} _4{\rm oil\ incom}{\rm e}_{it} \cr & + {\rm \beta} _5{\rm capital\ opennes}{\rm s}_{{\rm it}} + {\rm \beta} _6{\rm trade\ opennes}{\rm s}_{it} \cr & + {\rm \beta} _7{\rm ethnolinguistic\ fractionalizatio}{\rm n}_{it} + \gamma _t + \varepsilon _{it}} $$
where i and t denote the country and five-year period, γ indicates half-decade fixed effects, and ε is an error term.
Next, I run fixed effects OLS regression models with Driscoll–Kraay standard errors (Driscoll and Kraay Reference Driscoll and Kraay1998) with a third-order lag to account for serial correlation, and country fixed effects to deal with unit heterogeneity (Albertus and Menaldo Reference Albertus and Menaldo2014). John Driscoll and Aart Kraay (Reference Driscoll and Kraay1998) show that failure to account for spatial and temporal dependence can bias and lead to inconsistent OLS standard error estimates, and they propose a correction that capitalizes on the number of time observations. I further lag all right-hand-side variables by one year.
The Pepinksy (Reference Pepinsky2014) critique
A key obstacle in assessing the effects of authoritarian institutions on outcomes is the endogeneity of these institutions. If – as existing theories state – authoritarian institutions serve strategic purposes and are in part a response to pre-existing political, social or economic conditions, then these same institutions cannot subsequently affect and explain these conditions. The central problem lies in the inability of authoritarian institutions to constrain the behaviour of rulers, since these very institutions could well be a manifestation of the underlying distribution of power.Footnote 17 As Pepinksy (Reference Pepinsky2014: 643) writes, ‘because institutions are political creations, analysts must distinguish between institutions as causes and institutions as epiphenomena’ (emphasis in original).
In the context of this analysis, it is plausible that a ruling party may decide to permit opposition parties and hold elections – and thus transition to an EA regime – in response to rising income inequality or growing opposition to its rule. It is also plausible that high levels of pre-existing income inequality might lead to the rise of left ruling parties under EA who promise redistribution and other welfare reforms. To assuage concerns about endogeneity and properly isolate the effect of EA on inequality, I run a third set of models using instrumental variables (IV) regression. IV regression relies on the use of an instrument, Z, that: (1) affects the endogenous predictor (X), and (2) affects the outcome (Y) only through its effect on X.Footnote 18 In the context of this analysis, for an instrument Z to be valid, it must predict EA but not the level of income inequality. If this exclusion restriction is not satisfied, coefficient estimates will be biased. Following Michael Miller (Reference Miller2015), I use the regional, neighbouring and global proportion of EA regimes, and EA history as instruments for EA. Across all IV-GMM models, first-stage regressions indicate that these four instruments are predictive of EA. Next. the Kleibergen–Paap rk Wald F statistic – the appropriate statistic given the use of robust standard errors – indicates that the instruments are not weak across all models as well. Finally, the Sargan–Hansen J statistic – a test for overidentification – is not significant across the board, which supports the validity of the instruments.
Table 1 presents summary statistics for all variables in the analysis.
Summary Statistics of Variables in the Analysis

Findings
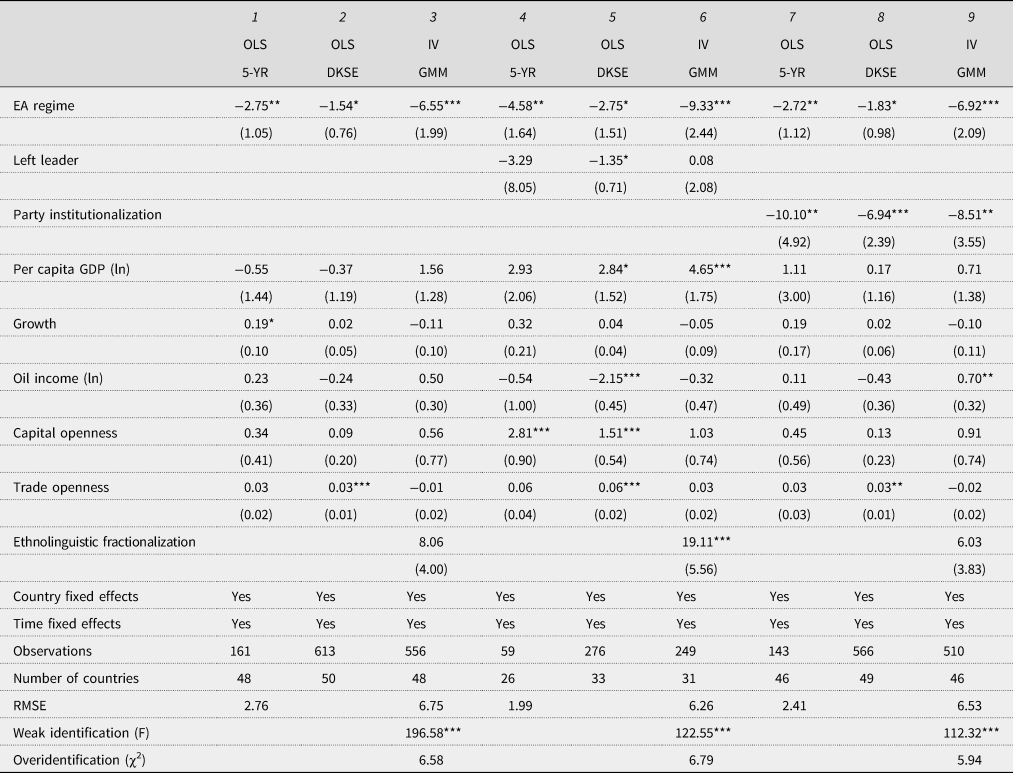
Table 2 presents panel country fixed-effects model estimates of the effects of electoral authoritarianism (as measured by V-Dem) on the level of post-tax, post-transfer income inequality, including OLS on five-year averages, OLS with Driscoll–Kraay standard errors (DKSE), and IV specifications. All models include time and country fixed effects, and with the exception of OLS 5-YR models, all right-hand-side variables are lagged by one year. Models 1 through 3 test the effects of EA, models 5 through 8 include ideology, and models 6 through 9 include party institutionalization.
Effects of Electoral Authoritarianism, Left Leader and Party Institutionalization on Income Inequality

Notes: DV = net income inequality. Robust standard errors are in parentheses. ***, ** and * denote statistical significance at p < 0.01, p < 0.05 and p < 0.10 respectively. Models 1, 4 and 6 show fixed effects OLS estimates on five-year averages (5-YR); models 2, 5 and 7 show fixed effects OLS estimates with Driscoll–Kraay standard errors (DKSE); models 3, 6 and 9 show generalized method of moments (GMM) estimates with DKSE. All variables are lagged by one year except in OLS (5-YR) models. The comparison group for EA regime is closed (non-EA) regimes; the comparison group for left leader is non-left (right or centre) leaders. The sample includes all authoritarian regimes from 1960–2016 as coded by V-Dem.
Consistent with Hypothesis 1, the results show that all else equal, electoral authoritarianism, on average, has a negative and statistically significant effect on post-tax/transfer levels of inequality. That is, an EA regime is more likely to have lower income inequality compared with a non-EA regime. What is more, the negative effect of EA on income inequality is robust across all three model specifications. The effect of EA remains unchanged with the inclusion of a left leader dummy in models 4 through 6. The effect of a left leader on income inequality, however, is negative and statistically significant only in one of the three models (Model 5). Models 7 through 9 reveal that greater party institutionalization decreases income inequality, as does EA. The effects of the control variables are sensitive to model specification. In the OLS-DKSE models (2, 5 and 8), trade openness has a positive and significant effect on income inequality. Model 5 further shows that the levels of development and capital openness increase income inequality while oil revenues have a negative and statistically significant effect on inequality. The remaining models, however, show no significant effect of most control variables.
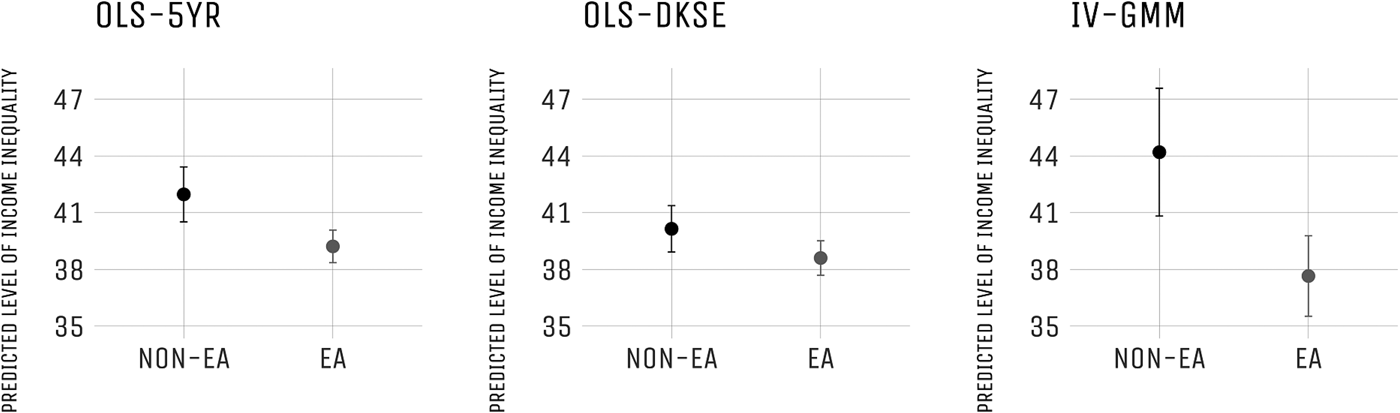
Substantively, Figure 3 shows the predicted levels of EA on income inequality across all three model specifications (models 1, 2 and 3) with all control variables held at their respective means. The dot indicates the predicted level of income inequality and the whiskers indicate 95% confidence levels. Irrespective of specification, EA regimes (in grey) have lower income inequality compared with non-EA regimes.
Predicted Level of Income Inequality by Authoritarian Regime Type
Note: The dot indicates the predicted level of income inequality and the whiskers indicate 95% confidence intervals. All control variables are held at their respective means.

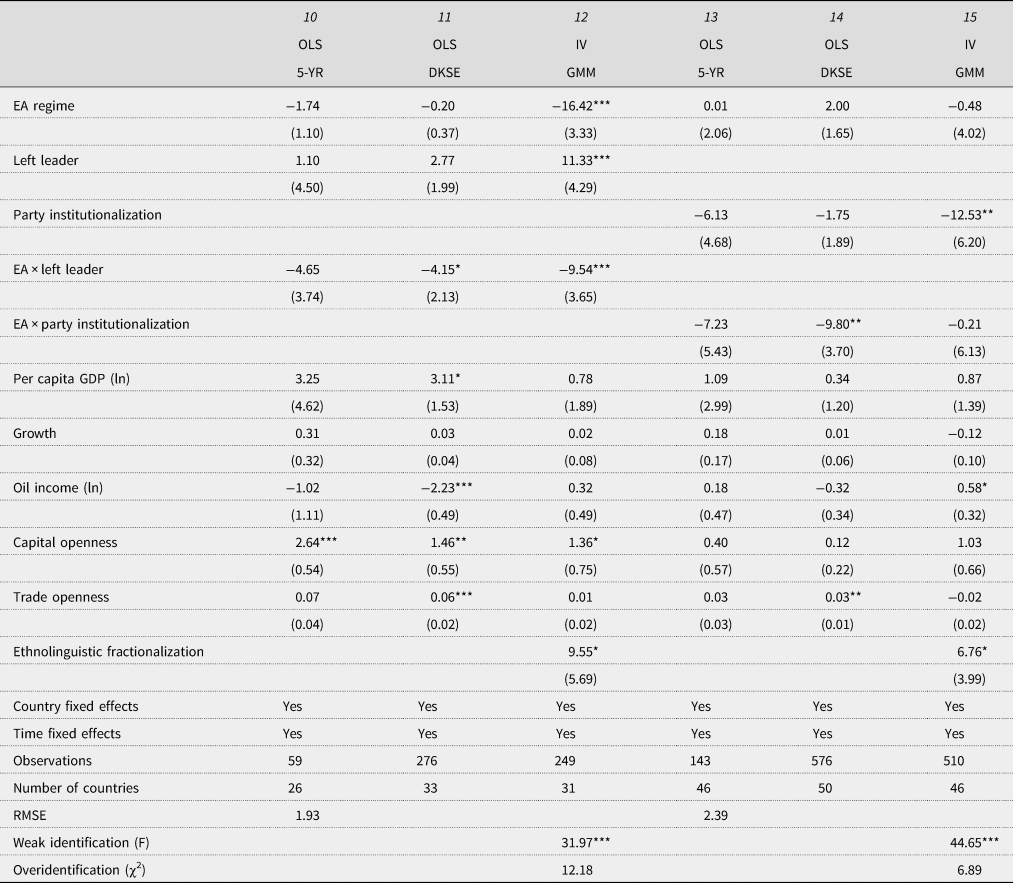
To test Hypotheses 2.1 and 2.2, I include multiplicative terms between EA and each relevant moderator – EA × left leader and EA × party institutionalization respectively – in each model. Table 3 presents the estimates from this set of models. Since neither the sign nor statistical significance of coefficient estimates of interactions and their constitutive terms are directly interpretable (Berry et al. Reference Berry, Golder and Milton2012; Brambor et al. Reference Brambor, Clark and Golder2006), I follow established work and construct marginal effects plots instead to correctly interpret the interaction terms. Figure 4 plots the estimated marginal effect of EA on income inequality as leader ideology changes from non-left (0) to left (1) across the three model specifications. The dot indicates the estimated coefficient, and the whiskers indicate 95% confidence intervals. While the marginal effect of EA on inequality is negative with a non-left leader, this effect is not statistically significant; only with a left leader is the marginal effect of EA negative and statistically significant. This lends support to Hypothesis 2.1 and suggests that EA regimes with left leaders are more likely to have lower income inequality.
Conditional Effects of Electoral Authoritarianism, Left Leader and Party Institutionalization on Income Inequality

Notes: DV = net income inequality. Robust standard errors are in parentheses. ***, ** and * denote statistical significance at p < 0.01, p < 0.05 and p < 0.10 respectively. Models 10 and 13 show fixed effects OLS estimates on five-year averages (5-YR); models 11 and 14 show fixed effects OLS estimates with Driscoll–Kraay standard errors (DKSE); models 12 and 15 show generalized method of moments (GMM) estimates with DKSE. All variables are lagged by one year except in OLS (5-YR) models. The comparison group for EA regime is closed (non-EA) regimes; the comparison group for left leader is non-left (right or centre) leaders. The sample includes all authoritarian regimes from 1960–2016 as coded by V-Dem.
Marginal Effects of Electoral Authoritarianism on Income Inequality by Ideology
Notes: The dot indicates the estimated coefficient, and the whiskers indicate 95% confidence intervals. The coefficient estimate is statistically significant at p < 0.05 where the confidence intervals do not include 0.

Substantively, Figure 5 compares the predicted levels of income inequality across two dimensions – EA versus non-EA and left versus non-left – with all variables held at their respective means. The dot indicates the predicted level and the whiskers indicate 95% confidence intervals. Compared to non-EA regimes (in black), EA regimes (in grey) have lower predicted levels of income inequality across all three specifications. Furthermore, income inequality is lowest in left EA regimes.
Predicted Level of Electoral Authoritarianism on Income Inequality by Ideology

Next, Figure 6 shows the marginal effect of EA on income inequality as party institutionalization increases for all three model specifications. The line and shaded region indicate the estimated coefficients and their associated 95% confidence intervals respectively. This graph provides evidence for Hypothesis 2.2: the marginal effect of EA on income inequality is negative and statistically significant with greater party institutionalization (past approximately 0.4).
Marginal Effects of Electoral Authoritarianism on Income Inequality by Party Institutionalization
Notes: The solid and dashed lines indicate the estimated coefficient and its associated 95% confidence intervals respectively. The coefficient estimate is statistically significant at p < 0.05 where the confidence intervals do not include zero.

Finally, Figure 7 plots the predicted levels of income inequality in EA regimes as party institutionalization increases, with all control variables held at their respective means. Irrespective of model specification, EA regimes with greater party institutionalization – where parties are more likely to have longer time horizons and care about survival – have lower predicted levels of income inequality.
Predicted Level of Electoral Authoritarianism on Income Inequality by Party Institutionalization
Note: The solid and dashed lines indicate the predicted level of income inequality and its associated 95% confidence intervals respectively with all control variables held at their respective means.

The unintended consequences of electoral authoritarianism
EA regimes don the trappings of representative democracy and adopt the central hallmark of democracy: elections. These regimes use elections for a variety of instrumental reasons: to intimidate opponents, promote party unity, reward the faithful, and perhaps most importantly, add a veneer of legitimacy to their rule. Legitimacy reduces the costs of authoritarian control, enhances regime stability and prolongs authoritarian rule. Notwithstanding the less-than-noble intentions of these regimes, elections have an unexpected effect. By generating electoral competition, it ties the hands of ruling parties and compels them to pay attention to citizen concerns.Footnote 19 Consequently, EA regimes not only do better on a variety of health and educational outcomes, they have lower levels of income inequality as well.
Yet electoral competition alone does not explain the variation in outcomes across EA regimes. In this regard, this study extends the existing literature on EA regimes beyond electoral competition and shows that the effects of electoral competition in these regimes depend on the ideology of ruling parties and the extent of party institutionalization. Like democracies, the ideology of the ruling party has a predictable effect on socioeconomic outcomes; EA regimes with left parties have lower levels of inequality compared with right and centre parties. Similarly, EA regimes with greater party institutionalization have lower levels of inequality. Much of the existing work on authoritarian parties focuses on elite dynamics, and research has yet to fully explore how coalitional dynamics under authoritarian rule shape the behaviour of ruling and opposition parties, their interactions in the electoral arena, and subsequent outcomes.Footnote 20 While the left–centre–right distinction in this study is an admittedly coarse measure of coalitional dynamics and partisanship, it provides a promising first cut at how party bases of support affect socioeconomic outcomes.
The strength and institutionalization of opposition parties vary across EA regimes as well. Opposition parties in EA regimes seem to face a Sisyphean task if their goal is to supplant the ruling party. They have little hope of winning in an environment of shifting rules, face dubious challenges to discredit them, and their existence is tolerated so long as they remain manageable and create an illusion of choice for the dissatisfied groups in society. Yet their presence creates the basis of electoral competition, establishes focal points for regime opponents, and motivates the regime to provide public goods. Here, scholarship that explores the distinction between hegemonic authoritarian regimes and competitive authoritarian regimes is an encouraging start (Brownlee Reference Brownlee2009; Donno Reference Donno2013; Roessler and Howard Reference Roessler, Howard and Lindberg2009). While regime survival and democratization remain the focus of this line of inquiry, a broadening of the scope to examine welfare outcomes and the role that opposition parties play in these regimes may prove fruitful.
Finally, the nascent shift from regime survival to exploring how specific authoritarian institutions – and the role of moderating factors such as elite splits, party institutionalization and state capacity – influence social and economic policy decisions as a form of authoritarian control is a promising avenue of research.Footnote 21 The waves of democratization that swept the world in the 20th century have subsided, and, in their wake, left regimes that masquerade as democracies, under which a significant proportion of the world's people live. Understanding the drivers of policy decisions and their effects on inequality and other key social outcomes in these regimes may help explain their resilience, and the allure of this false alternative to liberal democracy.
Supplementary information
To view the supplementary information for this article, please visit https://doi.org/10.1017/gov.2019.19.
Acknowledgements
I thank three anonymous reviewers, Bob Kaufman, Steph Haggard, Anne Meng, and participants at the 2017 Annual Meetings of the Midwest and American Political Science Associations for helpful comments and suggestions.