Introduction
Grass-dominated ecosystems occupy ~40% of Earth's terrestrial surface (Gibson Reference Gibson2009). Tropical grasses account for ~20% of the global net primary productivity (Lloyd and Farquhar Reference Lloyd and Farquhar1994). Most of these grasses employ C4 photosynthesis (Still et al. Reference Still, Berry, Collatz and DeFries2003; Edwards et al. Reference Edwards, Osborne, Strömberg, Smith, Consortium, Bond, Christin, Cousins, Duvall, Fox, Freckleton, Ghannoum, Hartwell, Huang, Janis, Keeley, Kellogg, Knapp, Leakey, Nelson, Saarela, Sage, Sala, Salamin, Still and Tipple2010), and comprise over half of all C4 plant species (Sage et al. Reference Sage, Christin and Edwards2011). C4 photosynthesis operates through several morphological and biochemical modifications of the ancestral C3 photosynthetic pathway resulting in reduced photorespiration and higher photosynthetic efficiency (Ehleringer and Cerling Reference Ehleringer and Cerling2002). C4 grasses tend to have an advantage and dominate under high light conditions and in hot, seasonally arid climates such as tropical and subtropical grasslands and savannas—though they are not restricted to these habitats—and under low pCO2. C3 grasses dominate in temperate and boreal grasslands as well as in high-elevation ecosystems (Ehleringer et al. Reference Ehleringer, Cerling and Helliker1997; Boom et al. Reference Boom, Marchant, Hooghiemstra and Sinninghe Damsté2002; Edwards et al. Reference Edwards, Osborne, Strömberg, Smith, Consortium, Bond, Christin, Cousins, Duvall, Fox, Freckleton, Ghannoum, Hartwell, Huang, Janis, Keeley, Kellogg, Knapp, Leakey, Nelson, Saarela, Sage, Sala, Salamin, Still and Tipple2010; Strömberg Reference Strömberg2011). Thus, global patterns of C3 and C4 grass distribution are well known (Twiss Reference Twiss, Rapp and Mulholland1992; Edwards and Still Reference Edwards and Still2008; Pau et al. Reference Pau, Edwards and Still2013). A number of studies have shown ecological sorting of C3 and C4 grasses along temperature and moisture gradients (e.g., Teeri and Stowe Reference Teeri and Stowe1976; Chazdon Reference Chazdon1978; Tieszen et al. Reference Tieszen, Senyimba, Imbamba and Troughton1979; Livingstone and Clayton Reference Livingstone and Clayton1980; Rundel Reference Rundel1980; Young and Young Reference Young and Young1983; Edwards and Still Reference Edwards and Still2008). Large-scale distribution of C3/C4 grass seems to be best explained by the temperature crossover model (Ehleringer et al. Reference Ehleringer, Cerling and Helliker1997; Collatz et al. Reference Collatz, Berry and Clark1998; Still et al. Reference Still, Berry, Collatz and DeFries2003), which predicts that the switch from C3 to C4 grass dominance is a function of mean monthly air temperature at a given atmospheric CO2. The temperature crossover model, which is widely accepted (but see Winslow et al. Reference Winslow, Hunt and Piper2003), assumes that variation in grass photosynthetic pathways is the main driver of grass distribution. However, several authors have pointed out the important role played by grass evolutionary history on C3/C4 grass distribution (e.g., Edwards and Still Reference Edwards and Still2008; Pau et al. Reference Pau, Edwards and Still2013). As members of the warm-climate PACMAD clade (i.e., Panicoideae, Arundinoideae, Chloridoideae, Micrairoideae, Aristidoideae, Danthonioideae), C4 grasses are restricted to warmer areas. Thus, given the shared preference for warm temperatures of C3 and C4 PACMAD grasses, as opposed to the temperate-climate Pooideae clade, global patterns of C3/C4 grass distribution may be really patterns of Pooideae/PACMAD grass distribution (Edwards and Still Reference Edwards and Still2008).
The spread of grasslands during the Neogene is thought to have had important consequences on faunas (Jacobs et al. Reference Jacobs, Kingston and Jacobs1999) and climate, including the global silicon cycle (Conley and Carey Reference Conley and Carey2015). Geochemical, ecological, paleontological, and systematics studies investigating the drivers of C4 grass expansion point to two main factors: water availability (aridification and/or changes in growing season precipitations) and pCO2 levels (e.g., Cotton et al. Reference Cotton, Cerling, Hoppe, Mosier and Still2016; Fox et al. Reference Fox, Pau, Taylor, Strömberg, Osborne, Bradshaw, Conn, Beerling and Still2018; Sage et al. Reference Sage, Monson, Ehleringer, Adachi and Pearcy2018; Zhou et al. Reference Zhou, Helliker, Huber, Dicks and Akcay2018). However, there is no consensus on the specific environmental dynamics that have led to the ecological success of C4 grasses (Cotton et al. Reference Cotton, Cerling, Hoppe, Mosier and Still2016). Understanding the timing and drivers of the ecological expansion of grassland ecosystems may help us better understand the factors that control both their present and future distributions. Hence, the evolution and spread of grass-dominated ecosystems during the Cenozoic has been widely investigated by paleoecologists and evolutionary biologists. Yet the grass fossil record is scant and provides limited tools to study the timing and evolution of grasses and their response to climate change (Strömberg Reference Strömberg2011). Fossil impressions and compressions of vegetative grass structures are rare and provide little taxonomic information (e.g., Crepet and Feldman Reference Crepet and Feldman1991). Fossilized grass inflorescences are even rarer. Finally, grass pollen can hardly be identified beyond the family level (Palmer Reference Palmer1976; but see Mander et al. Reference Mander, Li, Mio, Fowlkes and Punyasena2013). The δ13C signature of C3 and C4 plants is among the most common indirect proxies used to reconstruct grass and grassland evolution. In fact, differences between C3 and C4 photosynthesis result in differences in carbon stable isotope fractionation (Farquhar Reference Farquhar1983), with δ13C values of C3 plants ranging from ca. −24‰ to −32‰, and δ13C values of C4 plants ranging from ca. −10‰ to −14‰ (Smith and Epstein Reference Smith and Epstein1971; Cerling et al. Reference Cerling, Harris, MacFadden, Leakey, Quade, Eisenmann and Ehleringer1997b). The vegetation δ13C signature is preserved in pedogenic carbonates (Quade et al. Reference Quade, Solouniasand and Cerling1994), soil organic matter (Cerling et al. Reference Cerling, Quade, Wang and Bowman1989; Boutton Reference Boutton, Boutton and Yamasaki1996), fossil grass pollen (Urban et al. Reference Urban, Nelson, Jiménez-Moreno, Châteauneuf, Pearson and Hu2010), and herbivore tooth enamel (Cerling et al. Reference Cerling, Harris, Ambrose, Leakey and Solounias1997a), as well as in lacustrine sediments (Meyers and Ishiwatari Reference Meyers and Ishiwatari1993) and leaf wax n-alkanes (Rieley et al. Reference Rieley, Collier, Jones, Eglinton, Eakin and Fallick1991), and has been used extensively to reconstruct past vegetation in the absence of direct evidence. However, in lake settings, δ13C interpretations are complicated by the influence of both terrestrial and aquatic plants, as well as of microorganisms, on the carbon isotope ratio (Meyers and Ishiwatari Reference Meyers and Ishiwatari1993). The carbon isotope signature of leaf wax n-alkanes, which are generally abundant and well preserved in sediments, especially in lacustrine settings (Castañeda and Schouten Reference Castañeda and Schouten2011), provides finer C3–C4 vegetation reconstructions (e.g., Boom et al. Reference Boom, Marchant, Hooghiemstra and Sinninghe Damsté2002), because n-alkanes from terrestrial plants can be differentiated from those of aquatic plants (but see Diefendorf et al. Reference Diefendorf, Mueller, Wing, Koch and Freeman2010). Although the δ13C signature can be used to distinguish between C3 and C4 plants, it cannot separate C3 grasses and trees, limiting the inferences that can be made about vegetation type and habitat openness. In fact, forest–grassland dynamics are not necessarily influenced by the same factors that control C3 versus C4 plant species abundance, especially in the tropics. Indeed, a number of studies have shown that open- and closed-canopy systems can persist under the same climatic conditions and that fire is one of the main controls on the persistence of open-canopy systems (e.g., Bond et al. Reference Bond, Woodward and Midgley2005; Favier et al. Reference Favier, Aleman, Bremond, Dubois, Freycon and Yangakola2012; Aleman and Staver Reference Aleman and Staver2018).
In the last two decades, phytolith analysis has emerged as one of the most reliable proxies to reconstruct past vegetation, and in particular the evolution and spread of grasses and grass-dominated ecosystems (Thorn Reference Thorn2001; Strömberg Reference Strömberg2005; Strömberg et al. Reference Strömberg, Friis, Liang, Werdelin and Zhang2007a; Cotton et al. Reference Cotton, Sheldon and Strömberg2012; Miller et al. Reference Miller, Smith, Sheldon and Stromberg2012; Chen et al. Reference Chen, Smith, Sheldon and Strömberg2015; Dunn et al. Reference Dunn, Strömberg, Madden, Kohn and Carlini2015; Strömberg and McInerney Reference Strömberg and McInerney2016; Harris et al. Reference Harris, Strömberg, Sheldon, Smith and Vilhena2017; Loughney et al. Reference Loughney, Hren, Smith and Pappas2019). Phytoliths are microscopic bodies of amorphous silica produced by many vascular plants (Trembath-Reichert et al. Reference Trembath-Reichert, Wilson, McGlynn and Fischer2015; Strömberg et al. Reference Strömberg, Di Stilio and Song2016) at varying abundances by absorption of monosilicic acid (hydrated silica, or opal-A) by plant roots and subsequent polymerization in plant cells and tissues (Piperno Reference Piperno1988). Because of their relatively inert composition, they expand the range of depositional environments that can be studied to include well-oxidized sediments where organic matter such as pollen is typically not preserved. Phytoliths primarily represent local vegetation (Piperno Reference Piperno1988; Crifò and Strömberg Reference Crifò and Strömberg2021) compared with pollen, which is sourced from local and regional vegetation (Prentice Reference Prentice1985), thus allowing finer landscape-level vegetation reconstructions. For instance, the relative proportions of phytoliths produced by grasses versus woody plants is a proxy for canopy structure (Bremond et al. Reference Bremond, Alexandre, Hély and Guiot2005a; Strömberg et al. Reference Strömberg, Werdelin, Friis and Saraç2007b; Aleman et al. Reference Aleman, Leys, Apema, Bentaleb, Dubois, Lamba, Lebamba, Martin, Ngomanda, Truc, Yangakola, Favier, Bremond and Woods2012). Finally, phytoliths produced by grasses in grass silica short cells (GSSCP) are highly diagnostic, allowing for the discrimination of major grass clades (subfamily level) and functional types (open- vs. closed-habitat grasses; C3 vs. C4 photosynthesis), thus providing direct insights into grass community composition and ecology (e.g., Alexandre et al. Reference Alexandre, Meunier, Lezine, Vincens and Schwartz1997; Barboni et al. Reference Barboni, Bonnefille, Alexandre and Meunier1999; McInerney et al. Reference McInerney, Strömberg and White2016). Specifically, GSSCP produced by the tropical clade PACMAD (i.e., Panicoideae, Arundinoideae, Chloridoideae, Micrairoideae, Aristidoideae, Danthonioideae), which predominantly uses the C4 photosynthetic pathway, can be distinguished from those produced by C3 grasses in the BOP clade (Bambusoideae, Oryzoideae, Pooideae) and by C3 early-diverging grasses (Anomochlooideae, Pharoideae, Puelioideae). Hence, phytolith analysis uses the proportion of C4/C3 GSSCP to estimate C3–C4 grass abundance from fossil phytolith assemblages. Because C3–C4 grass abundance is influenced by climate, phytolith analysis can provide new types of paleoenvironmental reconstruction and improve paleoclimatic inferences. Indeed, the proportion of C3/C4 GSSCP has been shown to be strongly related to temperature and consequently represents a potential paleotemperature proxy (Bremond et al. Reference Bremond, Alexandre, Wooller, Hély, Williamson, Schäfer, Majule and Guiot2008b).
Here we present a grass phytolith-based paleotemperature proxy from across a Neotropical elevation gradient (~300 to 4300 m above sea level) in the northern Andes. The influence of climate and orogeny on the evolution of high-elevation, grass-dominated ecosystems in the Andes is intensely debated (e.g., Simpson and Todzia Reference Simpson and Todzia1990; Kirschner and Hoorn Reference Kirschner and Hoorn2020). The use of a phytolith-based paleotemperature proxy in parallel with traditional phytolith analysis and through comparison with other paleovegetation and paleoclimate proxies in Andean geological records could help shed light on the timing of grasses and grassland expansion into Neotropical high-elevation ecosystems and their relationship with climate variability. Several modern calibration studies have resulted in the development of phytolith-based climatic and vegetation indices in different ecosystems (Parmenter and Folger Reference Parmenter and Folger1974; Fredlund and Tieszen Reference Fredlund and Tieszen1994; Alexandre et al. Reference Alexandre, Meunier, Lezine, Vincens and Schwartz1997; Bremond et al. Reference Bremond, Alexandre, Hély and Guiot2005a,Reference Bremond, Alexandre, Peyron and Guiotb, Reference Bremond, Alexandre, Peyron and Guiot2008a; Aleman et al. Reference Aleman, Leys, Apema, Bentaleb, Dubois, Lamba, Lebamba, Martin, Ngomanda, Truc, Yangakola, Favier, Bremond and Woods2012). However, many of these studies suffer from methodological limitations due to the lack of control on taphonomic processes, spanning from vegetation production to sediment deposition. In addition, only a limited number of studies couple phytolith analysis to other C3–C4 plant archives for interproxy validation (e.g., Lupien et al. Reference Lupien, Russell, Yost, Kingston, Deino, Logan, Schuh and Cohen2021). Furthermore, modern reference collections from plants or soil surface samples along C3–C4 gradients are restricted to a few geographic areas and, to date, none have been produced in the Neotropics. Several studies have investigated the relationship between grass phytolith assemblages from soils and grass communities in different ecosystems but have led to inconsistent results. For instance, Fredlund and Tieszen (Reference Fredlund and Tieszen1994) found that the GSSCP assemblage composition of soils from 15 modern grasslands in the North American Great Plains broadly reflects the regional east–west moisture gradient (with C4 GSSCP being associated with drier sites) but also noted the extra-local and regional nature of the phytolith signal. Kerns et al. (Reference Kerns, Moore and Hart2001) found only a weak correspondence between GSSCP assemblages and C4–C3 grass species abundance in three canopy types within a Pinus ponderosa forest in North America. In contrast, Bremond et al. (Reference Bremond, Alexandre, Wooller, Hély, Williamson, Schäfer, Majule and Guiot2008b) found a positive relationship between the proportion of C3/C4 grasses and the proportion of C3/C4 GSSCP along an altitudinal gradient in Kenya. A similar trend was described by An et al. (Reference An, Lu and Chu2015) in the southern Himalayas. More recently, Biswas et al. (Reference Biswas, Ghosh, Agrawal, Morthekai, Paruya, Mukherjee, Bera and Bera2021) developed a temperature calibration based on the phytolith climatic index (Ic; Bremond et al. Reference Bremond, Alexandre, Wooller, Hély, Williamson, Schäfer, Majule and Guiot2008b) in the eastern Himalayan sectors.
The objectives of this study are (1) to assess the accuracy of grass phytolith assemblages in soils as a tool for reconstructing the C3/C4 grass ratio in the tropical Andes; (2) to compare this ratio with that of the δ13C record; and (3) to develop a transfer function based on modern phytolith assemblages and temperature to estimate paleotemperature from fossil phytolith assemblages. To complete these objectives, floristic data, along with soil surface samples for phytolith and δ13C analysis were collected and compared along an altitudinal and aridity gradient in Colombia along the northeastern Andean Cordillera. Based on this work, we propose a new phytolith-based transfer function to reconstruct paleotemperatures, and we discuss the prospects and limitations of this new proxy to improve deep-time paleoclimate inferences.
Materials and Methods
Sample and Data Collection
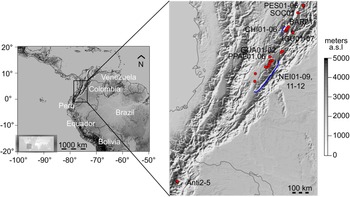
A total of 35 samples for phytolith and δ13C analysis were collected along two elevational transects in the eastern Andean Cordillera of Colombia (Fig. 1). These transects follow a SW-NE orientation and span from 1621 to 3545 and 331 to 2858 m above sea level (m asl), respectively. This set of samples was complemented by five additional samples spanning a higher-elevation range between 3929 and 4303 m asl, and previously collected from a transect oriented SW-SE in the Andean Cordillera of Ecuador (Ledru et al. Reference Ledru, Jomelli, Samaniego, Vuille, Hidalgo, Herrera and Ceron2013; Fig.1). Samples from Colombia encompass several vegetation zones from dry tropical forest to lower and upper montane forest (Hooghiemstra and Van der Hammen Reference Hooghiemstra and Van der Hammen2004). Samples from Ecuador correspond to Paramo vegetation (Fig. 1). All samples were collected from the soil subsurface below the litter layer. Each homogenized soil sample consists of about a dozen subsamples (measuring ~~1 cm3 each) collected randomly within a plot measuring about 100 m2 and then mixed together (Bremond et al. Reference Bremond, Alexandre, Peyron and Guiot2005b). Plots were installed within open-vegetation areas. Forested areas in closed- or mosaic-vegetation types were avoided, in order to minimize the influence of woody vegetation (mainly C3) on the soil δ13C signal, as well as to maximize the amount of GSSCP present in the samples. Furthermore, to limit potential biases in the composition of the GSSCP assemblages linked to the presence of exotic grass species, disturbed areas were also avoided. These mainly include pastures, where nonnative grass species might have been introduced. A semiquantitative floristic survey was conducted at each sample site to estimate the relative abundance of C3 versus C4 grasses (see Supplementary Tables 1, 2). In each plot, two 5 × 5 m subplots were installed; all grass species present in each subplot were identified and their percent cover was estimated visually. Percent cover values for each species at each site were calculated by averaging the two subplot estimations. The relative abundance of C3 and C4 grasses at each site corresponds to the sum of the percent cover of all C3 and C4 grasses, respectively (and does not take into account non-grass vegetation cover). The dominant vegetation stratum was also noted for each site. Based on this information, sampling sites were classified into six vegetation types (C3 grassland, C4 grassland, C3 shrubland, C4 shrubland, C3 grass forest, and C4 grass forest). The “grass forest” vegetation type refers to any closed-forest vegetation type in which grasses are present in the understory. Geographic coordinates and elevation of each sample site were recorded in the field; mean annual precipitation (MAP) and mean annual temperature (MAT) data were gathered from the WorldClim data website (Supplementary Table 3). We extracted regional C3 and C4 grass distribution and MAT data from a compilation of grass species richness data from four intertropical countries in South America (Bolivia, Colombia, Ecuador, and Peru) and a compilation of climatic variables obtained from the Worldclim 1.4 1-km database by Bremond et al. (Reference Bremond, Boom and Favier2012) (in Supplementary Table 4).
Map of the study site. Red dots represent sample sites. Site names are given in black and correspond to: PES01-06; SOC01; BAR01; CHI01-06; IGU01-07; GUA01-02; PPAL01, 06; NEI01-9, 11-2; Anti2-5. Map was created using the ETOPO2 Global Relief Model map (NOAA) in R v. 4.0.3.

Stable Isotope Analysis (δ13C)
Stable carbon isotope analyses were performed on bulk soil from the 35 soil samples collected in Colombia. These analyses were not performed on the six samples collected in Ecuador due to the use of a different sampling protocol for their collection (Ledru et al. Reference Ledru, Jomelli, Samaniego, Vuille, Hidalgo, Herrera and Ceron2013). Approximately 5 g samples were pretreated with 10% hydrochloric acid (HCl) to remove carbonates and then rinsed in deionized water until neutral, freeze-dried, and ball milled. The stable isotope ratio of total organic carbon (δ13CTOC) was measured using a SerCon ANCA GSL elemental analyzer interfaced to a Hydra 20-20 continuous flow isotope ratio mass spectrometer. Carbon isotopic values (δ13C) are expressed in per mil with respect to the international VPDB (Vienna Pee Dee Belemnite) standard (see Supplementary Table 2). The precision/standard deviation is ±0.16‰.
Phytolith Extraction
For each soil sample we used 3–5 g for phytolith extraction. We used the protocol described by Aleman et al. (Reference Aleman, Saint-Jean, Leys, Carcaillet, Favier and Bremond2013), which includes treatment with HCl for carbonate removal, potassium hydroxide for humic acid removal, hydrogen peroxide for removal of organic material, and sodium citrate and sodium dithionite for removal of iron oxides.
We removed soil particles >200 μm by sieving, and deflocculated the remaining soil particles using sodium hexametaphosphate. We used heavy-liquid floatation to isolate the biogenic silica (sponge spicules, diatoms, chrysophyte cysts, and phytoliths) using a heavy-liquid solution of zinc bromide, HCl, and water prepared at a specific gravity of 2.38 g/ml.
Phytolith Classification and Counting
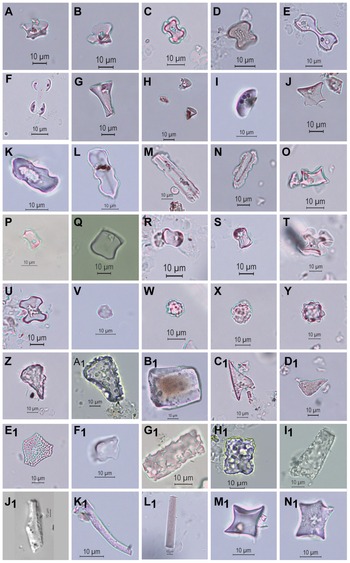
Each dry bio-silica sample was mounted for microscopy using immersion oil to allow for rotation during identification and counting. Phytolith morphotypes were classified according to the International Code for Phytolith Nomenclature (ICPN 2.0; Neumann et al. Reference Neumann, Strömberg, Ball, Albert, Vrydaghs and Cummings2019) into 23 morphotypes divided into the following classes: (1) GSSCP, exclusively produced by and diagnostic of several Poaceae (grass) subfamilies; (2) phytoliths diagnostic of woody dicotyledons; (3) phytoliths distinctive of the monocot family Arecaceae (palms) (Spheroid echinate), but also possibly diagnostic of the family Bromeliaceae (bromeliads) and of the order Zingiberales (e.g., spiral gingers) (i.e., when the phytolith diameter is ≤5μm; see Benvenuto et al. Reference Benvenuto, Fernández Honaine, Osterrieth and Morel2015; Crifò and Strömberg Reference Crifò and Strömberg2021); (4) other phytoliths diagnostic of the Poaceae family (including forms produced mainly but not exclusively by the Poaceae family), as well as other morphotypes belonging to the family Poaceae but whose production is influenced by environmental factors such as water availability (e.g., Bremond et al. Reference Bremond, Alexandre, Peyron and Guiot2005b; Madella et al. Reference Madella, Jones, Echlin, Powers-Jones and Moore2009); and (5) other nondiagnostic forms. Morphotype names (according to Bremond et al. Reference Bremond, Alexandre, Hély and Guiot2005a), corresponding ICPN names and codes, and other information are provided in Table 1. Details regarding GSSCP morphotype assignment to C3 or C4 grasses are given in the Supplementary Appendix. Morphotypes used in our classification are illustrated in Figure 2. Each phytolith count includes all morphotypes present in the assemblage from the five classes mentioned above, and a minimum number (n) of 200 GSSCP diagnostic morphotypes (except for one sample with n = 139) for statistical significance (Pearsall Reference Pearsall2000; Strömberg Reference Strömberg2009). Phytolith counts are provided in Supplementary Table 2.
Examples of phytolith morphotypes from soil assemblages diagnostic of: Poaceae (A–U), woody dicotyledons (V–X), palms/bromeliads/Zingiberales (Y), other Poaceae (Z–F1), nondiagnostic morphotypes (G1–L1), and morphotypes of undetermined affinity (M1–N1). Morphotype names in small capitals (e.g., Bilobate), and acronyms (e.g., BIL) signify morphotypes as formally defined in the International Code for Phytolith Nomenclature 2.0 (Neumann et al. Reference Neumann, Strömberg, Ball, Albert, Vrydaghs and Cummings2019); morphotype names in square brackets correspond to the classification scheme by Bremond et al. (Reference Bremond, Alexandre, Hély and Guiot2005a,Reference Bremond, Alexandre, Peyron and Guiotb, Reference Bremond, Alexandre, Peyron and Guiot2008a,Reference Bremond, Alexandre, Wooller, Hély, Williamson, Schäfer, Majule and Guiotb, Reference Bremond, Boom and Favier2012). A–F, Bilobate (BIL) morphotypes, including: A, B, BIL (1) [Stipa type bilobate]; C,D, BIL (2) [short bilobate]; and E,F, BIL (3) [long bilobate]. G–J, Rondel (RON) morphotypes. K–N, Crenate (CRE) morphotypes, including K, L, CRE (1) [trapeziform trilobate]; and M, N, CRE (2) [trapeziform polylobate]. O–S, Saddle (SAD) morphotypes, including: O, P, SAD (1) [collapsed saddles]; Q, R, SAD (2) [short saddle]; and S, SAD (3) [long saddle]. T, U, Cross morphotypes. V, Spheroid psilate (SPH_PSI) morphotypes [globular smooth]. W, X, Spheroid ornate (SPH_ORN) morphotypes [globular granulate]. Y, Spheroid echinate (SPH_ECH) morphotypes [globular echinate]. Z, A1, Bulliform flabellate (BUL_FLA) morphotypes [cuneiform bulliform cell]. B1, Blocky (BLO) morphotypes [parallelepipedal bulliform cell]. C1, D1, Acute bulbosus (ACU_BUL) morphotypes [acicular air cell]. E1, F1, Papillate (PAP) morphotypes [papillae]. G1–L1, Elongate entire (ELO_ENT) morphotypes, including: G1, H1, ELO_ENT (1) [parallelepipedal long cell]; I1, J1, ELO_ENT (2) [thick trapezoidal rectangle]; and K1, L1, ELO_ENT (3) [elongates]. M1, N1, Undetermined grass silica short cell phytoliths (GSSCP) morphotypes (n.a.) [unclassified].

List of phytolith types included in this study. Names used in column 1 come from Bremond et al. (Reference Bremond, Alexandre, Hély and Guiot2005a,Reference Bremond, Alexandre, Peyron and Guiotb, Reference Bremond, Alexandre, Peyron and Guiot2008a,Reference Bremond, Alexandre, Wooller, Hély, Williamson, Schäfer, Majule and Guiotb, Reference Bremond, Boom and Favier2012). Full names and acronyms according to the International Code for Phytolith Nomenclature (ICPN 2.0) are given in columns 2 and 3 (numbers in parentheses in column 3 refer to morphotype subtypes). The dominant photosynthetic pathway of producing taxa (grass silica short cell phytoliths [GSSCP] only) is given in column 4. Phytolith classes (1–5) are given in column 5.

Statistical Analysis
All statistical analyses were performed in R v. 4.0.3 (R Development Core Team 2019). All R codes are provided in the Supplementary Appendix.
The C3/C4 GSSCP ratio, corresponding to the climate index Ic (Bremond et al. Reference Bremond, Alexandre, Wooller, Hély, Williamson, Schäfer, Majule and Guiot2008b), was calculated as follows:
 $$Ic = \displaystyle{{{\rm Stipa\;type\;bilobate} + {\rm trapeziform\;trilobate} + {\rm trapeziform\;polylobate} + {\rm collapsed\;saddle} + {\rm rondel}} \over {{\rm short\;bilobate} + {\rm long\;bilobate} + {\rm short\;saddle} + {\rm long\;saddle} + {\rm cross}}}$$
To assess robustness of the calculated Ic values, 95% confidence intervals (CIs) were constructed using bootstrap analysis of 10,000 replicates (Strömberg Reference Strömberg2009). Linear regression was used to test the significance of the relationship between the proportion of C4 grass phytoliths over the total GSSCP count (i.e., 1 − Ic) and the proportion of C4 grasses at our sites. We used a generalized linear model (R function glm) with a logit-link function to build a transfer function for MAT. The logit-link function converts the phytolith C4 proportion Y to the logarithm of the ratio  ${Y \over {( {1-Y} ) }}$ in order to make the data suitable for regression. Thus, we fit the following equation to our data:
 $${\rm log}\left({\displaystyle{{Y_i} \over {1-Y_i}}} \right) = {\rm \beta }_0 + {\rm \beta }_1T + w$$
where β values correspond to the intercepts, and T corresponds to MAT. To account for potential error due to differences in sample size, we assigned a weight (w) to samples according to their CIs so that phytolith assemblages with wider CIs have smaller weight in the regression fit than assemblages with narrower CIs (see Harris et al. Reference Harris, Strömberg, Sheldon, Smith and Vilhena2017). We calculated w as follows:
 $$w = \displaystyle{1 \over {( {( {Y_i^{upper} -Y_i} ) + 0.1} ) }}$$
where Y i corresponds to 1 − Ic and  $Y_i^{upper} $ is the upper bound (upper CI) of Y i. To deal with cases where Y i = 0, which lead to
 $Y_i^{upper} = Y_i$, and w = 0, we added an additional small weight (0.1) into the denominator of the equation.
Differences in GSSCP compositions between sites were evaluated using nonmetric multidimensional scaling (NMDS; R function metaMDS) on the GSSCP morphotype relative abundance matrix (see Crifò and Strömberg Reference Crifò and Strömberg2021). We used tests of stress value randomization (R function nmds.monte) to determine the minimum number of dimensions required to capture the variation in the data. Further, we used correspondence analysis (CA; R function cca) to evaluate the influence of environmental gradients (i.e., MAT, MAP, and elevation) on GSSCP compositional differences between sites. CA was carried out using the GSSCP morphotype relative abundance data and the log-transformed environmental variables (elevation, MAT, and MAP). For visual comparison of the stable carbon isotope and phytolith (1 − Ic) proxies, δ13C values obtained from the samples were plotted together with C4 proportions against MAT values. We used linear regression to test for a relationship between the proportion of C4 GSSCP and δ13C values of the samples and between the proportion of C4 GSSCP in the samples and the proportion of C4 grasses recorded by the floristic survey.
Results
C4 Grass Proportion from Floristic Survey and Phytolith Counts along Elevation and MAT Gradients
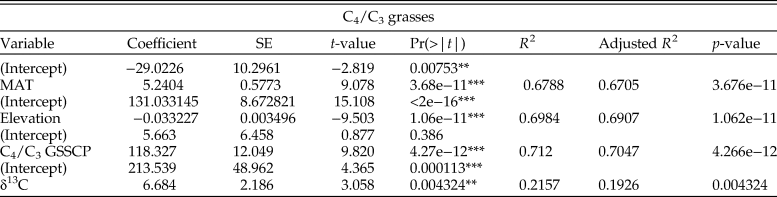
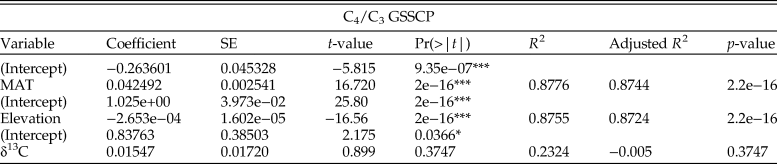
The proportion of C4 grasses shows a positive relationship with MAT and a negative relationship with elevation (p << 0.001; R 2 = 0.68 and 0.7, respectively; Table 2). Linear regression analysis also indicates a positive relationship between the C4 grass proportion from the floristic survey and the C4 grass proportion estimated from phytolith assemblages (i.e., 1 − Ic) (p << 0.001; R 2 = 0.71; Table 2). In addition, the C4/C3 GSSCP proportion is positively related to MAT and negatively related to elevation (p << 0.001; R 2 = 0.88 for both regressions; Table 3).
Statistics of the linear regression between C4/C3 grass proportion of the samples, and MAT, elevation of the sites, C4/C3 GSSCP (grass silica short cell phytoliths) proportion of the samples, and the δ13C of the samples. *p < 0.05; **p < 0.001; ***p ≈ 0.

Statistics of the linear regression between C4/C3 grass silica short cell phytoliths (GSSCP) proportion of the samples, and MAT, elevation of the sites, and the δ13C of the samples. *p < 0.05; **p < 0.001; ***p ≈ 0.

Influence of Environmental Gradients on the Distribution of GSSCP Morphotypes across Sites
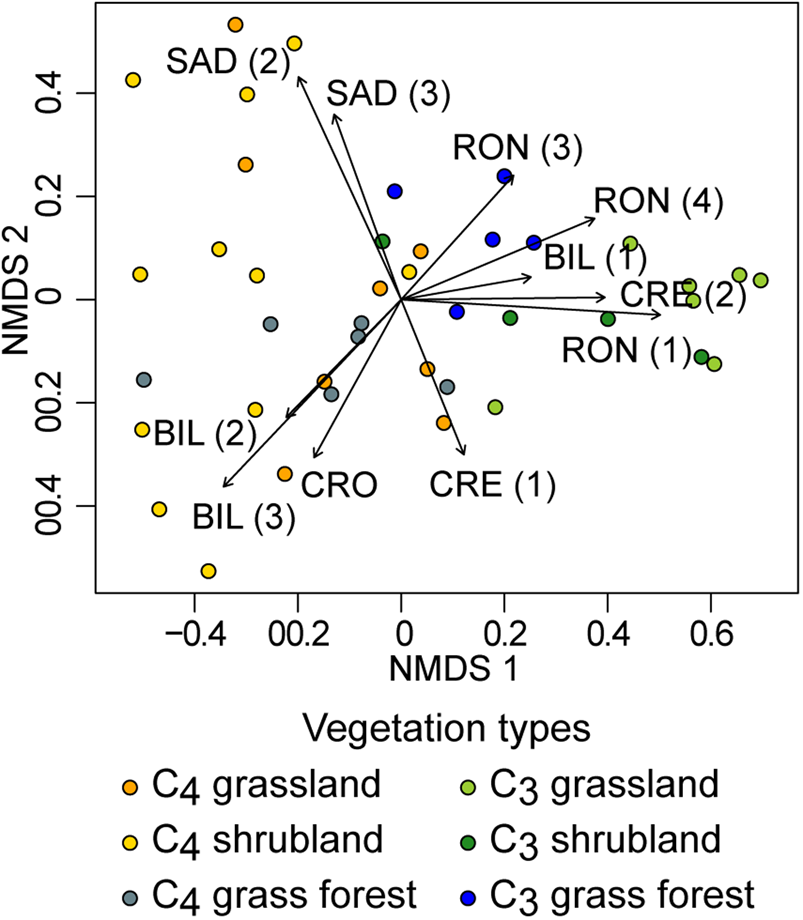
NMDS ordination of the sites performed on GSSCP assemblage composition adequately represents the data using two dimensions (NMDS, stress value = 0.14; test of stress value randomization, p < 0.01). Phytolith morphotype counts are provided in Supplementary Table 2. On NMDS axis 1 (Fig. 3), positive loadings are represented by “regular” (RON_1) “truncated” (RON_3), and “keeled” (RON_4) Rondel morphotypes (p < 0.001), “trapeziform polylobate” (CRE_2) Crenate morphotypes (p < 0.001), and by “Stipa-type” (BIL_1) Bilobate morphotypes (p < 0.05); while negative loadings are represented by “short” (BIL_2) and “long” (BIL_3) Bilobate and Cross (CRO) morphotypes (p < 0.001). On NMDS axis 2, positive loadings are represented by the “short” (SAD_2) and “long” (SAD_3) Saddle morphotypes (p < 0.001); while negative loadings are represented by “trapeziform trilobate” (CRE_1) Crenate morphotypes (p < 0.001), “short” (BIL_2) and “long” (BIL_3) Bilobate morphotypes (p < 0.001), and Cross (CRO) morphotypes (p < 0.001). Sites dominated by C3 grasses tend to group toward the positive end of NMDS axis 1 as opposed to C4 grass–dominated sites, which are grouped toward the negative end. Among C4 grass–dominated sites, C4 grasslands and C4 shrublands are spread along NMDS axis 2, while C4 grass forests tend to be grouped toward the negative side of the axis.
Nonmetric multidimensional scaling (NMDS) ordination of the phytolith assemblages across sites (colored dots), and phytolith classes (black vectors). Only phytolith classes with significant (p < 0.05) loadings on the ordination axes are shown here. Vector direction indicates maximum correlation of the phytolith classes with between-sample scores in the ordination space. Sample sites are colored according to vegetation type (see figure key).

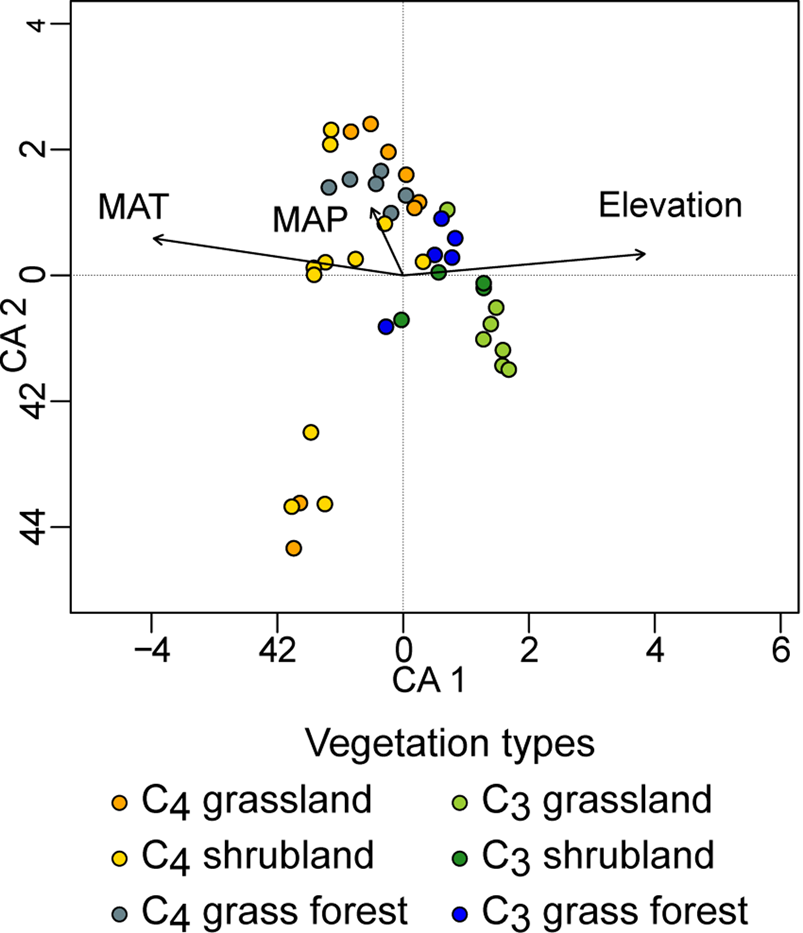
CA ordination of the sites performed on the site GSSCP assemblage composition (counts) by environmental variables (MAP, MAT, and elevation) shows a similar pattern of site distribution (Fig. 4). The first two axes of the CA ordination account for respectively 43% and 15% of the total variation. CA axis 1 describes a negative MAT gradient (p < 0.001) opposite to a positive elevation gradient (p < 0.01). C4-dominated sites are distributed toward the negative end of this axis, as opposed to C3-dominated sites, which are distributed toward the positive end. Most C4-dominated sites tend to group toward the positive end of CA axis 2, with the exception of five sites that appear to form an isolated cluster toward the negative end of CA axis 2. The positive loading of MAP on this axis is not significant (p > 0.05).
Correspondence analysis (CA) ordination of the phytolith assemblages across sites (colored dots), and environmental variable (black vectors). Sample sites are colored according to vegetation type (see figure key).

Predicted Temperature as a Function of C4 Phytolith and C4 Grass Proportion
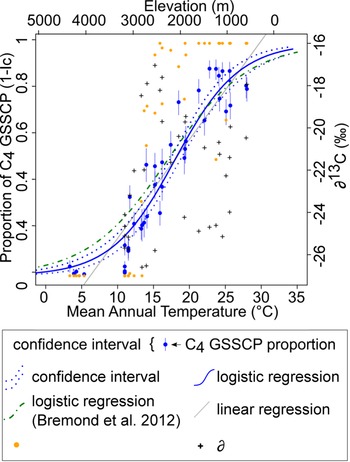
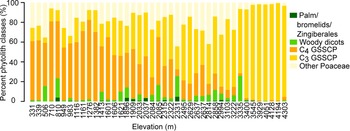
Logistic regression shows that the C4 GSSCP proportion is a good predictor of MAT. C4 phytolith and grass proportions increase with MAT following a sigmoidal growth pattern (p << 0.001; Fig. 5). Accordingly, at lower temperatures (i.e., MAT < 12°C) and high elevation, the C4 GSSCP proportion is low, and close to zero in several assemblages (Fig. 6). These assemblages are dominated by Rondel, “Stipa-type” Bilobate, and Crenate phytolith morphotypes (Fig. 3), which are assigned to grass subfamilies in the C3 BEP clade (Bambusoideae, Ehrhartoideae, and Pooideae). The proportion of C4 phytoliths sharply increases at higher temperatures. Saddle, Cross, and “short” and “long” Bilobate phytolith morphotypes, assigned to the C4 clade PACMAD, dominate these assemblages (Figs. 3, 6). However, unlike C4 GSSCP, C3 GSSCP are present across the entire temperature (and elevation) range.
Proportion of C4 grass phytoliths (GSSCP) and carbon isotope ratios (δ13C) of samples against mean annual temperature (MAT; lower x-axis) and mean annual precipitation (MAP; upper x-axis). Blue dots represent estimates of C4 GSSCP proportion from phytolith counts; vertical blue bars correspond to 95% confidence intervals (CIs) calculated by bootstrap analysis of each sample. Black crosses represent carbon isotope ratios (δ13C) of the samples. Solid and dotted blue lines represent, respectively, the logistic regression curve performed between the proportion of C4 GSSCP in phytolith assemblages and MAT (p << 0.01), and the upper and lower CI bounds. The solid gray line represents the linear regression (p << 0.001, R 2 = 0.87) performed between the proportion of C4 GSSCP in phytolith assemblages and MAT. Orange dots represent the C4 proportion in the study sites (calculated from the floristic survey). The dot-dashed green line represents the logistic regression based on a compilation of floristic data for Colombia, Ecuador, Peru, and Bolivia in Bremond et al. (Reference Bremond, Boom and Favier2012) (p << 0.01).

Phytolith assemblages organized according to increasing elevation. Bars represent percentage of phytolith classes. Palm phytoliths include Spheroid echinate morphotypes; woody dicot phytoliths include Spheroid psilate and Spheroid ornate morphotypes; C3 grass silica short cell phytoliths (GSSCP) include “Stipa-type” Bilobate [BIL (1)], Rondel (RON), Crenate (CRE), and “collapsed” Saddle [SAD (1)] morphotypes; C4 GSSCP include “short” and “long” Bilobate [BIL (2) and BIL (3)], short” and “long” Saddle [SAD (2), and SAD (3)], and Cross (CRO) morphotypes; other Poaceae morphotypes include Bulliform flabellate (BUL_FLA), Blocky (BLO), Acute bulbosus (ACU_BUL), and Papillate (PAP) morphotypes.

Relationship between C4 GSSCP Proportion and Carbon Isotope Ratio
The δ13C values of the samples span −17.04‰ to −26.59 ‰ (Fig. 5B), corresponding mainly to intermediate C3–C4, and C3 vegetation signatures (Cerling et al. Reference Cerling, Harris, MacFadden, Leakey, Quade, Eisenmann and Ehleringer1997b). Linear regression indicates no significant relationship between the carbon δ13C values and the proportion of C4 GSSCP in the samples (p >> 0.05; Table 3). Likewise, sample δ13C values have no significant relationship with environmental factors (elevation, MAT, and MAP) (p >> 0.05; Supplementary Table 5) but are weakly related to the C4 grass proportion of the sites (p < 0.01; R 2 = 0.21; Table 2).
Discussion
Relationship between the Ic Index and C3–C4 Grass Distribution
Overall, the grass floristic survey and phytolith counts reflect C3–C4 grass distribution along elevation and temperature gradients, as previously documented in the region (Bremond et al. Reference Bremond, Boom and Favier2012). However, MAT and elevation explain most of the variation in 1- Ic phytolith index but explain variations in C4/C3 grass proportions from the floristic surveys only to a lesser extent. Further, at least some of the variation in 1- Ic seems to not be explained by variation in C4/C3 grass proportions from the floristic surveys. Floristic data indicate higher C4/C3 grass proportions at high temperatures and lower C4/C3 grass proportions at lower temperatures compared with the phytolith data. These inconsistencies might have several explanations. First, the floristic survey provides instantaneous estimates of C4/C3 grass proportion on a small spatial scale. The C4/C3 grass proportion can vary in relation to the botanical survey season and to local conditions, such as microclimate and topography, and in response to short-term climate fluctuations. Thus, it might not be representative of the vegetation on a wide spatial and temporal scale; instead, it might reflect super-local vegetation and environmental conditions. In contrast, C4/C3 phytolith abundance from soil surface samples does not represent a real-time snapshot of the vegetation, because a phytolith assemblage typically reflect tens to hundreds of years of vegetation occurrence (Song et al. Reference Song, McGrouther and Wang2016). Further, our floristic survey was conducted in a semiquantitative way and only provides estimates of relative C4/C3 grass cover. Error associated with these estimates could explain at least in part the mismatch between the floristic survey data and the phytolith signal. Furthermore, although phytolith production should be similar among C3 and C4 grasses growing in the same habitat and under identical environmental conditions (Brightly et al. Reference Brightly, Hartley, Osborne, Simpson and Strömberg2020), the relative proportion of different diagnostic phytolith morphotypes produced for a given plant biomass varies among species and might result in C3/C4 proportion under- or overestimation. In addition, coarse classification of Rondel morphotypes (which are all grouped at the numerator of the Ic equation, as diagnostic of C3 grasses) might result in potential underestimation of C4 grass abundance (which also produces these morphotypes). However, the error associated to potentially erroneous Rondel classification is unknown, because data on the production of different morphotypes by different species are not available (see also Supplementary Appendix). Finally, the influence of taphonomic biases on C3/C4 GSSCP proportion can be reasonably excluded, because the phytolith assemblages extracted from the samples are all finely preserved and do not present evidence of differential preservation or dissolution.
The C4/C3 GSSCP Proportion as a Paleotemperature Proxy
Our model, based on logistic regression, performs better than models based on linear regression (i.e., Biswas et al. Reference Biswas, Ghosh, Agrawal, Morthekai, Paruya, Mukherjee, Bera and Bera2021) and is in line with the temperature crossover model (Ehleringer et al. Reference Ehleringer, Cerling and Helliker1997; Collatz et al. Reference Collatz, Berry and Clark1998; Still et al. Reference Still, Berry, Collatz and DeFries2003) and with previous work (Bremond et al. Reference Bremond, Boom and Favier2012). Indeed, the relationship between C4/C3 GSSCP proportion and temperature is not linear, due to the combined effect of the presence of C3 grasses across the entire elevation and temperature range and of a crossover temperature (at which the proportion of C4 grasses, and thus of C4 GSSCP, equals that of C3 grasses, and thus of C3 GSSCP). This results in a sigmoidal “growth” pattern of the C4/C3 GSSCP proportion that is best described by logistic regression. Thus, the transfer function developed herein can be used to obtain paleotemperature estimates in the fossil record of the Andean region. Nevertheless, the accuracy of our model also relies on the fact that phytolith assemblages constitute a local vegetation signal and on our choice of restricting soil sampling to open areas. In fact, in mountain forests, grass species belonging to the subfamily Panicoideae (which has both C3 and C4 representatives) and inhabiting forest understory often use C3 photosynthesis. At intermediate elevation (where mountain forest occurs), their presence can therefore bias the C4/C3 proportion toward higher values. While our sampling strategy enabled us to limit such bias associated to the presence of C3 grasses of the subfamily Panicoideae (by sampling preferentially in open-vegetation areas), it might complicate the interpretation and subsequent use of the transfer function to estimate MAT (which might be potentially overestimated) from fossil phytolith assemblages, where the vegetation type is unknown. As a consequence, for correct application of this method for paleotemperature reconstructions, fossil phytolith assemblages should first be studied in detail (including forest indicator phytoliths) in order to preferentially select those representing open-canopy vegetation. Phytolith-based vegetation indices commonly used to assess canopy cover, such as the D/P index (the sum of Spheroid ornate phytoliths, produced by many tropical ligneous dicotyledonous, over the sum of Poaceae phytoliths; Alexandre et al. Reference Alexandre, Meunier, Lezine, Vincens and Schwartz1997) and the FI-t ratio (the sum of forest indicator phytoliths morphotypes over the sum of all morphotypes; Strömberg et al. Reference Strömberg, Werdelin, Friis and Saraç2007b), should be used.
Relationship between the C4/C3 GSSCP Proportion and the Carbon Isotope Ratio (δ13C)
Soil carbon isotopic ratios (δ13C), are not consistent with the Ic index and the C3–C4 grass composition from floristic surveys along elevation and temperature gradients. In fact, most δ13C values indicate C3 or mixed C3–C4 vegetation, while none of the samples is characterized by δ13C values indicative of C4-dominated vegetation. This discrepancy can be explained by several factors. First, the soil δ13C signature represents a mixed vegetation signal (which reflects the presence of grasses as well as forbs, shrubs, and trees) rather than a pure grass signal. Because the relationship between the prevalence of C3 versus C4 photosynthesis and temperature differs in grasses and trees, a certain degree of inconsistency between C3–C4 grass abundance from floristic surveys and soil δ13C values, as well as between temperature and δ13C values, is expected. However, as mentioned earlier, in order to obtain a δ13C signal representative mostly of the grass component of the vegetation, sample collection was deliberately conducted in open-canopy areas only. Thus, other factors must explain the poor match between δ13C, C4/C3 GSSCP proportion, and grass community composition. C3 and C4 plants display δ13C spectra that are quite wide and result in a bimodal distribution of δ13C values (Cerling et al. Reference Cerling, Harris, MacFadden, Leakey, Quade, Eisenmann and Ehleringer1997b), which renders interpretations of C4 grass abundance based on δ13C values particularly complex. Additionally, time averaging of the soil might result in δ13C values representing a mix of past and present vegetation, and less negative δ13C values might record past vegetation shifts between closed and open canopy in sites that today are dominated by C4 grasses. However, biases related to time averaging also would have affected the phytolith record (e.g., Harris et al. Reference Harris, Strömberg, Sheldon, Smith and Vilhena2017). We found no evidence for such bias in the phytolith assemblages. Nonetheless, it is possible that the shorter turnover time of phytoliths compared with the δ13C counteracts the effect of time averaging on phytolith assemblages but not on the carbon isotopic ratio of the samples (Aleman et al. Reference Aleman, Leys, Apema, Bentaleb, Dubois, Lamba, Lebamba, Martin, Ngomanda, Truc, Yangakola, Favier, Bremond and Woods2012). Pedogenic and diagenetic alteration could also bias δ13C values (e.g., Chen et al. Reference Chen, Smith, Sheldon and Strömberg2015) but should also result in phytolith preservation biases. In light of the good preservation of the phytolith samples, pedogenic and diagenetic alteration can be excluded. Finally, differences between the C3–C4 grass signal of δ13C and phytoliths may also be due to differential degradation of organic matter. Higher decomposition rates have been observed for C4 organic material compared with C3 organic material in mixed C3–C4 soils (Wynn and Bird Reference Wynn and Bird2007) and could explain less negative δ13C ratios, at least in mixed C3–C4 vegetation areas (Cotton et al. Reference Cotton, Sheldon and Strömberg2012).
Applications to the Deep-Time Fossil Record
The application of the new proxy proposed herein is of particular interest in tropical montane, high-elevation ecosystems where available paleotemperature proxies tend to be scarce—at lower elevations, the Ic index is less accurate due to the abundance of several C3 tropical grasses in closed-canopy tropical ecosystems. The use of the Ic index to reconstruct paleotemperature is independent of whether the paleoelevation of a fossil site is known. However, paleoelevation data might improve paleoclimatic interpretations based on the Ic index. For instance, a change in temperature in the absence of a shift in elevation might be the result of global climate change as opposed to local temperature decrease, which might be driven by mountain building. In the Andean region, the application of the Ic index to the deep-time phytolith record has the potential to advance our understanding of the expansion of grasses and grass-dominated ecosystems across the region. However, there are some caveats. First, the application of our model to the deep-time record assumes that the relationship between C3–C4 grass distribution and MAT observed today also occurred in the past. Indeed, other factors, such as aridity and atmospheric pCO2, are known to influence C3–C4 grass distribution. While increasing evidence points to relatively stable pCO2 level during at least the last 7 Ma, and possibly since 23 Ma (Cui et al. Reference Cui, Schubert and Jahren2020), the uplift of the Andes is thought to have driven a progressive shift toward aridification, the timing and magnitude of which are still debated (Martínez et al. Reference Martínez, Jaramillo, Correa-Metrío, Crepet, Moreno, Aliaga, Moreno, Ibañez-Mejia and Bush2020). Caution is therefore required, and phytolith-based inferences should be coupled with other proxies. Second, the temporal range to which the proposed proxy can be applied is dependent on the timing of the expansion of C4 grasses and C4-dominated habitats. Although the use of the C4 photosynthetic pathway developed at least since the Oligocene (Edwards et al. Reference Edwards, Osborne, Strömberg, Smith, Consortium, Bond, Christin, Cousins, Duvall, Fox, Freckleton, Ghannoum, Hartwell, Huang, Janis, Keeley, Kellogg, Knapp, Leakey, Nelson, Saarela, Sage, Sala, Salamin, Still and Tipple2010) or even earlier during the Paleocene (Gallaher et al. Reference Gallaher, Akbar, Klahs, Marvet, Senske, Clark and Stromberg2020), the expansion of C4 grasses has not been documented until the late Miocene, starting at around 8 Ma (Cerling et al. Reference Cerling, Harris, MacFadden, Leakey, Quade, Eisenmann and Ehleringer1997b; Strömberg Reference Strömberg2011). In South America, the grass fossil record is scarce, and most of our knowledge on the expansion of grasslands comes from Patagonia (Strömberg Reference Strömberg2011), where C3 grasses remained dominant at least until the early Miocene (ca. 20 Ma), whereas grassland expansion did not take place until the early-late Miocene (ca. 10 Ma) (Barreda and Palazzesi Reference Barreda and Palazzesi2007; Strömberg et al. Reference Strömberg, Dunn, Madden, Kohn and Carlini2013; Dunn et al. Reference Dunn, Strömberg, Madden, Kohn and Carlini2015). In northern South America, it has been hypothesized that the retreat of the Pebas system and the establishment of the Amazon drainage basin around 9 Ma (Hoorn et al. Reference Hoorn, Wesselingh, ter Steege, Bermudez, Mora, Sevink, Sanmartin, Sanchez-Meseguer, Anderson, Figueiredo, Jaramillo, Riff, Negri, Hooghiemstra, Lundberg, Stadler, Sarkinen and Antonelli2010) favored the expansion of grasses in the newly established ecosystems of the Andean slopes and floodplains. The expansion of grasses in Andean ecosystems would have been further favored by Andean orogenesis and subsequent climate change (Kirschner and Hoorn Reference Kirschner and Hoorn2020) creating new ecological niches. By the Plio-Pleistocene, the Andes had reached near-modern elevations (Gregory-Wodzicki Reference Gregory-Wodzicki2000; Garzione et al. Reference Garzione, McQuarrie, Perez, Ehlers, Beck, Kar, Eichelberger, Chapman, Ward, Ducea, Lease, Poulsen, Wagner, Saylor, Zandt and Horton2017), and the first Paramo and Puna-like ecosystems are reported around 5 Ma (Bermúdez et al. Reference Bermúdez, Hoorn, Bernet, Carrillo, van der Beek, Garver, Mora and Mehrkian2017; Martínez et al. Reference Martínez, Jaramillo, Correa-Metrío, Crepet, Moreno, Aliaga, Moreno, Ibañez-Mejia and Bush2020). No data recording the occurrence of C4 grasses in these ecosystems are currently available, although work is in progress in the Bolivian and Peruvian Altiplano (e.g., B. Saylor personal communication 2021; C.C. personal observations). Thus, we argue that phytolith based paleotemperature reconstructions in the region might be reasonably made onwards from at least the late-Miocene-early Pliocene. Finally, local calibrations of the Ic index, may allow its application to montane regions across a wider geographic range.
Conclusion
The relationship between C3–C4 grass distribution and climate has long been studied. Likewise, in the last two decades, the notion that phytoliths provide accurate reconstruction of grass community composition has been widely recognized. However, only a handful of studies have focused on grass phytoliths as a tool for reconstructing paleoclimate quantitatively. Our study is the first to use the proportion of C4/C3 GSSCP in soil samples collected along an elevation gradient to develop a paleothermometer in the Andean region. Our data also support the notion that grass phytoliths represent grass community composition, and in particular the proportion of C3 versus C4 grasses, more accurately than indirect proxies such as the carbon isotope ratio of soil organic matter. Moreover, the use of phytoliths presents several advantages over other direct and indirect grass vegetation proxies, which are either rarely available in the fossil record (e.g., grass macrofossils, pollen grains, or leaf cuticles) or subject to many biases (e.g., leaf wax n-alkanes, δ13C of soil carbonates, and herbivore tooth enamel).
Applications of this new tool include paleoclimatic and paleoenvironmental reconstructions in the Andean region from at least the late Miocene–early Pliocene on. Coupling this new method with the analysis of whole phytolith assemblages and with other proxies will improve paleoclimatic and paleoenvironmental reconstructions in the Andes, potentially contributing a better understanding on the complex dynamics involving tectonics, climate, and vegetation that shaped most modern Andean ecosystems.
Based on the strong, inverse relationship between temperature and elevation, future work should focus on the development of the Ic index as a tool for paleoaltimetry. However, this requires accurate calibrations. The link between C3/C4 grass distribution and elevation is only indirect and relies on the relationship between temperature and elevation. Thus, changes in regional and temporal factors that might influence temperature must be taken into account. For instance, calibrations of the Ic index as a paleoaltimetry proxy should include modeling C3/C4 grass distribution along temperature and elevation gradients under varying pCO2.
Acknowledgments
We thank M.-P. Ledru for providing Paramo samples from Ecuador. We also want to thank C. L. Yost and two other anonymous reviewers for their thorough reviews, which contributed to improve the quality of this article. This work was initiated during the Intra-European Marie Curie Fellowships of L.B. (MEIF-CT-2005-024625).
Data Availability Statement
Data available from the Dryad Digital Repository: https://doi.org/10.5061/dryad.p5hqbzksk.