Introduction
An agricultural insect pest outbreak can be defined as a rapid increase in the abundance of an insect. Such outbreaks are often triggered by large and rapid alterations in environmental conditions, including climate, population size of hosts and natural predators. Some insect outbreaks, such as those of highly mobile or human-transported pest species, are expansive and spread from an epicenter to cover a large area. Alternatively, an outbreak can be restricted to a given area if a native population is adapted to the local environment, thereby providing some protection against immigrants (Berryman, Reference Berryman, Barbosa and Schults1987; Charles & Schneider, Reference Charles, Schneider, Barbosa and Schults1987; de la Poza et al., Reference de la Poza, Farinós, Beroiz, Ortego, Hernández-Crespo and Castañera2008). Thus, the dynamics of an insect outbreak depend on the potential for establishment, mobility and local colonization of pestiferous populations. When an outbreak of pest insects occurs in a large area, it must be derived from a single spreading source or from multiple local sources of outbreak events. Understanding the mechanism of an outbreak spread is important in applied insect ecology because it directly affects the development of management strategies, including predicting the spread of genes resistant to insecticides or transgenic crops (Endersby et al., Reference Endersby, McKechnie, Ridland and Weeks2006; de la Poza et al., Reference de la Poza, Farinós, Beroiz, Ortego, Hernández-Crespo and Castañera2008), determining regional boundaries of control program (Porretta et al., Reference Porretta, Canestrelli, Bellini, Celli and Urbanelli2007), implementing strategies to prevent further damage and the establishing eradication program (Kim et al., Reference Kim, Cano-Ríos and Sappington2006).
Population genetic analysis is a useful tool to examine the outbreak process because genetic variability reflects the demographic history of a population (Avise, Reference Avise2000). Genetic responses to environmental changes and gene flow are key factors in the population dynamics of insect outbreaks (Wallner, Reference Wallner1987; Mopper, Reference Mopper1996; Porreta et al., Reference Porretta, Canestrelli, Bellini, Celli and Urbanelli2007). Numerous studies based on molecular markers have successfully identified the sources or tracked the colonization routes of outbreak populations of invasive pest species (Kolar & Lodge, Reference Kolar and Lodge2001; Mun et al., Reference Mun, Bohonak and Roderick2003; Novak, Reference Novak2007). In contrast, studies on the genetic structure of native pest species have generally received limited attention (but see Shufran et al., Reference Shufran, Burd, Anstead and Lushai2000; Yu et al., Reference Yu, Frommer, Robson, Meats, Shearman and Sved2001; Anstead et al., Reference Anstead, Burd and Shufran2002). In Japan, 8% (2201 species) of native insects are designated as pests, and the mechanisms by which these pest species emerge and expand are of great concern to pest management (Morimoto & Kiritani, Reference Morimoto and Kiritani1995). In this study, we focused on the mirid bug, Stenotus rubrovittatus (Matsumura), a native pest species of rice that experienced extensive and rapid outbreak events during the past two decades. The processes involved in an outbreak event were analyzed from a population genetics approach with particular focus on assessing whether the outbreaks originated from immigrant or resident populations.
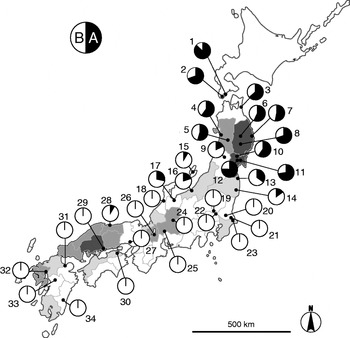
Stenotus rubrovittatus (Hemiptera: Miridae) is a phytophagous mirid bug that is distributed throughout East Asia. In Japan, S. rubrovittatus was a rare species with limited distribution (Yasunaga et al., Reference Yasunaga, Takai, Kawasawa and Nakatani2001) until outbreaks on rice (Oryza sativa L.) were reported in the 1980s. The first serious damage occurred in 1983 in Miyagi prefecture, northern Japan (Takahashi et al., Reference Takahashi, Nagano and Sato1985). The following year, another outbreak occurred in Hiroshima prefecture, in southwestern Japan (Hayashi, Reference Hayashi1986), 1100 km from the first outbreak. Damage caused by S. rubrovittatus remained limited to areas in and around these two regions until as recently as 2000. Thereafter, damage caused by the pest increased rapidly across Japan. Currently, S. rubrovittatus occupies most of the rice culture areas, except Hokkaido and Ryukyu islands (Watanabe & Higuchi, Reference Watanabe and Higuchi2006). New infestations on rice have been found in areas both adjacent to and distant from early outbreak regions (fig. 1). An increased frequency of outbreak reports of S. rubrovittatus has created controversy as to whether these represent an expansion of a specific pestiferous strain adapted for outbreak events or whether independent local outbreaks were responsible for the rapid expansion. Because of the recent and rapid increase in population sizes and new infestations, S. rubrovittatus provides an attractive model for studying how outbreaks of native species occur and expand over extensive areas within a short period of time.
Study locations of S. rubrovittatus, the expansion of S. rubrovittatus outbreaks observed in Japanese rice culture areas and distribution of the haplotype lineages A and B for COI region. The outbreak years were based on the data from Ministry of Agriculture, Forestry and Fisheries, Japan (−1990  ; −2004
 ; −2007
 ). Locality numbers correspond to those in table 1. Pie charts indicate the frequencies of the haplotype lineages at each sampling location.

During the ear heading stage of rice in the summer, a number of S. rubrovittatus adults invade neighboring rice fields where they infect rice panicles. Field and laboratory experiments have identified many plants of the Poaceae family that possess phenotypic characteristics suitable for feeding and oviposition of the mirid bug (Goto et al., Reference Goto, Ito and Shishido2000). Most Poaceae are annual grasses commonly found in rice culture areas. Growing evidence suggests that the foreign feed crop Lolium multiflorum played an important role in the recent increase of the population size of S. rubrovittatus (Kakizaki, Reference Kakizaki2004; Katase et al., Reference Katase, Shimizu, Shiina, Hagiwara and Iwai2007). L. multiflorum was introduced into Japan in the late 1800s and has been widely used as a feed crop or ground cover plant for the past 40 years. The spread of L. multiflorum in the rice culture areas is one of the causes of early outbreaks of this previously rare bug species (Hayashi, Reference Hayashi1986; Tanaka et al., Reference Tanaka, Chiba, Fujioka, Chiba, Ito and Nakaminami1988). Further, global warming and shifts in transplanting time of rice are also suggested to contribute to the outbreak (Kiritani, Reference Kiritani2006; Watanabe & Higuchi, Reference Watanabe and Higuchi2006).
We collected local populations of S. rubrovittatus and analyzed their genetic structure to address the following questions:
(i) Are local populations of Japanese S. rubrovittatus genetically distinct?
(ii) Is there any relationship between phylogeography and expansion pattern of the outbreak populations?
(iii) Is the recent increase of S. rubrovittatus outbreaks caused by independent outbreaks of local populations (environmental factors) or derived from a single outbreak followed by dispersal (genetic factors)?
We employed a dual approach of mitochondrial DNA sequencing and genotyping of six microsatellite markers. The maternally inherited mtDNA that is highly variable and biparentally inherited microsatellites would reflect the evolutionary process at different time scales; therefore, assessing spatial patterns of both markers is likely to provide more complete evidence of historical and geographic barriers to gene flow. Further, the concordance of contemporary genetic isolation by distance in both markers might be useful to explain the outbreak process of the mirid bug. Based on the obtained results, the factors related to the increased frequency of outbreaks of S. rubrovittatus and effective management strategies for decreasing the subsequent economic loss are discussed.
Materials and methods
Sample collection
Stenotus rubrovittatus adults were collected between August 2005 and September 2008 from 34 locations covering the distribution range of this species in Japan (supplementary table 1, fig. 1). Samples were collected using a sweep net and were immediately placed in 70–100% ethanol and stored until DNA extraction. To avoid collecting relatives, the insects were collected by sweeping an area at least 50 m2 at each sampling location. The vegetation of the sampling locations included uncultivated grasses (20 samples), cultivated L. multiflorum (12 samples) or rice (2 samples).
DNA extraction and COI sequencing
Genomic DNA was extracted from individuals using the GenomicPrep Cells and Tissue DNA isolation kit according to the manufacturer's instructions (GE Healthcare, Piscataway, USA). A 1204 bp fragment of the mitochondrial cytochrome oxidase subunit I (COI) gene was amplified by polymerase chain reaction (PCR) using the primer F1 (5′-CATTTTTGGGATATGAGCAGGT-3′) and R1 (5′-CACCAATGAATATAGTGAAAAATTGA-3′). These primers were designed from an S. rubrovittatus COI sequence cloned from conserved regions based on comparisons of published mtDNA sequences of three species of Miridae (Genbank accession AF189240, AY253086, AF493569). PCR was performed on 50–100 ng of genomic DNA in 30 μl of reaction mixture (20 mM Tris-HCl, pH 8.0/50 mM KCl/1.5 mM MgCl2/200 μM of each dNTP/0.5 μM of each oligonucleotide primer/0.75 unit of Taq DNA polymerase (Invitrogen Ltd, Paisley, Scotland)). PCR amplification was performed with the following conditions: 1 cycle for 1 min at 94°C, 33 cycles of 30 s at 94°C, 30 s at 53°C, 30 s at 72°C, followed by final extension at 72°C for 10 min. Sequencing reactions were carried out using three forward primers, F1, F2 (5′-GGATGAACAGTATACCCACCA-3′) and F3 (5′-TTTTTGGTCACCCCAGAAGT-3′), and a reverse primer R1. The primers F2 and F3 were designed within the COI sequence. Sequencing products were visualized on an ABI310 genetic analyzer (Applied Biosystems Inc, Foster, USA), and a contiguous sequence of 1032 bp from each individual was analyzed. Sequences obtained from 39 haplotypes of COI were deposited in the DDBJ/EMBL/Genbank nucleotide sequence databases (Genbank accession nos AB518887–AB518925).
Microsatellite amplification and genotyping
Polymorphisms of six microsatellites of S. rubrovittatus, A03, A32, A33, A38, C5 and C61 (Kobayashi, Reference Kobayashi2008), were analyzed. PCRs were performed on 10–40 ng of genomic DNA in 10 μl of reaction mixture (20 mM Tris-HCl/50 mM KCl/1.5 mM MgCl2/200 μM of each dNTP/0.5 μM of each oligonucleotide primer/0.25 unit of Taq DNA polymerase). PCR amplification was performed with the following conditions: 1 cycle for 1 min at 94°C, 35 cycles of 30 s at 94°C, 30 s at 53°C and 30 s at 72°C, followed by a final extension at 72°C for 10 min. Either the forward or reverse primer of the microsatellites was labeled with the fluorescent dyes 6-FAM, HEX and NED at the 5′ end. The resulting PCR products were sized on an ABI 310 genetic analyzer using Gene Scan 500 size standard and GENESCAN 3.1.2 software (Applied Biosystems Inc, Foster, USA).
Mating compatibility between two haplotype lineages
Twelve virgin adult females and six adult males were used in this experiment. Two females and one male were placed into a glass cylinder of 76 mm height and 24 mm diameter and allowed to mate. After 72 h, each female was transferred separately to a new cylinder and reared until egg collection. Eggs were deposited in the plant stems and were kept under a 16L:8D photoperiodic regime at 25±1°C. Hatched nymphs were counted seven to ten days after deposition and were reared on the seedlings until adult emergence. F1 and F2 progeny were produced by sib-crossing each pair. DNA was extracted individually from F0 parents and their progeny, and mtDNA lineages (A or B) were identified by analyzing the partial sequences.
Data analysis of mitochondrial COI sequences
Nei's haplotype diversity (G ST) (Nei & Tajima, Reference Nei and Tajima1983) and pairwise population estimates of F ST (Weir & Cockerham, Reference Weir and Cockerham1984) and Slatkin's (Reference Slatkin1995) linearized F ST were computed using ARLEQUIN 3.1 (Excoffier et al., Reference Excoffier, Laval and Schneider2007). The relative influence of gene flow and drift on population structure can be tested by evaluating the associations between genetic and geographic distances of all pairwise population combinations (Huchinson & Templeton, Reference Hutchinson and Templeton1999). To detect this isolation by distance, matrices of pairwise estimates of genetic differentiation of Slatkin's F ST were compared with a matrix of ln-transformed geographic distances by means of a Mantel test (Mantel, Reference Mantel1967) with 10,000 permutations implemented in FSTAT 2.9.3 (Goudet, Reference Goudet1995). Spearman's correlation between haplotype diversity and latitude of each location was tested using the R statistical program (cor; R Ver 2.9.0.; R Development Core Team, 2005). To test the hypothesis that all mutations were selectively neutral (at equilibrium between genetic drift and selectively neutral mutation), Tajima's D-test (Tajima, Reference Tajima1989) and Fu's Fs-test (Fu, Reference Fu1997) were performed using ARLEQUIN 3.1. Tajima's D is based on the relationship between two estimates: the number of segregation sites and the average number of nucleotide differences. Negative D-values indicate excess of low-frequency haplotypes relative to mutation/drift equilibrium (Tajima, Reference Tajima1989). Fu's F S is based on the haplotype frequency distribution and provides a useful test for detecting population growth and genetic hitchhiking (Fu, Reference Fu1997). An unrooted statistical parsimony network of the COI haplotypes was created using TCS 1.21 (Clement et al., Reference Clement, Posada and Crandall2000).
Data analysis of microsatellites
Linkage disequilibrium and deviations from Hardy-Weinberg equilibrium (HWE) at each locus for each population were tested using GENEPOP 3.4 (Raymond & Rousset, Reference Raymond and Rousset1995). To explore the impact of putative null alleles, the frequency of null alleles was estimated in the program MICRO-CHECKER using the Oosterhout estimate (van Oosterhout et al., Reference van Oosterhout, Hutchinson, Wills and Shipley2004). Observed and expected heterozygosities and F ST were calculated using ARLEQUIN. Allelic richness and private allelic richness averaged over loci were calculated using HP-RARE version 1.2 (Kalinowski, Reference Kalinowski2005). This software uses a rarefaction statistical method and produces estimates unbiased by sample size. Spearman's correlation between latitude of each location and allelic richness, rare allelic richness or expected heterozygosity (after arcsine-square root transformation) was tested using the R statistical program. To assess the evidence of recent population size changes and bottlenecks, deviation from a neutral mutation-drift equilibrium model was tested using the program BOTTLENECK (Cornuet & Luikart, Reference Cornuet and Luikart1996). We used 1000 replicates of the two-phased model (TPM), with 70% of the mutations following a step-wise mutation model (SMM) and 30% following an infinite-alleles model (IAM). The Wilcoxon sign-rank test was used to determine whether heterozygote excess (recent population bottlenecks) or heterozygote deficiency (population expansions) was significant.
Bayesian clustering and phylogenetic tree
To estimate the number of genetic clusters (K) and the composition of clusters, Bayesian clustering analysis was applied to gene frequency data of mtDNA, microsatellites or both combined. The probable K was calculated using the BAPS version 5.2 program with the group level option without prior assumption about populations (Guillot et al., Reference Guillot, Estoup, Mortier and Cosson2005; Corander & Marttinen, Reference Corander and Marttinen2006). Ten replicate runs for each successive K from 2 to 10 were completed, and the K with the highest posterior probabilities was taken to be the best partition.
Phylogenetic trees based on pairwise F ST values calculated from the mtDNA sequence data were constructed using the neighbor-joining (NJ) subroutine in NEIGHBOR within PHYLIP 3.6 (Felsenstein, Reference Felsenstein1993). For the microsatellite data, 10,000 matrices of Cavalli-Sforza & Edward's (Reference Cavalli-Sforza and Edwards1967) chord distances from resampled data sets bootstrapped over loci were created using MICROSATELLITE ANALYSER (Dieringer & Schlötterer, Reference Dieringer and Schlötterer2003). Chord distance was chosen because it is less affected by null alleles than are other genetic distances (Chapuis & Estoup, Reference Chapuis and Estoup2007). An unrooted NJ tree was constructed using NEIGHBOR and CONSENSE within PHYLIP. The matrices of the mtDNA haplotype frequencies and those of allele frequencies in six microsatellites were combined and used to construct the combined phylogenetic tree. Ten thousand distance matrices bootstrapped over loci were created using SEQBOOT within PHYLIP. A consensus NJ tree was constructed using PHYLIP. All trees were visualized using TREEVIEW version 1.6.6 (Page, Reference Page1996).
AMOVA
A three-level hierarchical distribution of sequence variation in mtDNA or microsatellite polymorphisms among genetic clusters (fig. 5) or host plants of the sampling locations (supplementary table 3) was examined using an analysis of molecular variance (AMOVA: Excoffier et al., Reference Excoffier, Smouse and Quattro1992) using ARLEQUIN 3.1. The grouping schemes of the populations are detailed in supplementary table 3.
Results
Mitochondrial DNA
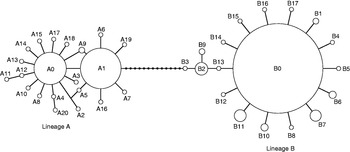
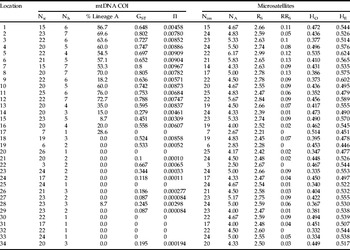
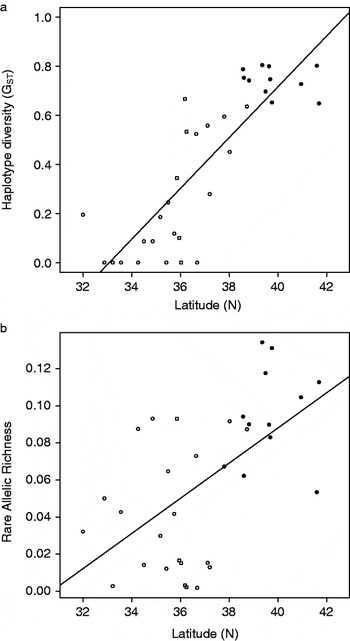
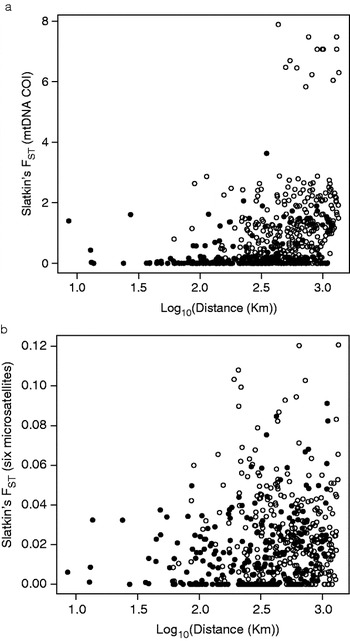
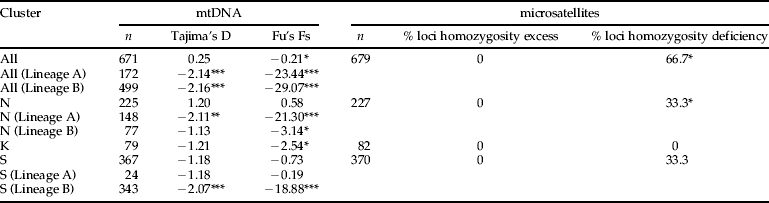
A total of 39 haplotypes of the COI gene were found in 671 sequenced individuals (19.7 individuals over locations in average; supplementary table 2). Ten of the haplotypes were shared, and therefore 29 haplotypes were unique to a single location. There were no insertions or deletions. We identified 40 transitions and five transversions. A parsimony network illustrating the relationship of the composite haplotypes indicated that the haplotypes distinctly clustered into two lineages (named lineage A and B, fig. 2). Two central haplotypes within each lineage, A1 and B0, were separated from each other by 18 (1.74%) mutations. All individuals of lineage A were found only in the northern part of Japan except for two individuals in location no. 28, whereas haplotypes in lineage B were ubiquitous in all local populations. The distribution of the two mtDNA lineages is shown in fig. 1. Northern populations were also characterized by the presence of unique haplotypes, such as haplotype B2, in high frequencies (eight of nine individuals). Seven individuals with haplotype B7 were found only in two locations within the Kanto region (central eastern Japan). Haplotype diversities were high in northern Japan and decreased southward (table 1). The haplotype diversity of COI correlated significantly with latitude (fig. 3a, Spearman rank correlation test; R=0.84, P<0.0001), even when tested using lineage B individuals only (R=0.50, P<0.01). The overall F ST was 0.442. The Mantel test for isolation by distance was significant for distance and F ST (R2=0.11, P<0.001; fig. 4a) in all haplotypes, and between distance and F ST in lineage B alone (R2=0.07, P<0.001). Correlation of haplotype diversity over latitude (R=0.05, P=0.82) and isolation by distance (R2=0.19, P=0.58) of lineage A alone were not significant. The results of Tajima's D-test and Fu's Fs test are shown in table 2. The negative values of Tajima's D-test, which indicate either a recent expansion of the population or natural selection, were significant for both A and B lineages. Fu's F S test, which is more sensitive to population expansion, was also significant and negative for both lineages.
Parsimony network of the 39 haplotypes (A0–A20 and B0–B17) identified in this study and nested clade design for S. rubrovittatus COI. The solid circles on the branches represent a single mutational change. Circle area is proportional to haplotype frequency.

Summary of polymorphisms of mtDNA COI sequences and six microsatellites of S. rubrovittatus.

Location number increased from north to south. Ni, Nim, the number of samples from that locality; Nh, number of haplotypes at that locality or region; %A, percentage of the haplotypes classified in the lineage A; GST, haplotype diversity, π: nucleotide diversity; NA, number of total alleles; RS, Allelic richness; RRS, Rare Allelic Richness; HO, Observed heterozygosity; HE, Expected heterozygosity.
Relationship of the latitude of the sampling locations and (a) Nei's haplotype diversity (GST), (b) average allelic richness of six microsatellite loci of S. rubrovittatus. Symbols of locations indicate one of three clusters (N, black circles; S, white circles; K, white squares) identified in Bayesian clustering analysis (BAPS program). The regression lines are also drawn.

Relationships between log-transformed geographic distance and Slatkin's F ST of (a) mitochondrial COI gene or (b) six microsatellite loci of S. rubrovittatus. P-values reflect significance of the observed correlations as estimated by a Mantel test (100,000 permutations). Black circles indicate pairs of locations belonging to the same cluster and white circles indicate pairs belonging to different cluster identified in Bayesian clustering analysis (BAPS program).

Summary statistics for neutrality tests and mismatch distributions of S. rubrovittatus mtDNA and Wilcoxon signed rank tests for excess or deficiency of heterozygosities for six microsatellites. Cluster N, K and S indicate the genetic cluster identified by Bayesian analysis (see fig. 5). Asterisks (*, **, ***) indicate values that are statistically significant P<0.05, P<0.01 and P<0.001, respectively.

Microsatellites
In total, 679 individuals (20.0 individuals per location, on average) were analyzed. All loci showed significant departures of HWE (by homozygote excess), except for locus A21 which showed no significant HWE deviation. We were unable to amplify the microsatellite by the PCR in a locus where the other loci of the same samples were successfully amplified in 131 (3.3%) of total 679×6 loci; this was likely due to the null allele homozygotes. MICRO-CHECKER analysis showed that all five loci showing HWE deviations were due to the presence of null alleles, and their frequencies were estimated to be 0.15 (A32), 0.14 (A33), 0.13 (A38), 0.06 (C5) and 0.17 (C61). The average F ST over all loci was 0.0218, which was much lower than that of the mtDNA. Northern populations contained more private alleles than did southern populations (12 private allele types in 227 individuals of cluster N vs eight private allele types in 370 individuals of cluster S). The average number of alleles per locus, allelic richness, rare allelic richness and estimates of heterozygosity in each population are shown in table 1. Allelic richness and rare allelic richness were both significantly correlated with latitude (allelic richness, R=0.38, P<0.05; rare allelic richness, R=0.54, P<0.01; fig. 3b). In contrast, expected heterozygosity was not significantly correlated with latitude (R=0.24, P=0.18). Analysis for isolation by distance revealed a correlation between ln-transformed geographical distance and Slatkin's F ST (R2=0.02, P<0.01; fig 4b) in the microsatellite data. Tests of deviation from a neutral mutation-drift equilibrium using BOTTLENECK showed that genetic clusters N and K had significant heterozygote deficiencies (N: P=0.016; K: P=0.055; S: P=0.22), whereas none of three genetic clusters (N, K and S) had significant heterozygote excesses under mutation-drift equilibrium (N: P=0.99; K: P=0.96; S: P=0.98; table 2). This suggests that S. rubrovittatus had not experienced a severe recent bottleneck event.
Phylogenetic tree and Bayesian clustering
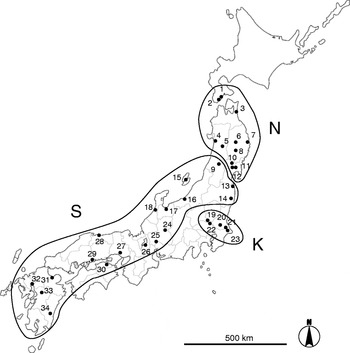
Group-level Bayesian clustering analysis using BAPS showed that the most likely value of K was 8 (log marginal likelihood=737.38) for the mtDNA data, whereas K=2 (best; log marginal likelihood=−9440) or 3 (second best; log marginal likelihood=−9452) for the microsatellites (supplementary fig. 1) and K=3 (log marginal likelihood=−10255) for combined data of mtDNA and microsatellites (fig. 5). The three clusters occupied distinct regional distributions: northern Japan (cluster N), southern Japan (cluster S) and the Kanto region (cluster K). Phylogenetic trees of mtDNA, microsatellites and the combined data of both are shown in supplementary fig. 2. The phylogenetic tree obtained from the combined data suggested that populations were sequentially differentiated along a gradient from north to south, but populations in the Kanto region (no. 19–23) clustered into another group (fig 5). This is consistent with results of the Bayesian clustering.
Distribution of three genetic clusters of S. rubrovittatus in Japan identified by the program BAPS using the combined genetic data of mtDNA and microsatellites. Locations belonging to the same cluster are surrounded by line.

AMOVA
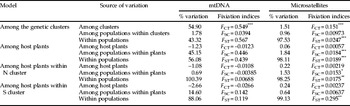
Analysis of molecular variance indicated a high level of geographical differentiation at different hierarchical levels. AMOVA detected a significant differentiation among clusters partitioned by Bayesian analysis in both mtDNA and microsatellites (table 3). AMOVA based on the host plants of the samples (cultivated L. multiflorum or uncultivated grasses) did not detect any differentiation between groups, indicating a lack of association of S. rubrovittatus with specific host plant species.
Analysis of molecular variance (AMOVA) partitioned among groups (genetic clusters of populations identified by Baysian analysis or plants) (F CT), among populations within groups (F ST), and within populations (F SC). Percentage of the total variance that is explained by the grouping scenario and fixation indices are indicated. Asterisks (*, **, ***) indicate values that are statistically significant P<0.05, P<0.01 and P<0.001, respectively.

Mating compatibility
In a mating test between the two unique haplotype clades of A and B (female A×male A (n=2), female A×male B (n=5) and female B×male A (n=2)), all combinations produced F1 and F2 progeny. F1 adults of all combinations also produced F2 generations. Although the mating of female B×male B was not included in the F0 generation, two F1 lineages of female B×male A, which subsequently possessed haplotype B in both sexes, produced the next generation (F2). There was no evidence of mating incompatibility between the two mitochondrial lineages of S. rubrovittatus.
Discussion
Mitochondrial DNA
There are two mitochondrial DNA lineages in Japanese populations of S. rubrovittatus. Assuming 2.3% pairwise sequence divergence per million years (Brower, Reference Brower1994), the observed divergence of 1.74% suggested that the two lineages separated 0.75 million years ago during the Pleistocene glacial age. Repeated fluctuations of sea levels around the Japanese islands during the glacial age caused severe changes in climate and altered the distribution of plants in Japan (Tada, Reference Tada1998), probably favoring refugial differentiation within the geographical range of S. rubrovittatus. The complete admixture of haplotypes from two distinct mitochondrial lineages in northern Japan was interpreted as evidence for secondary introgression during the postglacial age. The temperature rise during the postglacial age probably facilitated the distribution expansion and gene flow between the lineages of S. rubrovittatus. Re-colonization of populations from different glacial refugia has been reported for other insect species of the Japanese islands (Sota et al., Reference Sota, Hayashi and Iwai2004; Kawai et al., Reference Kawai, Shoda-Kagaya, Maehara, Zhou, Lian, Iwata, Yamane and Hogetsu2006; Aoki et al., Reference Aoki, Kato and Murakami2008). However, there is a clear linear decrease in genetic diversity of S. rubrovittatus over the Japanese islands. The current geographical pattern of S. rubrovittatus can be explained by the following hypotheses: (i) northern populations with various mitochondrial haplotypes have expanded southward; (ii) lineage A was isolated in the north, and lineage B in the south; both expanded during the postglacial ages, but B extended farther north; (iii) recent large-scale natural selection on mtDNA has exterminated lineage A in southern regions. The first hypothesis can be supported by the general theory that older populations exhibit higher diversity than younger populations because low variation is expected in younger populations due to founder effects and genetic bottlenecks (Hewitt, Reference Hewitt2004). The star-like pattern of the haplotype network and the statistical tests of selective neutrality of the mtDNA COI gene are consistent with a population expansion hypothesis. The second hypothesis, with two possible refuges in northern and southern Japan in glacial ages, also provides a reasonable explanation for the current distribution of the two mtDNA lineages. However, it conflicts with the significant increase in genetic diversity with increased latitude, as observed in lineage B. The third hypothesis, with ‘selective sweeps’ on mtDNA (Johnstone & Hurst, Reference Johnstone and Hurst1996), is less likely because the allelic richness of the microsatellites also decreases along latitude, whereas a selective sweep would affect the mtDNA variability alone. Further, we found no evidence of mating incompatibilities between the two different mitochondrial lineages, indicating the absence of strong cytoplasmic incompatibility related to the mitochondrial lineages. At minimum, we suggest that, in S. rubrovittatus, the phylogeography of mtDNA can be mainly explained by distribution changes during the glacial and post-glacial ages. A pattern of genetic isolation by geographic distance in mtDNA revealed that this species is under equilibrium between gene flow and drift, as shown in Hutchinson & Templeton's (Reference Hutchinson and Templeton1999) case I. The scatter of the pairwise points increased outward from narrow at the origin to wider at greater distances of geographic separation. This pattern of isolation by distance results from the changing relative influences of gene flow and drift as populations become more geographically separated (Hutchinson & Templeton, Reference Hutchinson and Templeton1999).
Microsatellites
Five of six microsatellites in S. rubrovittatus contained null alleles. Null alleles, which are caused by mutations in the primer-binding region flanking microsatellite sequences, are found in most taxa and are common in insects, including Hemiptera. Null alleles reduce the confidence in that marker by underestimating the exclusion probability (Dakin & Avise, Reference Dakin and Avise2004) and correcting genotype data often produces poorer results in population genetic studies (Chapuis et al., Reference Chapuis, Lecoq, Michalakis, Loiseau, Sword, Piry and Estoup2008). The microsatellites data with null alleles have to be carefully applied to the analyses of the population genetic variability and population structure. Null alleles have a limited effect on NJ tree topologies based on Cavalli-Sforza and Edwards’ (Reference Cavalli-Sforza and Edwards1967) chord distances compared with other genetic distance estimates (Chapuis & Estoup, Reference Chapuis and Estoup2007), and Bayesian clustering analysis using BAPS with the uncorrected dataset adequately discriminates gene pools when the frequency of null alleles is intermediate and gene flow is high (Chapuis et al., Reference Chapuis, Loiseau, Michalakis, Lecoq, Franc and Estoup2009).
Higher allelic richness and a higher frequency of private alleles of nuclear microsatellites in northern populations, as well as the presence of isolation by distance are concordant with the results of the mtDNA analysis. Polymorphisms of nuclear DNA in the current populations were completely mixed between the two lineages of mtDNA, which also provides support for post-glacial expansion and colonization of this species, followed by isolation by distance. The absence of a correlation between latitude and expected heterozygosity of microsatellite markers, which is another indicator of genetic diversity, is probably due to the low sensitivity of this measure to the presence of rare alleles in the detection of population bottlenecks because population bottlenecks reduce allelic richness faster than heterozygosity levels (Kalinowski, Reference Kalinowski2004). Bottleneck events rejected in the tests of mutation drift equilibrium also support the hypothesis of population expansion from north toward south, rather than the one in which the southern population has recently experienced severe bottleneck events.
Current genetic structure of S. rubrovittatus
BAPS clustered mtDNA variability into eight populations along the latitudes, whereas the microsatellites were clustered into only two (Kanto and other populations) or three (Kanto, northern and southern) populations. The differences in the number of clusters detected reflect the resolution of mtDNA and microsatellites. Maternally inherited mtDNA has a smaller effective population size; and, as a result, it might be affected more strongly by genetic drift than would nuclear DNA markers. The latitude-dependent structure of mtDNA is likely to reflect a temperature gradient, which limits the life cycles of the local populations. With the combined data of mtDNA and microsatellites, the best clusterings of three populations were mainly concordant with the three populations in microsatellites. No striking geographic barriers among three clusters were found. Environmental factors that are dependent on latitude, such as temperature, distribution of host plants or number of generations of the bug per year, may play a role in separating regional populations of S. rubrovittatus.
Single or multiple origins of outbreak populations in S. rubrovittatus
The genetic variability of S. rubrovittatus populations in Japan is clustered according to their regions but independent from the year of local outbreaks. This geographically steady pattern of genetic structure is in contrast to cases of invasive insect pests in which the genetic structure has been shuffled by multiple invasions and rapid expansion of population distributions (i.e. Davies et al., Reference Davies, Villablanca and Roderick1999). Two early outbreaks observed in northern and southwestern Japan during the 1980s were caused by two genetically isolated populations, N and S. In the Kanto region, while outbreaks of S. rubrovittatus on rice did not occur until the pest was found in Chiba prefecture (no. 23) in 2004 (Katase et al., Reference Katase, Shimizu, Shiina, Hagiwara and Iwai2007). This most recent outbreak population was genetically similar to the other four latent populations in the Kanto region (no. 19–23) but different from the N or S populations, indicating that the first outbreak in this region arose from low-density local resident populations. Overall, we found at least three outbreak populations of S. rubrovittatus that appeared independently from the three genetically separated groups of unique regional distribution across the country. The source of the outbreak is probably the endemic local population, which experienced a population increase in each location.
Chapuis et al. (Reference Chapuis, Lecoq, Michalakis, Loiseau, Sword, Piry and Estoup2008, Reference Chapuis, Loiseau, Michalakis, Lecoq, Franc and Estoup2009) carried out a worldwide genetic analysis of the migratory locust L. migratoria (L.) and revealed that populations had differentiated in relation to subspecies or regions but not with respect to their propensity to outbreak. Another example of the multiple origins of native agricultural pests is the rice stem borer Chilo suppressalis in China, in which three regional groups were formed during the ice ages. In this case, the population structure was strengthened along with the rice domestication (Meng et al., Reference Meng, Shi and Chen2008). Similarly, pestiferous outbreaks of the fruit fly Bactrocera depressa in Korea are due to local populations, rather than to recent invasions from Japan (Mun et al., Reference Mun, Bohonak and Roderick2003). These studies indicate that outbreak events are more affected by local environmental conditions than by genetic characteristics of the local populations. Our study of S. rubrovittatus supports these observations even in a much shorter period of a few decades and on a smaller geographical scale.
Proposal for the control of S. rubrovittatus
Over the past 20 years, S. rubrovittatus has changed from a rare endemic species to an epidemic pest. Whereas S. rubrovittatus occupies most of the rice culture areas in Japan, the abundance of local populations greatly varies among locations (Watanabe & Higuchi, Reference Watanabe and Higuchi2006). Our study predicts that local populations of S. rubrovittatus also have the potential to outbreak when agro-environment conditions are met. In addition to the traditional methods of controlling this pest, such as insecticide spraying and weeding in damaged areas, considerable attention should be paid to monitoring the population dynamics of S. rubrovittatus in areas where rice damage has not yet occurred. Monitoring and controlling the host plants of this pest in such areas will also be effective in preventing additional outbreaks of S. rubrovittatus.
Acknowledgements
We are grateful to S. Hoshizaki for his advice and comments and M. Sasaki for her technical assistance. We also thank M. Kakizaki, T. Ichita, K. Takashino, J. Goto, T. Kidokoro, R. Ono, J. Kashin, A. Nakamura, S. Matsuki, H. Higuchi, A. Takahashi, J. Nagase, M. Ishimoto, H. Sato, T. Kichijima, W. Kanno, K. Ogata, T. Yokosuka, H. Funato, K. Yoneyama, K. Emura, M. Katase, T. Hamasaki, H. Ichihashi, K. Tueta, H. Watanabe, M. Yajima, M. Fukai, S. Sigehisa, K. Yamashita, A. Kikuchi, H. Kousai, Y. Okutani, M. Ono, T. Tsutumi, F. Kuchiki, H. Takeuchi, Y. Kushima and K. Sugimura for collecting samples. The research was funded by the Ministry of Agriculture, Forestry and Fisheries, Japan.
Supplementary materials
The following online tables and figures can be viewed at http://journals.cambridge.org/ber:
Supplementary table 1. Collection details of sampled S. rubrovittatus.
Supplementary table 2. Mitochondrial DNA haplotype frequencies for S. rubrovittatus collected at each sampling location.
Supplementary table 3. Groping schemes for AMOVA analysis.
Supplementary fig. 1. (a) Distribution of eight genetic clusters of S. rubrovittatus of mtDNA identified with BAPS using the group level option. (b, c) Distribution of two (b) and three (c) genetic clusters of S. rubrovittatus of microsatellites data identified with BAPS using the group level option.
Supplementary fig. 2. (a) Neighbour-joining tree among S. rubrovittatus local populations constructed based on F ST using mitochondrial COI sequences. (b) Consensus tree among S. rubrovittatus local populations based on Cavalli-Sforza & Edwards' (1967) chord distances derived from allele frequencies at six microsatellite loci. (c) Genetic distance tree among S. rubrovittatus local populations constructed using combined mitochondrial COI and six microsatellite data.