In Canada, the cancer mortality rate for women has declined by 20 percent in the past 30 years (excluding lung cancer), and the all-cancer mortality rate for Canadian men has declined by 18 percent since 1988 (1). Advances in the screening, diagnosis, staging, and treatment of cancer have led to improved outcomes, but improved outcomes have come at a cost. Over the next 30 years, direct healthcare costs associated with cancer in Canada are estimated to be $176.7 billion (2).
Costly new health interventions have created a situation where decision makers and policy makers have to make very difficult funding decisions that may result in denying funding for treatments to some patients to provide treatment to others (Reference Steinbrook3). Many have suggested that economic evaluations can be used to inform difficult funding decisions. Economic evaluations give an indication of value for money of the health intervention by estimating the incremental drug cost per incremental effect with an incremental cost-effectiveness ratio (ICER) (Reference Drummond, Sculpher, Torrance, O'Brien and Stoddart4;Reference Gold, Seigel, Russell and Weinstein5). However, many argue that resource allocation decisions are complex and must include other considerations in addition to economic evidence (Reference Anell6;Reference Rocchi, Menon, Verma and Miller7).
In response to the need to make difficult funding decisions, many jurisdictions have convened interdisciplinary decision-making committees whose mandate is to examine evidence and make funding recommendations (Reference Rocchi, Menon, Verma and Miller7–Reference George, Harris and Mitchell11). One of the oldest decision-making committees and frameworks in Canada, and likely the earliest committed solely to assessing cancer interventions, is the Priorities and Evaluation Committee (PEC) established by the British Columbia Cancer Agency in 1998. Examples of other committees around the globe include the National Institute for Health and Clinical Excellence in the United Kingdom, which was formed in 1999 (Reference Collier12–Reference Williams, Bryan and McIver14), and the Australian Pharmaceutical Benefits Advisory Committee, which was established in 1953 but began considering cost-effectiveness evidence in 1993 (Reference Clement, Harris and Li9;Reference Harris, Hill, Chin, Li and Walkom15–Reference Hill, Mitchell and Henry17). The Common Drug Review, which was formed in 2002 in Canada (Reference Tierney and Manns18;Reference McMahon, Morgan and Mitton19), considers cost-effectiveness evidence in the review by its Canadian Expert Drug Advisory Committee (20).
Although committees have adopted the use of economic evidence into their resource allocation decision-making processes, studies have shown the use of economic evaluation for funding recommendations has varied substantially (Reference Rocchi, Menon, Verma and Miller7;Reference Mason21). More recently, the pan-Canadian Oncology Drug Review was established in 2010 with the aim to build a national cancer drug review process that includes both clinical evidence and cost-effectiveness and supports evidence-based decision making.
Oncology Drug Funding Process in British Columbia
The oncology drug funding process in the Canadian province of British Columbia is initiated by clinicians who submit proposals for new drugs or combinations of drugs to be funded. Before submitting a proposal to the PEC's annual review, clinicians must first gain approval from their tumor-specific peer group. Submitting clinicians must then complete a PEC template, which includes descriptions of the treatment and its indications, patient harms and patient benefits (including incremental improvements in survival), and supporting evidence.
During the study period, once proposals were submitted to the PEC, a pharmacist generated ICERs using estimates of incremental cost and incremental effectiveness. The PEC uses a deliberative decision-making approach using available information and evidence until consensus on a funding recommendation is achieved. For proposals that are recommended, the provincial program constructs a comprehensive budget for the new drug. Recommendations with integrated budgets are then forwarded to an Executive Committee at the Cancer Agency that assesses the recommendations for their strategic alignment and operations impact. This assessment results in a revised list of recommendations that are used to generate a budget for additional funding, and the budget is presented to the British Columbia Ministry of Health. Negotiations result in final funding decisions for new interventions (Supplementary Figure 1). Nowhere in this process is it specified the degree to which cost-effectiveness should be associated with funding decisions.
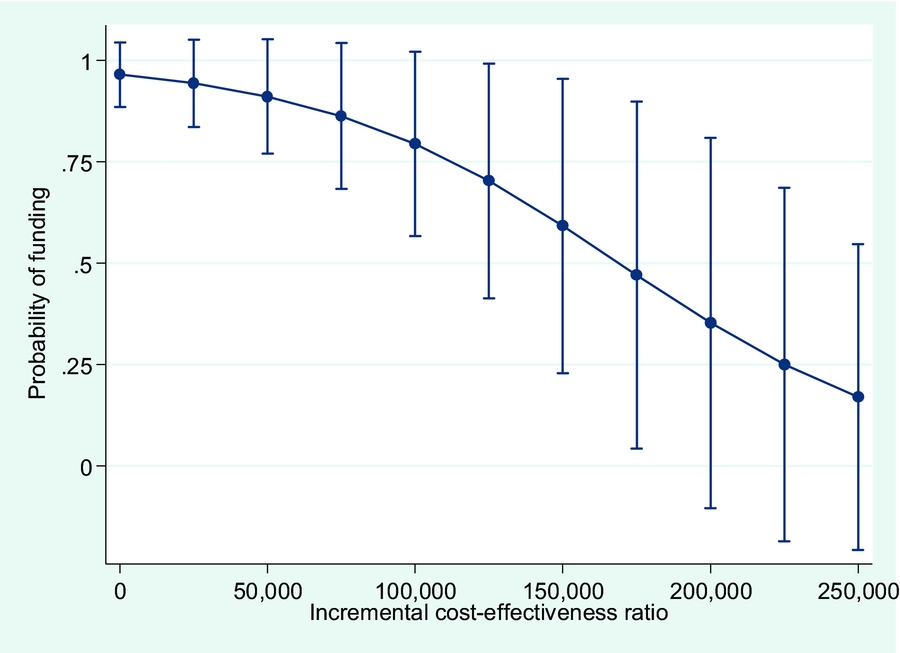
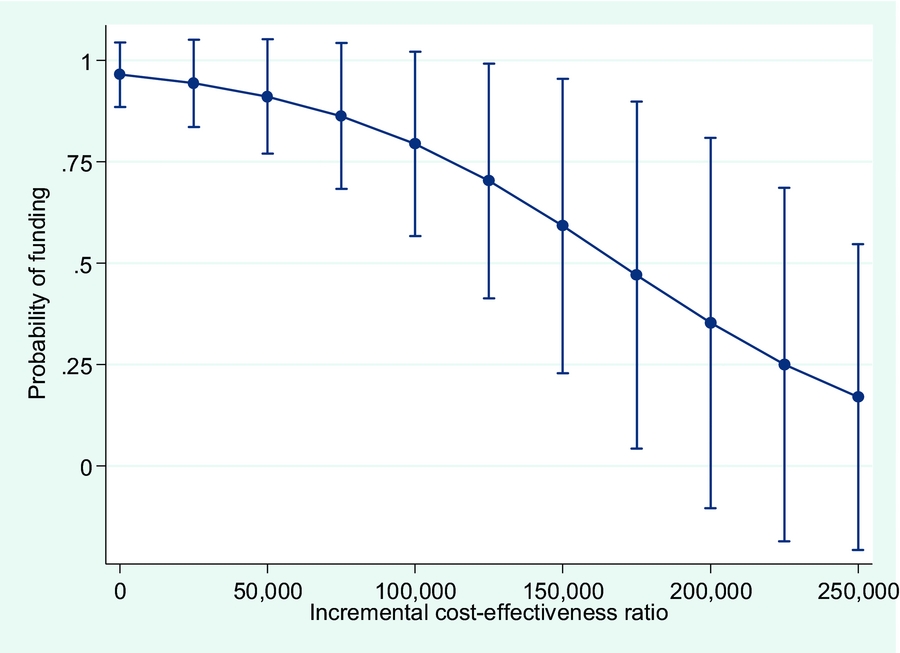
Illustrating estimates and 95 percent confidence intervals for the probability of funding and incremental cost-effectiveness ratio per life-years gained.
The purpose of this study is to assess whether economic evidence plays a role in British Columbia cancer funding decisions made from 1998 to 2008 by examining the association between funding decisions made by the British Columbia Ministry of Health and ICER values estimated by the PEC.
METHODS
All proposals made to the PEC between 1998 and 2008 were reviewed for this study. For each proposal the fiscal year, the type of proposal, ICER, and final funding decision were abstracted. The ICER was defined in the usual way as the ratio of the extra cost to the extra effect (i.e., ΔC/ΔE). The majority of ICERs retrieved from the PEC proposals were calculated from the perspective of the drug budget (not that of an overall healthcare payer or societal perspective).
To investigate the role of cost-effectiveness evidence and the Ministry of Health's funding decision, the association between funding decisions and ICER estimates were examined for a systematic pattern. This association was examined by (i) evaluating the hypothesis that interventions with higher ICERs have a lower probability of receiving a positive funding decision and (ii) determining if a statistically significant difference exists between the mean ICERs of funded versus not funded proposals.
The ICERs were inflated to 2008 Canadian dollars using Consumer Price Indices from 1998 to 2007 (22). The data were studied using box plots to illustrate the distribution of the ICERs by funding decision and were tested for normality using Shapiro-Wilk and Shapiro-Francia tests. A logistic regression was performed to analyze the impact of a higher ICER on the odds of receiving a positive funding decision (our hypothesis was that higher additional cost per additional unit of effect would be negatively associated with a positive funding recommendation). Lastly, to determine if there were a statistically significant difference between the means of ICERs for interventions with positive versus negative funding recommendations, a Student's t-test was conducted and its results were compared with those from a nonparametric Wilcoxon-Mann-Whitney test.
A sub-analysis involved ICERs with other potentially relevant outcome measures (besides life-years gained). These other outcome measures include remission-years gained; palliative-years gained and a final group formed from aggregating the remaining ICERs. For our main analysis, we studied those that reported ICERs using life-years gained as the measure of effectiveness.
RESULTS
Between 1998 and 2008, 149 proposals were submitted to the PEC and categorized into curative/adjuvant, palliative, patient services, and prevention. Palliative interventions accounted for seventy-eight (53 percent) of the proposals and curative/adjuvant for forty-eight (32 percent). The remaining were thirteen (9 percent) patient services proposals, nine (6 percent) prevention proposals, and one (1 percent) other. Most proposals referred to a specific tumor type. From the 149 proposals, 114 (77 percent) cited clinical effectiveness evidence, and 78 (52 percent) reported an ICER for the intervention. These ICERs used a variety of outcomes measures, including life-years gained, remission-years gained, toxic event avoided, per response, etc. Final documented funding decisions were retrieved for 70 (91 percent) of the proposals that cited ICERs; proposals without funding decisions were excluded from the analysis. As noted above, the main analysis focused on proposals reporting ICERs with life-years gained as the effectiveness outcome (n = 22).
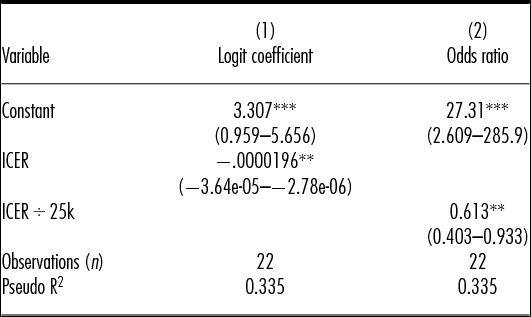
The logistic regression results suggest a negative association between the ICER per life-years gained and the likelihood of a positive funding recommendation. Table 1 shows a negative logit coefficient on the continuous ICER per life-years gained variable that is statistically significant (the estimate is −0.0000196). The coefficient is easier to understand as an odds ratio for a $25,000 increase in the ICER per life-years gained. The odds ratio for this variable is 0.613 (reported in Table 1 as the coefficient estimate for the variable ICER ÷ 25k). The results indicate that a drug with an ICER $25,000 greater has odds 0.613 times lower of funding. Alternatively, the odds ratio of not getting funding is 1.6 (i.e., 1/0.613). In other words, for every $25,000 reduction in the ICER per life-years gained, the estimated odds of having the drug funded increase by 1.6.
Coefficient Estimates (Logit Coefficients and Odds Ratios) and 95% Confidence Intervals (in Parentheses) for the Association between the ICER and the Likelihood of Funding

Note. 95% confidence intervals in parentheses.
*** p < 0.01.
** p < 0.05.
ICER, incremental cost-effectiveness ratio per life years gained; ICER ÷ 25k = ICER divided by $25,000.
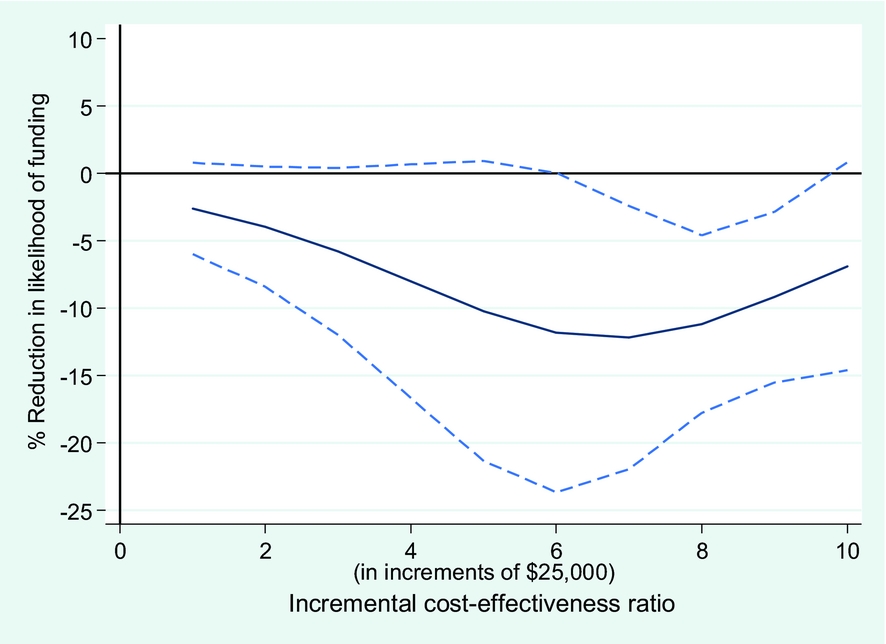
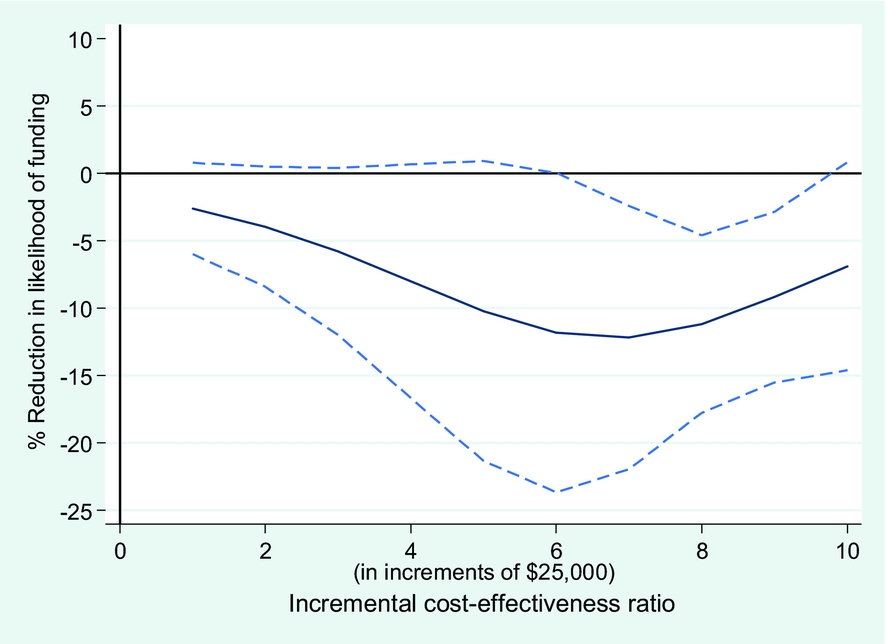
Figure 1 illustrates the probability of funding and 95 percent confidence intervals, and Figure 2 illustrates the change in probability of funding and ICER per life-years gained. The curve in Figure 1 suggests that probability of funding declines with an increasing ICER per life-years gained; however, the extent of the reduction in probability depends on the initial value of the ICER per life-years gained. The steepest decent appears to occur in the middle ranges of the ICER values. Figure 2 confirms this intuition, showing the largest estimates of reduction in the likelihood of funding for ICER values in the mid-range.
Illustrating change in probability of funding and incremental cost-effectiveness ratio per life-years gained.
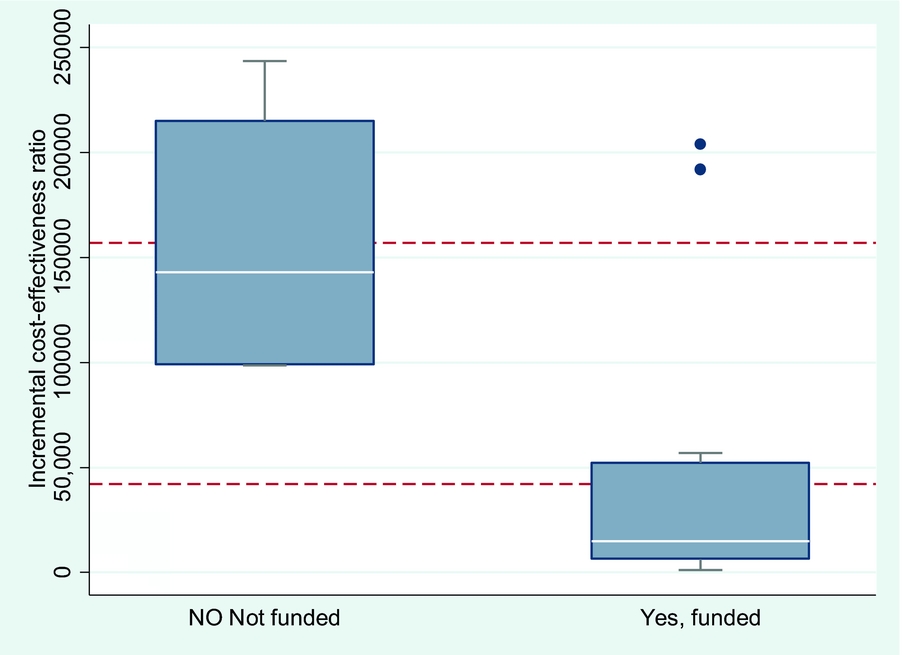
A box plot of the ICER per life-years gained by funding recommendation is depicted in Figure 3 and shows evidence of an association between ICERs and the likelihood of funding. The mean ICER per life-years gained for proposals with a positive funding recommendation was $42,006 per life-years gained and the mean ICER per life-years gained for proposals that did not receive a positive funding recommendation was $156,967 per life-years gained (these means are illustrated as dashed horizontal lines in Figure 3). This difference, nearly $115,000 per life-years gained, is statistically significant (p = .003).
Box-plot of incremental cost-effectiveness ratios per life-years gained for negative funding (NO, not funded) and positive funding (Yes, funded) decisions (means are indicated with the dashed horizontal lines and medians are indicated with the white lines inside the boxes).
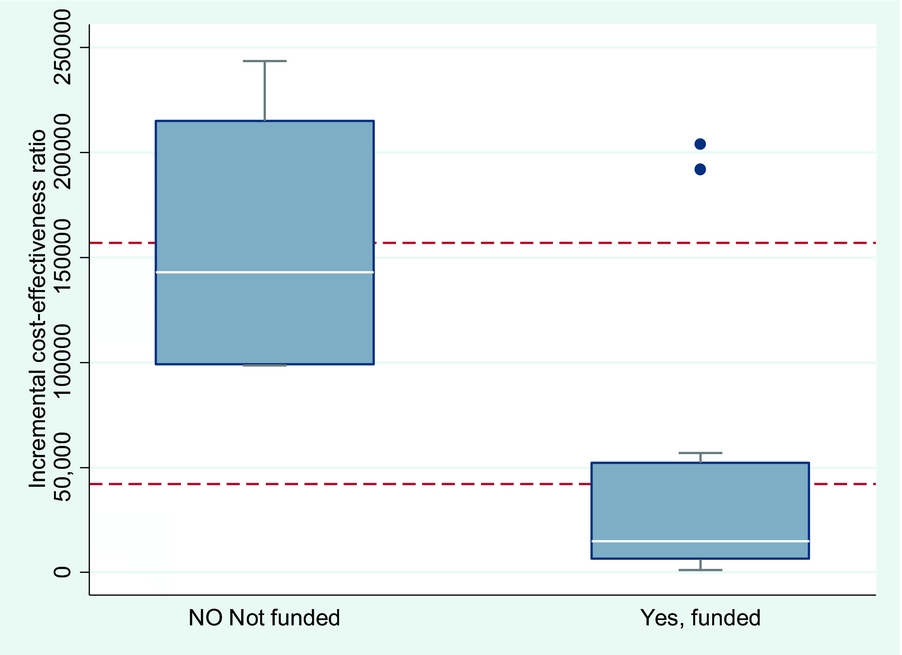
Nonparametric testing using a two-sample Wilcoxon-Mann-Whitney test confirmed this finding (z = 2.554; p = .0107). Visual inspection in Figure 3 of the interquartile range boxes (with the medians indicated as white lines inside the boxes at approximately 143,000 per life-years gained and 14,800 per life-years gained) provides strong intuition for the results from the statistical tests. In fact, there would be no overlap at all between the ICER per life-years gained distributions for funded and not funded proposals, if not for two outliers in the “funded” group. Removing them from the analysis would strengthen our findings of a statistical difference between ICERs per life-years gained for funded and not funded proposals.
DISCUSSION
The results of this study suggest there is an association between ICER values and oncology funding decisions in British Columbia. There is a lower likelihood of a drug with a higher ICER receiving a positive funding decision. The difference between the mean ICERs of positive and negative funding decisions, which was nearly $115,000, was also found to be statistically significant using both parametric and nonparametric statistical tests. Changes in the ICER when the ICER is very high or very low do not affect the likelihood of funding as dramatically as changes in ICERs in a middle range. This middle range may indicate a setting in which negotiation has the largest impact. Lastly, we did not find evidence of a fixed ICER threshold for drugs to get a positive decision.
The association between ICER values and funding decisions suggests that economic evidence likely had a systematic role in cancer funding decisions in British Columbia. Using other decision-making criteria in addition to economic evidence is consistent with the approach seen in reviews of funding decisions in other jurisdictions (Reference Clement, Harris and Li9;Reference Eichler, Kong and Gerth23). A study of funding decisions in the United Kingdom found that, although the probability of rejection increases with higher cost-effectiveness ratios, a stringent cost-effectiveness threshold did not exist (Reference Devlin and Parkin10). A study of Australia's funding decisions found that there was a statistically significant difference between the cost-effectiveness ratios for drugs that were recommended for funding and those that were not, but an explicit cost-effectiveness threshold was not apparent (Reference George, Harris and Mitchell11). A study of Canada's noncancer drug funding recommendations did not reveal a relationship between funding recommendations and economic evidence, but the study did discuss other plausible, relevant decision-making criteria (Reference Rocchi, Menon, Verma and Miller7;Reference Clement, Harris and Li9). A study on the relationship between cost-effectiveness evidence and American national coverage decisions made by the Centers for Medicare and Medicaid (CMS) did not find an association between published ICERs and coverage decisions, in line with the observation that the CMS does not explicitly consider economic evidence when making decisions (Reference Chambers, Neumann and Buxton24).
Our study has limitations. First, the majority of ICERs retrieved from the PEC proposals were calculated from the perspective of the drug budget. The intent of the PEC was to use existing local usage data along with available clinical evidence to provide decision makers with some context regarding impact and comparability of new oncology drug budget funding requests. However, ICERs are most commonly calculated from the perspective of the health system or society, so that the ICER includes all relevant costs (Reference Drummond, Sculpher, Torrance, O'Brien and Stoddart4;Reference Gold, Seigel, Russell and Weinstein5). Using a limited perspective for an ICER may unfairly advantage or disadvantage an intervention (e.g., one where the cost differences accrue unequally between drug and other healthcare categories, like hospitalization).
Second, because the available clinical literature often cited different outcome measures, the PEC proposals also cited ICERs with different outcome measures. Although it can be difficult to compare across outcome measures, our analysis only found heterogeneity in the less frequently seen outcomes (i.e., the “other” group); our study found that the association between ICERs and funding decisions is consistent but not statistically significant across the other major outcome groups (i.e., remission-years gained and palliative-years gained). Canada's pan-Canadian Oncology Drug Review may address both these current shortcomings (narrow perspective and variable outcome measures) (Reference Hoch and Sabharwal25–Reference Yong, Beca and Hoch28).
Lastly, there are other factors, such as availability of alternative therapies, equity considerations, net budgetary impact, quality of model/RCT derived benefits, use of the correct comparator, or even the financial quarter in which a proposal is submitted that could affect the Yes/No decision. In our analysis, these are omitted variables, and omitted variables can affect the estimated association of the ICER, even if they are unrelated to the ICER (Section 5.3 of Cramer) (Reference Cramer29).
Analysis of 10 years of the PEC proposals revealed that interventions with higher ICERs (i.e., higher additional cost per life-years gained) have a lower likelihood of being funded and that there is a difference between the mean ICERs of funded versus unfunded proposals. This result suggests that economic evidence appears to have had a systematic role in British Columbia cancer funding decisions from 1998 to 2008. Funding trends suggest that other decision-making criteria may also influence the PEC recommendations and subsequent funding decisions. An understanding that economic evidence was used in British Columbia from 1998 to 2008 is useful for health technology assessment organizations as they consider the role of cost-effectiveness evidence in their drug review processes. Lastly, future research on the relationship between ICERs and funding recommendations can provide additional insight on the role of economic evidence in oncology funding decisions both in Canada and internationally (Reference Masucci, Beca, Sabharwal and Hoch30).
SUPPLEMENTARY MATERIAL
Supplementary Figure 1: https://doi.org/10.1017/S0266462317000642