Most assessments of the effectiveness of economic sanctions investigate the ability of this policy tool to produce policy concessions. Direct investigations of sanctions and leader survival are relatively new (Marinov Reference Marinov2005; Escriba-Folch and Wright Reference Escriba-Folch and Wright2010). This is a positive move in the literature. Investigating the link between sanctions and leader survival is well justified by its significance in theories of economic sanctions as tools of foreign policy. Both sanctions optimists and pessimists have long suggested a link between the (in)ability of sanctions to hurt leaders politically and their ultimate success (e.g., Galtung Reference Galtung1967; Baldwin Reference Baldwin1985; Kaempfer and Lowenberg Reference Kaempfer and Lowenberg1988). Data and modeling choices, however, have prevented studies from sufficiently exploring this link. Both prior tests fail to fully incorporate the threat stage of economic sanctions and both utilize flawed indicators of leader exit.
The destabilizing capacity of a foreign policy tool cannot be accurately estimated without consideration of the strategic selection process. Leaders targeted for economic coercion differ from those untargeted in terms of their ex ante or baseline risks of losing power. This difference may emerge incidentally, as the types of behavior, which incur international disapproval, tend to be triggered by domestic uncertainty. Or, it may stem from a strategic interaction between sanctioners and potential targets, as some bargaining theory suggests. In either case, a difference in baseline risks will muddy our estimates of sanctions’ efficacy. Are sanctioned leaders hurt by foreign punishment, or simply facing higher ex ante risks?
I also argue that the incorporation of threats of sanction is vital to the study of sanctions and survival, but not in the way most often assumed. The threat stage of economic sanctions does not produce the clean selection process described in game theoretic analyses. Threats virtually always fall on leaders already being punished. The tendency of the international community to pile threats on top of existing sanctions indicates that threats themselves may affect targets.
Assessing the ability of a foreign policy tool to destabilize a targeted leader requires a nuanced measurement of leader failure. We need to know not just whether leaders leave office, but whether these exits indicate a rejection of the leader’s platform or leadership. In the sample of leaders from 1971 to 2004 compiled for this work, about 25 percent of targeted leader exits fail to meet this bar. These leaders were replaced not by a challenger figure, but by a protégé with similar political views following a regular or legal process of turnover. Though prior studies made some effort, usually by excluding natural deaths, the problem remains to various degrees. Any substantial noise in our dependent variable is troubling. Miscoded failures could lead us to conclude that policy tools matter more than they really do if a significant portion of targeted leaders actually turned power over to a political heir; they could lead us to the opposite conclusion erroneously if a higher proportion of these “false positives” exists in the comparison category of non-targeted leaders.
I forward a hazards framework for estimation of economic sanctions’ effect on leader survival to address all of these concerns. Leveraging the possibilities of stratified Cox models, I provide an empirical model, which better reflects what we know about economic sanctions, while guarding against potential confounding. My results suggest that imposed economic sanctions rarely hurt leaders’ ability to stay in power.
Economic Sanctions and Leader Survival
Accounts which incorporate domestic politics into the sanction game, emphasize that in order for external interventions to alter policies some portion of society must believe the costs of economic sanctions outweigh the utility derived from existing positions (e.g., Morgan and Schwebach Reference Morgan and Schwebach1995). Presumably, actors under such a belief would withdraw their support for the executive, a process Galtung (Reference Galtung1967) called “political disintegration.” The model forwarded by McGillivray and Smith (Reference McGillivray and Smith2000, 811) proposes that states aim punishments such as economic sanctions, at leaders rather than states partially to encourage such domestic political responses: “Agents that violate international norms not only expose their nation to the wrath of others but also lose their jobs in the process.” Yet, this domestic backlash, others argue, could fail to surface owing to in-group/out-group effects, modern nationalism, “sanctions rents,” or the ability to consolidate control through anti-democratic or repressive strategies (Galtung Reference Galtung1967; Pape Reference Pape1997; Kaempfer and Lowenberg 2000; Kaempfer, Lowenberg and Mertens Reference Kaempfer, Lowenberg and Mertens2004; Wood Reference Wood2008; Peksen and Drury Reference Peksen and Drury2010).
Direct tests of whether sanctioned leaders face higher risks of losing power tend to support the idea that domestic political institutions condition the outcome. Using fixed effects logistic regression, Marinov (Reference Marinov2005, 573) finds that sanctions against democratic leaders produce higher risks of failure.Footnote 1 Supporting this conditional effect, Allen (Reference Allen2008) uncovers an inverted-U relationship between level of democracy and anti-government demonstrations following sanction imposition. Escriba-Folch and Wright (Reference Escriba-Folch and Wright2010) focus on variations in autocratic systems, arguing that only the strategies of personalist leaders should be affected by economic sanctions. They find that the probability of leader turnover increases for such leaders under sanction, whereas other types of leaders may be insulated from risk by sanctions. The destabilization of personalist leaders, however, holds only for what Archigos (Goemans, Gleditsch and Chiozza Reference Goemans, Gleditsch and Chiozza2009) calls “regular” leader exits (see Escriba-Folch and Wright Reference Escriba-Folch and Wright2010, 354).Footnote 2
The centrality of the link between sanctions and leaders in the literature justifies a closer look. Although difficult data and modeling challenges exist, they are not insurmountable if carefully considered. I discuss the measurement and modeling issues in more detail below, before presenting a hazards framework solution.
Leader Exits and Leader Failures
Traditionally, models of leader survival utilize some variant of the Archigos “exit” variable, perhaps excluding natural deaths (cf. Leeds, Mattes and Vogel Reference Leeds, Mattes and Vogel2009). In some specific circumstances, where tenure itself was of interest, this variable may be unproblematic. For any study seeking to model the destabilization of a leader via foreign policy interventions, however, a serious disconnect exists between the idea of “exit” and the idea of “failure.”
Leaders exit via disparate means: term limits, elections, coups, resignation, votes of no confidence. An exit, in and of itself, does not indicate that a leader experienced the type of political disintegration, which we hope to tap in analyses of foreign policy punishments. A data set of world leaders from 1971 to 2004, includes 4409 leader years and 885 individual leaders. Some of these rose to power through institutions that rewarded principled politics and the provision of public goods; others utilized force and ruthlessness to make it to the top. Some helmed their countries successfully for many years before peaceably retiring, while others crashed and burned in a display more of blood than glory. The political ideological goals of some lived on after their exits through the administrations of hand-picked successors, protégés, or political kindred spirits, while others saw their life’s work systematically dismantled following a crushing opposition victory. A large-N statistical analysis cannot include every detail about each of these 885, but it can be sensitive to major features indicative of their ability to maintain political support.
To match the concept of leader destabilization to a measurable event, we must consider the means of leader exit and the political relationship to the successor (Licht 2014).Footnote 3 A leader who hands over the reins of power to a successor she can trust to further her policy agenda has not been “harmed” by foreign punishments aimed at that policy agenda. I begin by assuming that violent turnovers in power inherently indicate a loss of key domestic support.Footnote 4 Next, I identify all “regular” (i.e., legal) exits from Archigos v2.9 (Goemans, Gleditsch and Chiozza Reference Goemans, Gleditsch and Chiozza2009) between the years 1970 and 2004, chosen for correspondence to the TIES temporal realm. Each of these turnovers is then coded for “means” of losing office and nature of the relationship between the ingoing and outgoing leaders.
Coding the manner of exit allows those cases, which are technically peaceable, but which actually indicate a loss of approval or control, to be identified. The coding scheme accomplishes this through a variable called “Severe Political Pressure.” For every turnover, which appears to be a resignation, further research was done to identify whether the leader left office in the face of mass protests, loss of confidence within the party/junta/broader government, or threat of coup.Footnote 5
The second significant piece of information necessary to code a leader’s exit as evidence of destabilization is the nature of the relationship between the ingoing and outgoing executives. Using party affiliation, historical, open source repositories, media accounts, and notes in the Archigos v2.9 Codebook, the relationship between each pair of exiting and entering leaders is characterized as one of three types: heir, challenger, or neutral.Footnote 6 Leaders frequently hand power over to political protégés after leaving office via regular legal processes. In cases of resignation and term limits, the frequency of heir turnovers is about 40 percent (see the online Appendix Figure A1).
Neither heir nor neutral turnovers approximate the destabilization in which we are interested when assessing the effect of foreign policy tools on leader tenure. In order to better isolate leader destabilization, then, I propose a measure which taps an exit when turnover is irregular, a resignation characterized by severe political pressure, or results in a challenger taking power.
The heterogeneity of leader exit types creates noise in existing studies of the destabilization of leaders. To assess the extent of this noise, I compared the exits used in Marinov (Reference Marinov2005) for the subset of data, which overlaps temporally with mine.Footnote 7 Using Marinov’s measure of failure, there were 125 leaders targeted with sanction who failed during the period 1970–2004. Using my measure of leader failure, about 23 percent of these cases do not qualify.Footnote 8 This inflated count of exits occurs for leaders who do not exit under sanctions as well: about 32 percent of non-sanctioned leaders left office in a way, which cannot easily be described as “failure.”
Leaders Under Sanction and Threat
The formal literature has long posited a substantial selection effect in the sanctions game. Those sanctions which should be most effective will also be the least likely to escalate from threats to imposed punishments (e.g., Smith Reference Smith1995; Drezner Reference Drezner2003). For two reasons this focus may be misleading, when we turn our attention to the targets of sanctions rather than to the ultimate outcome of sanction episodes. Most directly, of course, there is no observability problem in the dependent variable when we shift our focus to targeted leaders’ loss of power. In other words, while endogeneity may still be a concern, it will not take the form of a selection process. As noted by Marinov (Reference Marinov2005, 565), we must compare sanctioned leaders to unsanctioned leaders if we wish to assess whether coercion works.
Empirically, the sanctions game does not unfold as pristinely as formal models suggest. The vast majority of leaders who are targeted with a new threat already live under imposed economic sanctions. Transforming the TIES data set (Morgan, Bapat and Krustev 2009) into leader years reveals only five cases of threats against leaders not currently under punishment.Footnote 9
When examining the effect of sanctions on leaders, then, the most important distinction may be between leaders who are targeted and leaders who are not. If there are likely to be observable and unobservable factors determining selection into the targeted population, we need a modeling strategy to account for them without censoring our population. Escriba-Folch and Wright (Reference Escriba-Folch and Wright2010) do so via an uncensored, two-stage Heckman probit. Owing to reliance on the Hufbauer, Schott and Elliott (Reference Hufbauer, Schott and Elliott2009) data set, however, the authors could not investigate threats.
Yet, targeted leaders with new threats to deal with should differ from those who do not. To ignore this distinction is to dismiss the possibility that threats of sanction can affect leaders. As we often argue that the most effective economic sanction is one which never escalates to imposition, this seems an imprudent assumption. Although threats rarely fall upon unsanctioned leaders, roughly 34 percent of sanctioned leader years lack additional threats piled on top of existing punishments. These leaders may be substantively different. They appear more likely to be under sanction for issues of human rights and less likely for those of trade practices.Footnote 10
A Hazards Approach to Sanctions and Leader Survival
Many conceptual and empirical hurdles impede the analysis of economic sanctions’ effect on leader survival. This study addresses these hurdles, first, with the improved measures of leader survival and threats of sanction described above. Second, it proposes a hazards approach to theorizing about the survival of leaders (Cioffi-Revilla Reference Cioffi-Revilla1998). This approach begins with two basic propositions. First, a baseline hazard of failure, determined by institutional rules and prior events, exists for all leaders at all times. This underlying risk can be aggravated or alleviated by a host of factors internal and external to the polity, but is always positive. Second, sending states select targets for coercion strategically. This strategic process ensures that targeted leaders differ systematically from those not targeted. If we are interested in hazard forces, the specific difference we should be most alert to is a difference in baseline risk of failure. To accurately estimate the effect of coercion on the overall hazard, we must account for the possibility that targeted leaders’ baseline risks differ from non-targeted leaders.
Leader Hazards
All leaders, whether they govern via constitutional democracy or military junta, face some probability of failure. Leader tenure is a duration process. Risks of failure change over time given the nature of political institutions, government performance, and stochastic events (e.g., King et al. Reference King, Alt, Burns and Laver1990). Leaders can be described as facing a baseline risk determined largely by the rules of leader replacement and prior events as well as a set of factors that may push this risk up or down.
Political institutions matter in models of leader survival because they determine dynamics in risk. In democratic countries, leaders compete in elections at regularly scheduled intervals, making their standard risks of losing office lumpy; on average, leaders face significant probability of failure only during certain time frames. Of course, leaders can fail outside of election time owing to more particular factors such as death, scandal, or crisis. Probabilistically, the onset of such factors should increase over time. In authoritarian systems, leadership turnover may be less institutionalized. The risks of such leaders should be smoother than those of democrats, but will decrease over time as they solidify the support of their winning coalitions and accumulate a store of slack resources to draw upon during crises (see Bueno de Mesquita et al. Reference Bueno de Mesquita, Smith, Siverson and Morrow2003, 100, 285–6, 300; Licht Reference Licht2010). For regimes, which blend democratic and autocratic characteristics, the pattern of risks may feature both higher probability of turnover and less stability of expectations.
Institutions also matter to the extent that the magnitude or direction of hazard forces varies across types. Given what we know about authoritarian and democratic leaders, it seems reasonable to expect that factors such as the rate of economic growth and the frequency of anti-government demonstrations should have different effects on different types of leaders (see tables 7.1 and 7.2 in Bueno de Mesquita et al. Reference Bueno de Mesquita, Smith, Siverson and Morrow2003, 274–5). Specifically, in the case of sanctions, empirical work demonstrates differential effects across and within regime types (Marinov Reference Marinov2005; Allen Reference Allen2008; Escriba-Folch and Wright Reference Escriba-Folch and Wright2010).
Accordingly, the hazards approach forwarded here separates leaders into three types: authoritarian, democratic, and mixed.Footnote 11 For each, a basic hazards model will be specified as
 $$h_{{it}} = h_{{0t}} e^{{\bibeta} ({\bi S}_{{it}} {\plus} {\bi X} _{{it}} )}} ,$$
where h it denotes the probability of failure for leader i at time t; h 0t the baseline risks of failure for all leaders still at risk at time t; β a vector of slope estimates; S it indicators for whether leader i is the target of a threatened or imposed sanction at time t; and X it a vector of covariates for leader i at time t. Certainly, variation within regime types will occur as well. I incorporate within regime type variation via indicators for subclasses of regimes, such as parliamentary democracies and personalist dictatorships as well as substantive controls. Given the strong indications from the literature that both coercive and persuasive foreign policies influence targets differently, depending upon regime type, I include interactions between these subclasses and S it when data permits.Footnote 12 This model will be specified as a Cox proportional hazards model, allowing for the baseline to be estimated without a strict assumption regarding its functional form (see Box-Steffensmeier and Jones Reference Box-Steffensmeier and Jones2004).
Strategic Selection of Targets
Sanctions do not fall randomly upon leaders. Sending states choose sanctions from a range of potential options. The strategic process of selecting targets ensures that leaders under threat or imposition of economic sanctions differ from those who do not. As noted above, however, this is not strictly speaking a selection problem: we have complete observability of our dependent variable via leader failure data. Rather, what must be guarded against is the potential that targeted leaders differ from untargeted leaders, in ways which may impede the accurate estimation of sanctions’ effects on leader survival. In particular, if leaders’ survival prospects play a role in selection, we should worry about our ability to separate the effect of sanctions themselves from the difference between targets and non-targets.
Target stability could factor into sending states’ decisions in two ways. First, senders may explicitly incorporate leader risks into their choice if they believe that ex ante risks will condition the ultimate success of sanctions. Second, target stability may be related to the issue that prompts the international dispute. I discuss each possibility in turn.
Investigations into the onset and success of other foreign policies find support for the idea that potential targets’ security in office matters. In the realm of foreign aid, empirical assessments demonstrate that the risks faced by potential targets affect the likelihood of allocation (Lai Reference Lai2003; Licht Reference Licht2010). Wright (2008) finds that leaders utilize foreign aid differently depending upon their probability of keeping power. Conrad and Ritter (Reference Conrad and Ritter2013) present a formal model and empirical evidence that job security conditions the effectiveness of the Convention against Torture in constraining leaders. Models of crisis bargaining indicate that both leaders’ tenure in office and their sensitivity to removal affect willingness to give in to external demands (Wolford Reference Wolford2007; 2012).
Rational sending states initiate sanction episodes against leaders they believe will be more likely to give concessions. Intuitively, the stability of a leader should affect both ability and willingness to make significant changes to domestic policy at the behest of outside actors. Those who are already backed into a corner by domestic constraints may be less attractive targets. This should be especially the case when the relationship between the sender and target has featured conflict in the past (see Drezner Reference Drezner1999).
Alternatively, target risks may be incidental. Many of the behaviors, which prompt economic censure are related to leader survival. US sanctions against Qaddafi in 2011, for example, addressed his violent crackdown on protesters, a response indicative of a regime under threat from internal disorder. Protectionist actions, another potential precipitator of economic sanctions, may also occur owing to leaders’ fears of losing office.
The direct mechanisms suggest that targeted leaders may be less likely to fail ex ante, whereas the incidental mechanisms suggest the opposite. Which set of causes will produce the majority of observations is an empirical question and not the focus of the current paper. Rather, the aim here is to account for either possibility.
In terms of our hazards model, how might the potential that targeted leaders differ in baseline risks surface? Consider that the probability of being targeted in time t is some function of the risks faced in time t−1. This indicates that the observation of S it depends in some part upon both the baseline hazards and the hazard forces facing a potential target in the time period prior:
 $$\Pr ({\bi S}_{{it}} )=f(h_{{it{\minus}1}} )=f(h_{{0t{\minus}1}} e^{{\bibeta ({\bi S}_{{it{\minus}1}} {\plus}{\bi X}_{{it{\minus}1}} )}} ).$$
Clearly, this raises some problems for inference. If we uncover a positive (negative) coefficient on S it , does it indicate that sanctions destabilize (insulate) leaders? Or does it indicate that leaders under sanction have a higher (lower) baseline risk of losing office before they are targeted?
The hazards framework utilized herein provides a solution to this obstacle and improves over more standard means of accounting for heterogeneity. Stratified hazards models allow us to account for the possibility that some subjects face different baseline risks of failure (Box-Steffensmeier and Jones Reference Box-Steffensmeier and Jones2004). This feature, if properly leveraged, can distinguish whether targeted leaders face higher (lower) risks of losing office owing to a selection process or an independent effect of the sanctions themselves. Therneau and Grambsch note a major advantage of stratified models; they provide “… the most general adjustment for a confounding variable” (Reference Therneau and Grambsch2000, 45).
Achieving this end requires a stratification scheme, which sorts leaders into subclasses with similar baseline risks, while maintaining variation in S it . I accomplish this with nearest neighbor propensity score matching. Reflecting the arguments above regarding the role of ex ante risks, I utilize MatchIt (Ho et al. Reference Ho, Imai, King and Stuart2011) to group “treated” and “control” units into subclasses by an estimate of their probability of failure in the prior year, a measure of the tenor of relations between the state and frequent sanctioners, and the interaction between the two terms. Details on the specification of the prior failure probabilities can be found in the online Appendix, pages 24–9. Then, for each regime type, we can reframe a leader’s risk of losing office at time t as:
 $$h_{{it}} = h_{{0_{k} t}} e^{{{\bibeta} ({\bi S}_{{it}} {\plus}{\bi X}_{{it}} )}} ,$$
where subscript k indicates the strata, k=1, 2, … , K, to which i has been assigned in time t. If the matching routine successfully groups “treated” and “control” units of similar risks of losing office and similar probability of being targeted with sanctions, our confidence in estimating the independent effect of sanctions on survival will be increased.Footnote 13
As this method requires some additional steps, it is important to note that it better addresses the inference problem than easier to implement strategies for heterogeneity. Specifically, the reader may wonder why specifying shared frailties or fixed effects by country would not produce analogous results. If the proposed matching procedure utilized variables, which captured only relatively static factors such as regime type, national military capabilities, or economic industrialization, this would be a difficult question to answer. Matches produced by such a scheme would come from the same state, under different treatment status. However, the procedure outlined above emphasizes the dynamics in leader risk, not the static features of states. This allows matches to be drawn across not just within states.Footnote 14
The research design section below summarizes the results of the matching procedure, demonstrating that subclassification achieves both the goal of sorting leaders into groups of similar ex ante risks and the ability to compare across cases. I then discuss the remaining issues of model selection, including operationalization of measures, and tests for non-proportional hazards.
Research Design
Leaders’ ex ante risks of losing office may matter in the process of sanction targeting owing to strategic or incidental reasons. I seek to control for both mechanisms by matching not only on a measure of probability of failure, but the interaction between leaders’ risks and their relationship to likely sanctioners. Two viable measures of the relationship between the potential target and potential sender states present themselves: one captures a history of conflict, the other security cooperation. The first measure is an indicator for whether the leader’s country has ever been involved in a militarized dispute with one of the top sanctioning states (Ghosn, Palmer and Bremer Reference Ghosn, Palmer and Bremer2004).Footnote 15 The second measure is a weighted count of defense pacts with states that have utilized economic sanctions as a tool of foreign policy.Footnote 16 Using the Correlates of War alliance data version 4.1, I code each defense pact with a sending state (Gibler Reference Gibler2009), multiplying by the relative weight of that sanctioner in the TIES episode year data. Higher values indicate either a more diffuse relationship to states that may use sanctions or a tight relationship with a major user of this foreign policy tool.
For each regime type, I performed nearest neighbor, subclassification matching using three plausible models of targeting, one for each of the measures above, and one using just risks. The most important concern within the hazards framework is that balance be maximized across ex ante risks, so I selected the scheme which performed best in that regard.
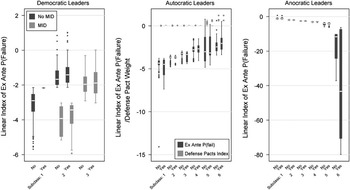
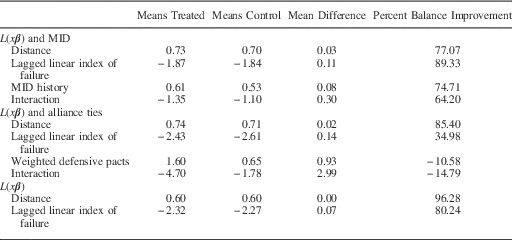
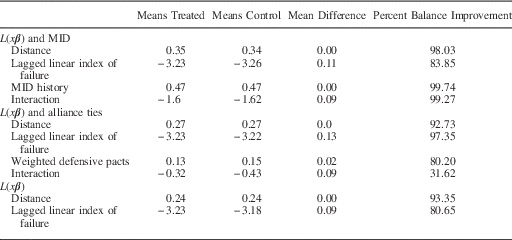
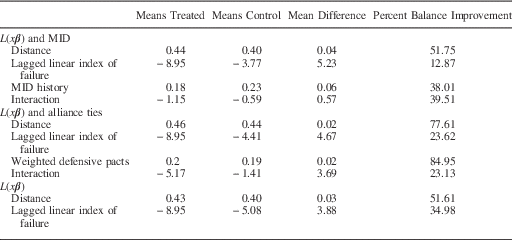
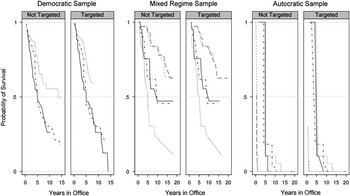
Tables 1–3 summarize the balance statistics across matching schemes. The mixed regime leaders proved difficult to match successfully. The best performing scheme only improves balance on risks by about 35 percent. Although I will report final models for these leaders, we should be cautious in lending too much weight to these findings. For democracies the best performing scheme, using the militarized interstate dispute (MID) interactions, sorts leaders into three subclasses and improves balance on lagged probability of failure by 89 percent. Figure 1 visualizes the results of the matching procedure with respect to risks. The results lend credence to the strategic logic for targeting outlined above. Subclass one contains leaders with very low risks and no history of conflict with frequent sanctioners; subclass two mixes on ex ante risks, containing low risk, potentially hostile leaders with high-risk peaceful leaders; subclass three has leaders with MID history and higher risks.
Matched observations by regime type Note: observations matched using the scheme that best balanced on ex ante risks. For democrats, this includes an interaction with history of conflict with top sanctioning states; for autocrats, an interaction with defense ties to top sanctioners; for mixed regimes, no interactions. For all panels above “no” indicates control cases and “yes” indicates cases which were targeted with sanctions or threats. All matching performed using nearest neighbor, subclassification via MatchIt (Ho et al. Reference Ho, Imai, King and Stuart2011). Regime type classified by cut-points in polity2: democratic, >5; mixed, 5 to −5; autocratic, <−5.

Balance Across Matching Schemes for Democratic Subclasses

MID=militarized interstate dispute.
Balance Across Matching Schemes for Autocratic Subclasses

MID=militarized interstate dispute.
Balance Across Matching Schemes for Anocratic Subclasses

MID=militarized interstate dispute.
Alliance ties and ex ante risks perform best in the autocratic sample, improving balance on risk by 97 percent. The middle panel of Figure 1 shows that within each subclass, the risks of autocratic-treated and control units are very similar. The biggest variation exists in subclass four, but this is the case for both targets and non-targets. Perhaps, owing to paucity of data, the best scheme for anocratic leaders matched simply on ex ante risks. In many of the subclasses, the balance is quite strong with only very safe targeted anocrats differing substantially from their control counterparts, as illustrated in the last panel of Figure 1.
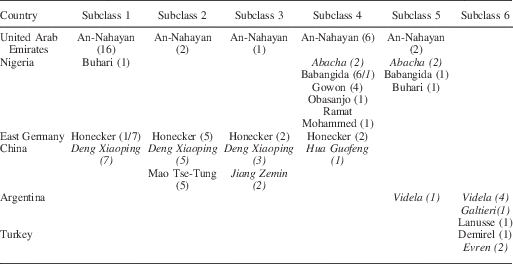
The ability to match treated units to controls to manage heterogeneity in a manner substantively different than a fixed effects approach is a major advantage of this technique. To illustrate this capacity, Table 4 displays the matched leader years for six autocratic countries. Italic indicates targeted leader years. Clearly, the best match for a treated leader year is sometimes a control year for the same leader (see Honecker in subclass 1). However, each subclass contains leaders from many different states, and most countries have leaders placed in more than one subclass as their risks vary over time.
Illustration of Matching Across Units Using Autocratic Sample

Note: leaders were matched on ex ante probability of failure and a weighted index of alliance ties to sanctioner states. Italics indicate that leader is targeted with sanctions. Figures in parentheses give number of leader years for that leader in that subclass. Countries chosen to illustrate target and control units in each subclass, but once selected every leader year for that country within the sample is displayed.
With observations successfully placed into categories of similar probability of being targeted, the strategic process of sanctioning poses much less threat to our ability to estimate the independent effect of sanctions on leader survival. We can now move on to the particulars of specifying stratified Cox models. Having gone to such trouble to achieve unconfounded estimates, we must guard against another source of bias particular to models of this type: violations of the proportional hazards assumption (PHA) (see Box-Steffensmeier and Jones Reference Box-Steffensmeier and Jones2004; Keele Reference Keele2010).Footnote 17
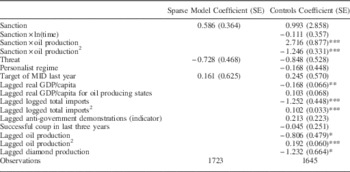
If the effect of a variable changes non-proportionally to those of others in the model over time, estimates of that effect will be biased. Interactions with analysis time should be included to correct this issue, keeping in mind that violations of the PHA may be indicated when mispecified functional form is the real culprit (Keele Reference Keele2010). For each model, I first estimated the most straight forward specification, with traditional functional forms for all control variables. If any continuous variables violated the PHA, I checked alternative functional forms before including interactions with time. In the autocratic model, theoretically interesting variations were revealed by the patterns of PHA violations. Initial PHA tests indicated problems with the following: lagged gross domestic product (GDP) per capita, lagged logged total imports, lagged oil production, and economic sanctions. The final specification includes squared terms for both imports and oil production, an intercept shift for GDP per capita in oil producing states, interactions between oil production and sanctions, and the log of time and sanctions.Footnote 18
Table A14 in the online Appendix summarizes coding and sources for key theoretical variables as well as controls, selected to tap internal and external conditions affecting leaders’ ability to maintain office such as economic growth, civil instability, and institutional differences.
Results
Tables 5–7 display coefficients from the final stratified Cox models. First, however, consider the recovered baseline survivor functions displayed in Figure 2. These baseline probabilities of survival, adjusted for the covariates included in the models, illustrate clearly the heterogeneity in baseline risks across subclasses: the difference is not simply of magnitude, but of kind.

Stratified Cox Model of Democratic Leader Failure

Note: leader years from 1971 to 2004 are the unit of analysis. Units are matched into three subclasses of similar risk of being targeted based on ex ante risks of failure and history of conflict with top sanctioning states. Robust standard errors, in parentheses, clustered on country codes. All figures rounded to four figures after the decimal.
MID=militarized interstate dispute; GDP=gross domestic product.
***p<0.01, **p<0.05, *p<0.10.
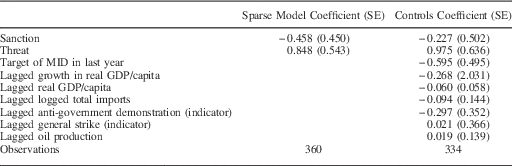
Stratified Cox Model of Mixed Regime Leader Failure

Note: leader years from 1971 to 2004 are the unit of analysis. Units are matched into six subclasses of similar risk of being targeted based on ex ante risks of failure. Robust standard errors, in parentheses, clustered on country codes. All figures rounded to four figures after the decimal.
MID=militarized interstate dispute; GDP=gross domestic product.
***p<0.01, **p<0.05, *p<0.10.
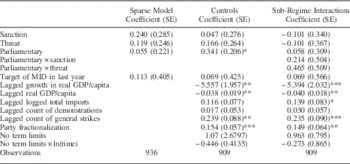
Stratified Cox Model of Autocratic Leader Failure

Note: leader years from 1971 to 2004 are the unit of analysis. Units are matched into three subclasses of similar risk of being targeted based on ex ante risks of failure and alliance ties to sanctioning states. Robust standard errors, in parentheses, clustered on country codes. All figures rounded to four figures after the decimal.
MID=militarized interstate dispute; GDP=gross domestic product.
***p<0.01, **p<0.05, *p<0.10.
Let us turn to the interpretation of external coercion’s effect, beginning with the simplest cases: democratic and mixed leaders, Tables 5 and 6, respectively. Each table first reports a sparse model with only external coercion included. Next, controls are introduced in case variation unaccounted for in the subclassification scheme matters. Finally, in the democratic case, there were sufficient targeted leader failures across sub-regime types to test for conditional effects. In none of these specifications does the effect of economic coercion, either threatened or imposed, reach statistical significance. After accounting for targeting probability, I find no evidence that sanctions destabilize these leaders.
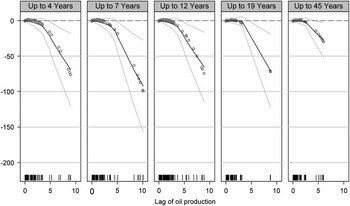
The autocratic leader model in Table 7 requires more careful interpretation, owing to the interactions with time and oil production. In general, neither threats nor imposed sanctions affect autocratic leaders. However, the effect of sanctions for leaders who can rely on natural resources is quite different. To interpret this interaction effect, I calculated the combined coefficient for economic sanctions, taking the derivative of the linear index with respect to sanctions, and calculated confidence intervals for all values within the data set (see Licht Reference Licht2011). Figure 3 contains these estimates and lowess fits of their trend across the quintiles of autocratic leader survival and level of oil production.
Combined coefficient of sanctions over tenure and oil production Note: black curve gives estimate; gray curves give 95 percent confidence intervals, calculated using the formula for the variance of a sum of random numbers. Lowess smoother applied across all cases in sample within each quintile of leader tenure to ease viewing of trend. Upper value of quintiles, listed in panel titles, have been rounded to nearest whole number of years. Gray circles give point estimates for each case in sample. Rug plot at bottom gives frequency of each value of lagged oil production.

The interaction reveals a narrow window of effectiveness for economic sanctions. Autocratic leaders with oil production between 330,000 and 888,000 barrels/day and tenure below the mean may experience heightened risk of political failure when under sanction. This level of production is well over the median, but below the 75th percentile. The finding applies to a very small number of observed leaders but the effect is impressive with risk of failure increased between 177 and 359 percent.Footnote 19
The more obvious effect of sanctions portrayed in Figure 3 is the massive decrease in risks enjoyed by leaders who can rely on natural resource production when under sanction. The insulating effect of sanctions applies to a much broader swathe of leaders: about 20 percent fall into the necessary levels of oil production in this sample. Any fully autocratic leader whose country produces at least 5.3 million barrels per day may benefit enormously when foreign powers attempt to coerce them. This finding lends support to theories that leaders may benefit from the economic distortions created by sanctions through control of resources and rent-seeking dynamics (Kaempfer, Lowenberg and Mertens Reference Kaempfer, Lowenberg and Mertens2004).
Robustness Checks
A prominent position in the literature objects to the treatment of trade disputes, which escalate to the level of sanctions and threats as “economic sanctions” per se, preferring to define sanctions instead as the use of economic means to coerce a change in non-economic policy of a target state (see Pape Reference Pape1997, 1998). The TIES definition of sanctions does not make this distinction; the results reported above treat sanctions about nuclear proliferation equivalently to those about subsidies to domestic industries. I investigated the possible differences between sanction processes across issue areas.
The distinction is less sharp when dealing with leader years rather than sanction episodes as the unit of analysis. In 1979, for example, President Carter faced six separate sanction episodes, from a variety of senders, which famously objected to the US’s political and military policies, including Iran and Libya. At the same time, Thailand threatened sanctions over unfair trade practices. Decades later, George W. Bush’s policies produced 37 ongoing sanction episodes in 2004, 83 percent of which focused on trade. To tap this complexity, I coded a variable that divides the number of trade-related ongoing episodes by the total number using TIES issue1 to determine type. Trade related was coded for all episodes with issue1 codings of “Trade practices,” “Economic Reform,” and “Environmental Policy.” As expected, the proportion of trade disputes differs dramatically across regime types, with 60 percent of sanctioned democratic leaders facing nothing but trade-related sanctions and 60 percent of autocratic leaders facing only military/security-related sanctions. To allow effects to differ in kind across types, I coded dummy variables to capture both all trade and no trade cases, and re-estimated my models with these included. For ease and clarity, I will refer to cases where trade is never the primary issue as “security” based disputes. When data permitted, I also interacted these indicators with threats, to assess whether different types of threats affect leaders. No autocratic leader failures take place under threat with all disputes centering on trade, though, so this further nuance cannot be included. Full regression results can be found in the Appendix.
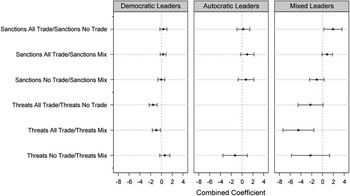
Figure 4 displays hazard ratios constructed to compare the effects of economic coercion over trade versus security issues. The first quantity graphed in each panel directly compares the hazards of a leader under entirely trade to those of an equivalent leader under entirely security sanctions. These effects differ significantly only against mixed leaders, for whom trade sanctions are more destabilizing than others. However, owing to limited success in the matching of these leaders, and the small sample, these more conditional effects should be considered tentative.
Comparing risks of targeted leaders by type of disputes Note: figures plotted are combined coefficients from stratified Cox models including all trade and no trade dummies and their interaction with threats, reported in Table A17 of the online Appendix. Bars give 95 percent confidence bounds calculated using the Delta method via Stata’s lincom utility. Condition ahead of slash is compared with that behind. Positive coefficients indicate heightened risks: negative, lowered. Exponentiating gives the hazard ratio. Autocratic survival time set to mean, oil production to zero for this calculation.

Democratic leaders facing threats piled atop a slate of entirely trade-based disputes enjoy risks of failure about 80 percent smaller than identical leaders facing all security disputes, and about 60 percent smaller than those with a mixed set of disputes. This finding carries more weight if it translates to higher risks compared with untargeted leaders, so I also constructed this comparison. Democrats threatened with further sanctions in security disputes are 200 percent more likely to fail than untargeted leaders (p<0.05). A mixed slate also produces heightened risks. Thus, it appears that the majority of sanctions against democracies are ineffective, but in times of political or military tension, economic coercion can heighten the risks of democrats, possibly producing incentives to offer concessions to sender states.
As before, the autocratic model begs more careful interpretation. In Figure 4, oil production was set to zero and time in office to the mean. I also calculated combined coefficients to compare the risks of targeted autocratic leaders to non-targeted leaders at the 50th, 75th, and 95th percentiles of oil production. Though the point estimates for trade sanctions tended to differ slightly from those of security sanctions, the effects never differed from each other at the 95 percent confidence level.
The online Appendix details these models, as well as several other checks performed to assess robustness. Controlling for costliness of sanctions in terms of estimated costs or dependence on the sender exerts no significant or substantive pull on the results. Differentiating sanctions sent by the United States as opposed to less powerful countries also has little substantive effect on the findings.
Conclusions
The approach undertaken herein accounts for the strategic selection process of sanctioning in a unified theoretical and empirical framework. Matching targeted leaders to untargeted leaders of similar ex ante risks and probability of targeting reduces the likelihood that estimates of the effect of sanctions on survival are confounded by the selection process, while still allowing direct comparison between targeted and untargeted observations. Taking these precautions, improving measures of leader failure and including the threat of sanctions as part of coercion adds nuance to our understanding of sanctions and leader survival.
Democratic leaders are not necessarily easier to destabilize; imposed economic sanctions produce no significant effect. Threats, however, may be more effective against democratic leaders, when the underlying dispute centers largely on issues other than trade policy. Combined, these findings may support the argument that democratic leaders strategically decide to settle sanction episodes at the threat stage, unless they are certain that their constituents will prefer them to stand firm (e.g., McGillivray and Stam Reference McGillivray and Stam2004).
Autocratic leaders, on the other hand, appear both less susceptible to influence via economic coercion than some previous studies suggest (e.g., Escriba-Folch and Wright Reference Escriba-Folch and Wright2010), and less likely to directly benefit than others may have expected (e.g., Wood Reference Wood2008). For most autocrats, sanctions and threats yield no significant effect. A small subset, earning just the right amount of income from inelastic resources, can be impressively hassled by trade disruptions. A somewhat larger group, those with massive oil endowments, experience much lower risks of meaningful failure when targeted.
It is important to note that these findings do not necessarily conflict with extant claims that democratic leaders make more likely targets owing to their higher willingness to offer concessions (Nooruddin Reference Nooruddin2002). The failure of economic sanctions to directly contribute to domestic destabilization does not necessarily mean that they will never “work” in terms of gaining policy concessions. Rather, this analysis suggests that if leaders give in after the imposition of economic sanctions, survival concerns alone do not explain this behavior. If leaders benefit from being targeted, why would they not act so as to maintain their status as champions of the national interest? Perhaps the inefficacy of sanctions on the destabilization front creates an interesting bargaining opportunity, opening the door for issue linkage and negotiation. Or, perhaps, the heirs of sanctions may benefit more from settling these disputes than from continuing them. We know now that sanctions sometimes help but this is not the same as knowing that ending sanctions hurts. New theories of the role of domestic politics in the sanctions game should entertain a more complex process with respect to the interests of domestic constituents and the strategies of accountable leaders. For the time being, however, the results here should cast some doubt on the efficacy of using sanctions primarily as a tool to destabilize foreign regimes.
This analysis also points toward the threats of economic sanction as an important avenue for research. Threats matter not just because they come first but because they can be piled atop existing economic punishments. Facing a new threat out of the blue is unusual; our models should reflect this fact. Threats are not a clean “selection mechanism,” but perhaps a means of exerting additional pressure after a first round of coercion fails. Populations may not interpret the first punishment as an indication of their leader’s incompetency. They may need this message to be reinforced with subsequent threats.
Further, the difference between the effect of threats across regime types and issue areas should deepen our confidence in the literature’s contention that economic coercion works differently within democracies and autocracies. If the reason for a threat matters for the effects on democratic leaders, but not on autocratic leaders, one may suspect that the actual economic dislocation of imposed sanctions produces the (lack of) destabilization in autocratic regimes, while a more symbolic politics of legitimacy and public approval is at work in democracies. This possibility warrants further investigation.
The importance of accounting for strategic selection is a broader conclusion to be drawn from this analysis. Naïve models that treat targeted and untargeted leaders as equivalent cannot arbiter between the effect of sanction themselves and the potential differences in baseline risks across types of leaders. If assessing the role of foreign policy tools on leader’s stability is our goal, we must account first for the potential that targeting is some function of ex ante risks. Bargaining theory suggests that this could be the case in many circumstances, but differences in risk can occur for incidental reasons as well.
Supplementary Material
To view supplementary material for this article, please visit http://dx.doi.org/10.1017/psrm.2015.25