Introduction
The development of efficient devices for energy storage, conversion, and transmission is one of the key priority areas in materials science today. At the focus of these activities is the development of high-energy and high-power battery technologies based on lithium- Reference Scrosati, Hassoun and Sun1,Reference Etacheri, Marom, Elazari, Salitra and Aurbach2 and sodium-ion transport. Reference Kundu, Talaie, Duffort and Nazar3 During the past two decades, a large number of crystalline and glassy cathode, anode, and electrolyte materials for potential battery applications have been developed and characterized. Most lithium- and sodium-ion batteries currently in use still rely on liquid-organic electrolytes, which restricts cyclability due to electrode corrosion. They also present design challenges to avoid leakage and shock damage, and pose safety and environmental concerns in everyday use. Reference Bachman, Muy, Grimeaud, Chang, Pour, Lux, Paschos, Maglia, Lupart, Lamp, Giordano and Shao-Horn4 For this reason, glassy and glass-ceramic inorganic materials play an important role in current efforts to design all-solid-state batteries. Reference Bachman, Muy, Grimeaud, Chang, Pour, Lux, Paschos, Maglia, Lupart, Lamp, Giordano and Shao-Horn4–Reference Ren, Chen, Chen, Liu, Zhang and Nan7 Such systems offer increased safety, environmental sustainability, and simplified cell design. The fractional contribution of the migrating ionic species to the total ionic conductivity is usually near unity in such materials, eliminating complications that might arise from emerging concentration gradients during operation. In addition, the ionic transport number (i.e, the ratio of the ionic conductivity and the total ionic + electronic conductivity of the migrating ionic species) is also usually near unity, which means that only one cationic specie is moving.
The principal challenge in this field still rests with the development of optimized materials having sufficiently high ionic conductivities and appropriate electrochemical stability. The highest alkaline-ion conductivities in the solid state are generally encountered in crystalline compounds with highly concentrated and disordered cation sublattices, termed superionic crystals. Li- and Na-superionic conducting crystals and glass-ceramics have been subject to several recent reviews. Reference Bachman, Muy, Grimeaud, Chang, Pour, Lux, Paschos, Maglia, Lupart, Lamp, Giordano and Shao-Horn4–Reference Berbano, Mirsaneh, Lanagan and Randall13 All of them are characterized by open-framework structures creating periodic three-dimensional (3D) arrays of partially occupied ionic sites at close distances, facilitating 3D ionic motion and transport.
Beside high-ionic conductivities, solid electrolytes for battery applications must meet further demands—they should be stable under ambient atmospheric conditions and possess sufficient oxidative and reductive stability at the interfaces with the cathode and anode compartments. For application as solid electrolytes in solid-state battery devices, fine powders of these crystals have to be well compacted to maximize interparticle contacts. Even so, ineffective ion transport across grain boundaries presents a problem and reduces device performance. Other serious transport limitations arise at the electrolyte–electrode interfaces. In principle, these problems may be avoided by use of suitable glassy solid electrolytes, which are dense and can be prepared in well-defined sizes and shapes (including thin films) by melt cooling or (in the case of the sol-gel process) solution-casting. While many highly ion-conductive glasses are known, Reference Bunde, Ingram and Funke11,Reference Chandra, Bhatt and Chandra12 their ionic conductivities tend to be distinctly lower than those of superionic crystals. In favorable cases, however, these glasses can be converted into ceramic superionic electrolytes by controlled crystallization. These special glass-ceramics combine the benefits of high ionic conductivity with interfacing along with the absence of interparticle transfer complications encountered in the glassy state. During the past decade, numerous systems presenting electrical conductivities in excess of 10–3 (Ω·cm)–1 at room temperature have been identified and have already entered technological development and commercialization.
One particular attractive system is lithium- and sodium-containing glass-ceramics based on the Na-superionic conductor (NASICON) structure. Reference Anantharamulu, Rao, Rambabu and Kumar8 Fu14 demonstrated the possibility of the synthesis of NASICON compounds by the glass-ceramic route. Because the structure accepts solid solutions of a large variety of compositions, this method was applied to numerous precursor glasses, aiming to crystallize different compounds in the NASICON family. This article reviews current progress achieved with these materials regarding both fundamental insights and technological application. To assist composition and microstructure optimization, the structure and dynamics of these materials must be understood at a fundamental level. The present review highlights important contributions made in this respect by solid-state nuclear magnetic resonance (NMR) spectroscopy.
Compositions and preparation routes
The NASICON family comprises a wide range of compounds described by the general formula A(I)1+2w+x–y+z M(II) w M(III) x M(V) y M(IV)2–w–x–y (SiO4) z (PO4)3–z . This formula expresses the formation of crystalline solid solutions based on a fundamental composition A(I)M(IV)2(PO4)3 in which the tetravalent ion M(IV) is substituted by di-, tri-, or pentavalent ions or the PO4 3– anions are substituted by SiO4 4–. Charge balance is restored by incorporation of a corresponding amount of (predominantly monovalent) A cations. Reference Anantharamulu, Rao, Rambabu and Kumar8 Homogeneous regions depend on cation radius ratios and also turn out to be highly influenced by preparation and processing conditions.
While materials have been traditionally prepared via solid-state reactions (“sintering route”), preparations involving the crystallization of precursor glasses (“glass-ceramic route”) have resulted in more homogeneous materials with controllable microstructures. We focus here initially on Li-containing glass-ceramics, which have shown the highest promise for applications in high-energy batteries, and summarize recent work on sodium-based systems in a separate section.
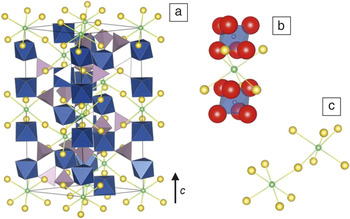
The large majority of lithium-based NASICON materials crystallize in the rhombohedral space group R–3c ( Figure 1 ) structure, discussed here for the representative LiTi2(PO4)3 (LTP). The framework consists of isolated TiO6 octahedra, which are cross-linked by corner-sharing PO4 tetrahedra. The mobile ions (Li+ or Na+) can occupy two interconnected interstitial sites, which are present in a 1:3 ratio: a “regular” six-coordinate site is denoted as Li1 and a second higher-energy site with irregular eight- to tenfold coordination is denoted as Li2. In LTP, the Li1 site is fully occupied, whereas the Li2 site is empty. The size of the window separating the two sites is the main bottleneck for ion transport. This size is controllable by isovalent substitution of the Ti4+ ions.
(a) Representation of a Na-superionic conductor (NASICON) unit cell with MO6 units (blue octahedra), PO4 units (purple tetrahedra), sixfold coordinated L1 position (green spheres), and eightfold coordinated L2 position (yellow spheres). Lines drawn represent pathways for ionic motion between L1 and L2. (b) Close-up view on the L1 site with oxygen atoms (red spheres), showing conduction bottlenecks. (c) Relative configuration of L1 and L2 sites in the cation conduction pathway. Reproduced with permission from Reference Reference Francisco, Stoldt and M’Peko42. © 2015 American Chemical Society.

Experimental results Reference Martinez-Juarez, Pecharroman, Iglesias and Rojo15,Reference Arbi, Rojo and Sanz16 and density functional theory (DFT) calculations Reference Arbi, Rojo and Sanz16,Reference Lang, Ziebarth and Elsässer17 have shown that the activation energy of ionic motion is directly correlated with the sizes of the LiO6 octahedra. More significant conductivity enhancements are achieved, however, by aliovalent ion substitutions (e.g., Al3+ on Ti4+ or Si4+ on P5+ sites). For sustaining charge balance, additional Li+ ions are introduced, resulting in the compositional formula Li1+x+y Ti2–x Al x Si y P3–y O12 (LATP). Reference Aono, Sugimoto, Sadaoka, Imanaka and Adachi18 These are accommodated by the Li2 sites, but on the whole, a redistribution of Li populations takes place. The short Li1–Li2 distances facilitate rapid ion transport between these partially occupied sites.
The extent of the solid-solution range is system dependent. In LTP, Ti4+ substitution by various trivalent ions proceeds up to x = 0.5, with maximum conductivity near x = 0.3–0.4. At higher x values, conductivities tend to decrease. Some researchers ascribe a decrease in conductivity to interference of nonconducting AlPO4, Reference Fu14 while others have found increased conductivity even in the presence of small amounts of AlPO4. Reference Chowdari, Subba Rao and Lee19,Reference Narvaez-Semanate and Rodrigues20 The expulsion of Al3+ from the unit cell may change its dimensions, thus reducing the ionic conductivity.
Electrical conductivity enhancements have been achieved by replacing classical sintering preparation with alternative techniques such as flame pyrolysis Reference Yi, Wang, Mohanty, Kieffer, Tamaki and Laine21 or glass-ceramic routes, Reference Fu14,Reference Narvaez-Semanate and Rodrigues20 the latter yielding materials with controllable microstructures. As LTP and LATP do not form glasses under usual melt-cooling conditions, very rapid splat cooling has to be employed. The electrical conductivities of Li1.3Al0.3Ti1.7(PO4)3 glass-ceramics prepared by this method depend systematically on the annealing temperatures. The highest room-temperature electrical conductivities near 10–3 (Ω·cm)–1 obtained for samples annealed at 1000°C, can be considered satisfactory for solid-state battery applications.
Most recently, electrical conductivities one order of magnitude higher (2.1 × 10⁻² (Ω·cm)–1) have been reported for Cr3+-substituted LTP glass-ceramics with x near 0.5. In this system, the preparation of a parent glass material was possible only through the addition of 5 mol% SiO2, to improve glass-forming ability of the precursor glass. Reference Goharian, Yekta, Aghaei and Banijamali22 The high conductivities reported in Reference Reference Goharian, Yekta, Aghaei and Banijamali22 could, however, not be reproduced in our laboratory and should be reexamined. Promising results (2 × 10⁻³ (Ω·cm)–1 for x = 0.4) were also obtained with glass-ceramics prepared from sol-gel precursors. Reference Xu, Wen, Wu and Yang23,Reference Zhang, Wang, Si, Matsui, Takeda, Yamamoto and Imanishi24
A particular drawback of LATP-based materials is their instability when in contact with metallic lithium electrodes, leading to Ti4+ → Ti3+ reduction. The isovalent analogues with germanium, Li1+x Al x Ge2–x (PO4)3 (LAGP) are thought to be less sensitive toward reduction. Additionally, their glass-ceramic preparation is much easier. Reference Fu25 The room-temperature electrical conductivity of LAGP depends on the heat-treatment temperature Reference Cruz, Ferreira and Rodrigues26,Reference Mariappan, Gellert, Yada, Rosciano and Roling27 and can reach values up to 6 × 10⁻⁴ (Ω·cm)–1. Reference Mariappan, Gellert, Yada, Rosciano and Roling27,Reference Hartmann, Leichtweiss, Busche, Schneider, Reich, Sann, Adelhelm and Janek28 Somewhat higher conductivities (5 × 10⁻³ (Ω·cm)–1 have been reported for LAGP glass-ceramics. Reference Thokchom, Gupta and Kumar29 However, analysis of the impedance data, especially their frequency dependence, Reference Thokchom, Gupta and Kumar29 reveals a misinterpretation of grain and grain-boundary contributions in the complex impedance plots, resulting in overestimation of the ionic conductivity. Hartmann et al. first noted this misunderstanding. Reference Hartmann, Leichtweiss, Busche, Schneider, Reich, Sann, Adelhelm and Janek28 Systematic mechanistic studies by differential scanning calorimetry suggest that Li1.5Al0.5Ge1.5(PO4)3 tends toward internal volume nucleation with a maximum nucleation rate at the glass-transition temperature of 524°C. Reference Cruz, Ferreira and Rodrigues26 Rodrigues et al. were able to control the microstructure of LAGP ceramics by developing specific one- and two-stage crystallization protocols, with average crystallite sizes varying between 220 and 8000 nm. The ionic conductivity was found to increase systematically with increasing crystal domain size. Reference Cruz, Ferreira and Rodrigues26 Glass-ceramics of comparable quality can also be formed by sol-gel methods. Reference Zhang, Takahashi, Imanishi, Takeda, Yamamoto, Chi, Pu and Li30
The electrical conductivity of glass-ceramics is usually measured by impedance spectroscopy. This powerful tool employs alternating current at variable frequencies (usually 1–107 Hz), which allows the characterization of dynamic phenomena with different time constants, such as transport within grains and at grain boundaries, electrode polarization effects, and sometimes, secondary phases. The separation of the relative contributions of grains and grain boundaries may require measurements at varying temperatures.
It is well known that the ionic conductivity in NASICON glass-ceramics is limited by grain boundaries. The high resistivity of grain boundaries has been explained by the precipitation of secondary phases Reference Tokchom and Kumar31 or by the presence of residual glassy material. Reference Mariappan, Gellert, Yada, Rosciano and Roling27 In samples obtained at high temperatures, the latter authors determined a constriction effect and also an increase in the grain-boundary thickness.
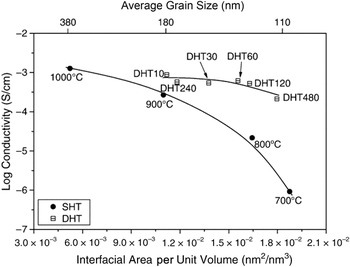
The search for the ionic conductivity–microstructure relationship also yielded interesting results. Reference Narvaez-Semanate and Rodrigues20,Reference Mariappan, Gellert, Yada, Rosciano and Roling27 A difference in conductivity was found in LATP samples with the same grain size, when samples were obtained by single or double heat treatment, as shown in Figure 2 . The origin of this difference needs to be investigated further.
Electrical conductivity at room temperature of Li1.3Al0.3Ti1.7(PO4)3 glass-ceramics obtained by single heat treatment (SHT) and double heat treatment (DHT) as a function of average grain size and interfacial area. The heat-treatment temperatures for glass-ceramics obtained by SHT and the durations of the nucleation treatment at 606°C for the DHT glass-ceramics are indicated. Line plots are shown as guides to the eyes. Reference Narvaez-Semanate and Rodrigues20 The data reveal that the electrical conductivities of single- and double-heat-treated samples are different, despite similar grain sizes, with an advantage for double heat treatment. Because the temperature of the final heat treatment induces changes in the NASICON cell, it is more relevant to compare the ionic conductivity of the DHT samples (final heat treatment at 900°C) to that of the SHT sample heat treated at 900°C.

Aspects of structure and dynamics
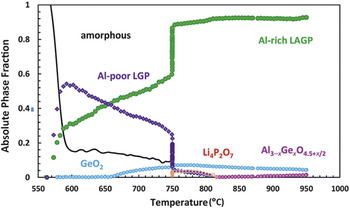
Incorporation of Al into the LAGP structure manifests itself by a significant increase in the lattice parameter c of the hexagonal unit-cell description of the R-3c structure from 20.46 to 20.64 Å (for x = 0.5). The conversion of LAGP glass to the crystalline state has been monitored in situ by synchrotron x-ray diffractometry. Reference Safanama, Sharma, Rao, Brand and Adams32 These studies reveal that the Al content of the resulting solid-solution phase keeps increasing with increasing annealing temperature and only reaches the final x value above 770°C. Figure 3 shows the phase composition as deduced from this study. Heating above 950°C results in sample decomposition by the formation of AlPO4.
Temperature dependence of absolute phase fractions of Al-rich Li1+x Al x Ge2–x (PO4)3 (LAGP) and Al-poor LiGe2(PO4)3 (LGP) phases along with the amorphous and impurity phases. The data reveal that the Al content of the crystalline superionic LAGP phase increases with increasing heat-treatment temperature and only reaches the final x value above 770°C. The increase in the Al-rich phase is followed by a decrease in the amorphous phase. These changes may explain the increase in ionic conductivity observed for single heat-treatment glass-ceramics samples shown in Figure 2. Minor phases such as GeO2, Li4P2O7, Al3–x Ge x O4.5+x/2 are also quantified. Reproduced with permission from Reference Reference Safanama, Sharma, Rao, Brand and Adams32. © 2016 Royal Society of Chemistry.

Recently, the structural aspects of the glass-to-crystal transition in LAGP have been studied by solid-state NMR.
Reference Schröder, Ren, Rodrigues and Eckert33–Reference Liu, Venkatachalam, Kirchhain and van Wüllen36
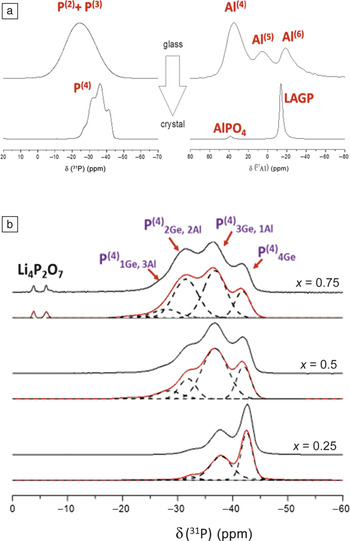
Substantial changes in the 31P and 27Al MAS-NMR (magic angle spinning-NMR) spectra indicate that the crystallization of the glasses is accompanied by significant modifications in the local environments of the phosphate and the aluminum species (see
Figure 4
). The structure of LAGP glasses is dominated by P(3) (ultraphosphate) and P(2) (metaphosphate) units linked to both four- and six-coordinated Ge and Al species, whereas the crystal structure features exclusively P(4) units linked to six-coordinated Ge or Al atoms. The distinct local
 ${\rm{p}}_{\left( {4 - n} \right)Ge,n{\rm{AI}}}^{\left( {\rm{4}} \right)}$
environments can be differentiated and quantified from 31P MAS-NMR spectra. One can then deduce the extent of Al incorporation into the NASICON structure according to the formula:
Reference Arbi, Mandal, Rojo and Sanz37
 $${{A{l^{3 + }}} \over {G{e^{4 + }}}} = {{4{I_4} + 3{I_3} + 2{I_2} + {I_1}} \over {{I_3} + 2{I_2} + 3{I_1} + 4{I_0}}} = {x \over {2 - x}}$$
,
where I
n
denotes the 31P signal areas attributed to the various
 ${\rm{p}}_{\left( {4 - n} \right)Ge,n{\rm{AI}}}^{\left( {\rm{4}} \right)}$
sites.
Solid-state nuclear magnetic resonance (NMR) characterization of Li1+x Al x Ge2–x (PO4)3 (LAGP) glass-ceramics. Reference Schröder, Ren, Rodrigues and Eckert33 (a) Spectroscopic changes observed in the 31P (left) and 27Al (right) MAS-NMR spectra indicate significant structural changes upon the glass-to-crystal transition. References for the chemical shifts, δ, are 85% H3PO4 and 1 M Al(NO3)3 aqueous solutions, respectively. (b) Multiple resonances observed in the 31P MAS-NMR spectra of LAGP samples with different stoichiometries x illustrate different local environments of the phosphate species. Black and red curves represent experimental and simulated spectra, respectively; dashed curves show the contributions of the individual components to the simulated spectra. Note: MAS, magic angle spinning.

While these individual resonances are strongly overlapped in crystalline LATP solid solutions,
Reference Arbi, Mandal, Rojo and Sanz37
greater chemical shift discrimination is seen in the LAGP system.
Reference Schröder, Ren, Rodrigues and Eckert33–Reference Liu, Venkatachalam, Kirchhain and van Wüllen36,Reference Arbi, Bucheli, Jimenez and Sanz38
By comparing the intensity profiles of the various
 ${\rm{p}}_{\left( {4 - n} \right)Ge,n{\rm{AI}}}^{\left( {\rm{4}} \right)}$
resonances with those predicted from Equation (1), one can judge the homogeneity of the Al distribution. In addition, Al not incorporated into the crystal structure manifests itself by a 27Al resonance near –39 ppm, attributable to crystalline AlPO4. Further detailed ex situ NMR studies indicate that in samples with x > 0.5, AlPO4 precipitates in the form of a disordered phase at the early crystallization stages and is then gradually incorporated into the LAGP structure as the crystallization temperature is raised up to about 800°C.
Reference Liu, Venkatachalam, Kirchhain and van Wüllen36
Above 850°C, the LAGP structure falls apart. These results are in good general agreement with in situ XRD results.
Reference Safanama, Sharma, Rao, Brand and Adams32
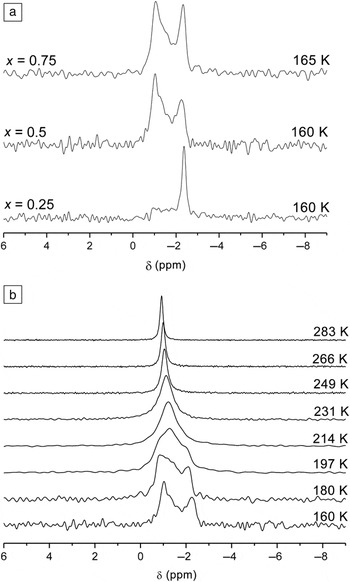
The two distinct lithium sites show a ∼1 ppm chemical shift difference in the 6Li MAS-NMR spectrum at 160 K. As shown in Figure 5 for an LAGP sample with x = 0.25, the Li(1):Li(2) peak area ratio is close to 1:0.25 expected if the Li1 site remains fully occupied and only the lithium ions in excess of the stoichiometric LiGe2(PO4)3 (LGP) composition occupy the Li2 sites. This agrees with conclusions drawn from the c/a lattice constant ratio, which is also correlated with the site populations. Reference Arbi, Tabellout, Lazarraga, Rojo and Sanz39 A different situation occurs in the x = 0.5 sample, whose spectrum suggests a Li(1):Li(2) ratio of ∼1:2 (instead of 1:0.5), clearly indicating a significant redistribution of the lithium ions between both sites. This effect results from a minimization of Li+–Li+ repulsive interactions. At higher temperatures, NMR signal coalescence effects indicate ionic interchange between these two sites on the NMR time scale (∼10–2 s).
(a) 6Li MAS-NMR (magic angle spinning-nuclear magnetic resonance) spectra near 160–165 K of Li1+x Al x Ge2–x (PO4)3 (0 ≤ x ≤ 0.75) samples. The signals near –2.1 ppm and –0.9 ppm arise from the Li1 and the Li2 sites, respectively, defined in Figure 1. The reference for the chemical shift δ is 1 M aqueous LiCl solution. (b) Temperature-dependent signal coalescence and signal shifts in Li1.5Al0.5Ge1.5(PO4)3 owing to Li1 ↔ Li2 site interchange and population redistribution effects. Reference Schröder70

Finally, above room temperature, this transfer occurs so quickly that one observes only an average local 6Li environment. The center of gravity continues shifting toward higher frequencies, indicating that the lithium site distribution changes with increasing temperature, approaching the expected 1:3 statistical limit. The results of these studies confirm the conclusions from previous static 7Li NMR studies, which have analyzed the effect of the lithium-ionic motion upon the strength of internuclear 7Li–7Li dipole–dipole, and nuclear electric quadrupolar couplings and spin-lattice relaxation times. Reference Martinez-Juarez, Pecharroman, Iglesias and Rojo15,Reference Arbi, Paris and Sanz40,Reference Francisco, Stoldt and M’Peko41
Combining the two strategies of iso- and aliovalent doping for further increasing the ionic conductivity of LAGP ceramics by virtue of Sn substitution has only met with limited success. Reference Santagneli, Baldacim, Ribeiro, Kundu, Rodrigues, Doerenkamp and Eckert34,Reference Francisco, Stoldt and M’Peko42 This has been attributed to local distortions of the bottleneck regions caused by the large cation radius disparity between Ge4+ and Sn4+ ions, leading to charge-carrier trapping. Reference Francisco, Stoldt and M’Peko42
Na-ion conducting NASICON glass-ceramics
Na-ion conducting NASICON systems present a much wider compositional variety than the corresponding Li-ion conductors. The literature reports more than 100 systems. The relevant crystal chemical parameters influencing ion-transport properties have been discussed in recent reviews Reference Anantharamulu, Rao, Rambabu and Kumar8,Reference Guin and Tietz43 and structural investigations by NMR have also been reported. Reference Losilla, Aranda, Bruque, Sanz, Paris, Campo and West44,Reference Losilla, Aranda and Bruque45 Various Na-conducting NASICONs have recently attracted interest for solid-electrolyte applications in sodium batteries, Reference Kundu, Talaie, Duffort and Nazar3,Reference Vignarooban, Kushagra, Elango, Badami, Mellander, Xu, Tucker, Nam and Kannan46 whose development is motivated by the 10,000-fold higher natural abundance of sodium as compared to lithium. These materials generally have higher alkali contents than the Li-NASICONs.
Zr-based NASICONs, such as Na3Zr2(SiO4)2PO4, are widely studied for these applications. Reference Honma, Okamoto, Togashi, Ito, Shinzaki and Komatsu47 Alloying with sodium niobium phosphate glasses enhances their conductivities even further. Reference Honma, Okamoto, Togashi, Ito, Shinzaki and Komatsu47 Another strategy is Sc– substitution. Reference Subramanian, Rudolf and Clearfield48 In this context, an extremely promising material, Na3+x Sc2(SiO4) x (PO4)3–x with room-temperature electrical conductivity of 7 × 10⁻⁴ (Ω·cm)–1 was recently prepared by a solid-state reaction. Reference Guin, Tietz and Guillon49 The glass-ceramic route for this material should be attempted. The high Na content, however, makes it difficult to form precursor glasses for these compounds. To date, glass-ceramic compositions have been restricted to the Na-analogues of LAGP Reference Zhang, Wen, Liu, Song and Wu50,Reference Zhu, Li, Li, Zhou and Wu51 and LATP. Reference Nieto-Muñoz52 While these materials have significantly lower room-temperature conductivity (∼10–6 (Ω·cm)–1) than their Li analogues, they may become interesting for higher-temperature applications. Further promising new glass-ceramic NASICON materials were recently reported using Ga-substituted NGP Reference Li, Jiang, Lv and Zheng53 and nano-sized NTP (NaTi2(PO4)3) crystallized from a fluoride phosphate glass matrix, with a surprisingly high room-temperature electrical conductivity of 3 ×10⁻⁵ (Ω·cm)–1. Reference Ni, Zheng, Tan, Yue, Lv, Yang, Song, Yu and Wei54
Applications
Various types of lithium-ion batteries make use of LATP and LAGP NASICON-type materials. Such applications include lithium/water, Reference Katoh, Inda, Nakajima, Ye and Baba55 lithium/air, Reference Inda, Katoh and Baba56 and all-solid-state lithium batteries. Reference Imanishi, Matsui, Takeda and Yamamoto57
NASICON ceramics are used commercially as ion-conducting separator membranes in lithium/air batteries currently touted as promising high-energy storage devices because of their theoretical energy density of 11,140 Wh/kg, Reference Sun58 which is one order of magnitude higher than currently used storage devices. These batteries use highly corrosive LiCl and LiOH liquid electrolytes. LATP and LAGP ceramics, which are very stable in such environments, Reference Zhang, Takahashi, Imanishi, Takeda, Yamamoto, Chi, Pu and Li30,Reference Shimonishi, Zhang, Imanishi, Im, Lee, Hirano, Takeda, Yamamoto and Sammes59 serve to prevent contact of the liquid LiCl/LiOH electrolyte with the lithium anode. The use of NASICON/polymer electrolyte composites has resulted in further cell-performance improvements. Reference Safanama, Damiano, Rao and Adams60,Reference Shi, Xia, Han, Fang, Pan, Xu and Liu61
X-ray photoelectron spectroscopy and ionic conductivity studies have shown that NASICON materials are unstable when in contact with metallic lithium, Reference Hartmann, Leichtweiss, Busche, Schneider, Reich, Sann, Adelhelm and Janek28 however, LAGP electrolytes have been implemented in all-solid-state lithium-ion batteries with Li anodes. Reference Feng, Yan, Liu, Lai and Li62
Finally, Li-based NASICON materials can also be reversibly intercalated and de-intercalated with Li ions. This feature makes them potential candidates for battery-cathode materials. Reference Feng, Xia, Lai and Li63–Reference Liu, Li, Kitaura, Zhang, Han, He and Zhou65 Paramagnetic shifts observed in solid-state NMR spectra have shown that Li intercalation into LATP proceeds via reduction of Ti4+ to Ti3+. Reference Arbi, Kuhn, Sanz and Garcia-Alvarado64 This process is associated with a reversible charge capacity of 69 mAh/g.
Recently, an all-solid-state lithium/air battery was assembled using a Li foil anode, LAGP solid electrolyte, and a nanocomposite cathode consisting of single-walled carbon nanotubes and LAGP. The battery shows good cycling performance with a reversible capacity of 1000 mAh/g at a current density of 200 mA/g. Reference Liu, Li, Kitaura, Zhang, Han, He and Zhou65 While NASICON-based glass-ceramics have thus far not played a significant role in cathode design, a promising candidate, Li3V2(PO4)2F3, with good electrochemical properties and a high electrical conductivity (1.7 × 10⁻³ S/cm 1), has recently been prepared from a fluoride phosphate glass melt. Reference Pietrzak, Michalski, Wasiucionek and Garbarczyk66
The related sodium compound, Na3V2(PO4)3, is a commonly employed electrode material in sodium-ion batteries, which utilize the NASICON solid electrolyte Na3Zr2(SiO4)2PO4. Reference Noguchi, Kobayashi, Plashnitsa, Okada and Yamaki67–Reference Schröder70 Glass-ceramic preparation procedures for these materials have not yet been reported, but they are expected to improve the performance of these devices in the future.
Conclusions
We have reviewed the current state of the literature concerning the fundamental science and applications of glass-ceramic solid electrolytes based on the NASICON structure. The glass-ceramic route can improve the ionic conductivity, especially allowing for microstructure control. Solid-state NMR methods provide element-selective, inherently quantitative insights into structure and dynamics, improving our understanding of the structure–function relations in these materials.
Acknowledgments
Support by FAPESP (São Paulo Research Foundation), Grant No. 2013/07793–6 (CeRTEV—Center for Research, Technology, and Education in Vitreous Materials) is most gratefully acknowledged.

Hellmut Eckert is a full professor at the São Carlos Institute of Physics of the University of São Paulo, Brazil. He obtained his PhD degree in 1982 from the Universität Münster, Germany, and completed postdoctoral fellowships at Rutgers, The State University of New Jersey, and California Institute of Technology. He served as a professor of chemistry at the University of California, Santa Barbara (1987–1996) and at the Universität Münster (1995–2014). He is currently editor-in-chief of the journal Solid State Nuclear Magnetic Resonance. He received the Haber Prize of the Deutsche Bunsengesellschaft in 1989 and the George Morey Award of The American Ceramic Society in 2016. His research focuses on the structural analysis of glasses and glass-ceramics using modern magnetic resonance techniques. Eckert can be reached by phone at + 551633738775 or by email at eckert@ifsc.usp.br.

Ana Candida Martins Rodrigues has been a professor of materials science at the Federal University of São Carlos, Brazil, since 1989. She earned her PhD degree in electrochemistry of solids in 1988 at Polytechnic Institute of Grenoble, France. She was a guest professor at the Otto Schott Institute of Materials Research at the Friedrich-Schiller-Universität Jena, Germany. She is the Brazilian representative of the International Commission on Glass’ Technical Committee on Glass Education (TC23) and also the Education and Outreach Coordinator of the Center for Research, Technology, and Education in Vitreous Materials. Her current research focuses on the controlled crystallization of NASICON-type glass-ceramics, and on microstructure–conductivity relationships, and also in mixed ionic-electronic glasses. Rodrigues can be reached by phone at +551633518524 or by email at acmr@ufscar.br.