The emergence of permanently organized and disciplined political parties represents one of the most important developments in the history of modern parliaments.Footnote 1 While there is a vast literature on the influence of parties in the legislative arena today, we lack a clear understanding of how party org1anizations transform over time. Scholars generally agree that as the influence of representative assemblies increased during the nineteenth century, a number of countries began experiencing major political changes that prompted lawmakers to modify their behaviour in the legislature. As a result, parties became increasingly unified, primarily in response to the extension of suffrage and the modernization of the legislative process.Footnote 2
Although previous research appears to suggest a direct relationship between parliamentary organization and electoral politics, we find a wide range of competing theories to explain the emergence of party cohesion in the legislative arena.Footnote 3 Thus far, scholars have claimed that several different factors, such as the centralization of the leadership structure or the changing ideological preferences of members (either through replacement or socialization), have contributed to an increased number of partisan votes in the British Parliament and American Congress throughout the nineteenth century.Footnote 4 And while this trend has been observed in many other established democracies since then, empirical studies of these older cases are scarce and offer an incomplete picture of the development of party cohesion, because they only consider a few legislative terms.Footnote 5 The lack of comparable historical data has made it difficult for researchers to determine whether a common set of factors might in fact explain the emergence of organized political parties outside of the Anglo-American context.
This is unfortunate, especially if we consider that disciplined and cohesive political parties now represent a central feature of most parliamentary systems.Footnote 6 Nowhere has this development been more apparent than in the Westminster model of government, where party discipline has long been associated with the principle of collective ministerial responsibility. Indeed, political scientists are often reminded of the so-called ‘golden age of parliament’, when individual lawmakers had the ability to influence the legislative process, introduce bills, and hold members of the executive accountable for their actions.Footnote 7 At some point during the twentieth century, however, this independence was lost. Party leaders found a way to impose their will on the membership of the House of Commons – not only in Westminster, but also in former British colonies, including Canada, Australia and New Zealand. How did we move from an institution influenced by independently minded members to one dominated by disciplined parties? Put differently, why did political parties become increasingly unified and cohesive over time?
The work presented here attempts to answer these questions by evaluating different theories of legislative party development across the life span of one legislature: the Canadian House of Commons (1867–2011). We assess the influence of four of the most commonly identified factors in the literature that are said to explain the increase in party voting unity over time: partisan sorting, the replacement of members, electoral incentives, and the content of the legislative agenda. Our study is unique in that it uses the most extensive dataset of parliamentary voting records to have been collected outside of the British and American contexts. Not only do these data include information about the outcome of every single roll-call vote (division) documented after Canada’s first Parliament, it also reports on the subject of the votes, their sponsors, and the category of motions under consideration. By combining what we know about individual legislators, elections, and the content of the legislative agendas, we are able to evaluate which of these factors are most likely to influence the growth of partisanship over time.
While the focus here is on the Canadian legislature, we have strong reasons to expect that the development of party voting unity in this case closely follows the American and British experiences.Footnote 8 Canada has one of the oldest continuous parliamentary systems in the world. The country’s first colonial legislative institutions were established during the eighteenth century, and the Westminster model of government was fully transplanted by the time of Confederation in 1867. Canada also shares many of the characteristics of its nineteenth-century American neighbour, such as federalism, the absence of a feudal class-structure, a homestead frontier economy, and a relatively broad electoral franchise. But perhaps more importantly, all three countries have maintained a set of common political institutions over the years as well, like geographically based representation and plurality elections, which cultivate a direct link between legislators and their constituents. Taken together, the previous institutional features suggest that Canada represents an ideal case for explaining the emergence of legislative party influence in Anglo-American democracies, precisely because it provides a bridge between these two types of political systems.
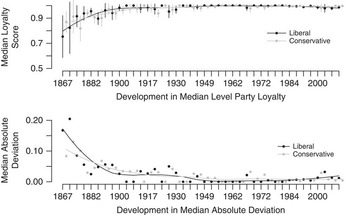
Although party discipline is high in Canada today, it has not always been so.Footnote 9 Party unity was much weaker in the years following Confederation.Footnote 10 For instance, we know that the earliest parliaments contained many independent members, or ‘loose fish’, who were gradually replaced by more loyal party supporters.Footnote 11 The extent of this change can be seen in Figure 1, which plots the evolution of voting unity for Canada’s two historically dominant parties, the Conservatives and the Liberals. The measure used to summarize voting loyalty is the average proportion of divisions in which all of the Members of Parliament (MPs) from a party voted with the majority of their caucus in a given legislative term. The top plot of Figure 1 highlights the medians of these unity scores for the whole period (1867–2011), whereas the bottom plot displays the change in the median values in each term.
Party voting loyalty and party unity in the Canadian House of Commons (1867–2011) Notes: The first plot of Figure 1 reports the evolution of the median level of party voting unity for both the Conservative and Liberal parties. The second plot reports the value of the median absolute deviation for each party. The lines are Loess curves fitted locally on the x axis.

Both graphics show that there was a marked increase in the level of voting unity in the first few decades following Confederation. However, the deviations from the median do not converge towards 0 until much later. If anything, the plots suggest that near perfect unity was not achieved until the second half of the twentieth century and that the influence of parties appears to have fluctuated over time.
This overall change in partisanship raises several important questions about the origins of party influence. First, how can we explain the variations in the levels of voting loyalty after the first Parliament? Can the professionalization and replacement of members account for the surge in partisan behaviour?Footnote 12 Is this increase linked to electoral pressures or to the gradual expansion of the franchise?Footnote 13 Is this observed shift a consequence of the changing content of the legislative agenda?Footnote 14 Or can the change be explained by the fact that party leaders increased their influence over the legislative process by limiting the right of private members to introduce motions or bills in the legislature?Footnote 15
In this analysis, we demonstrate that each one of the previous explanations, taken on its own, fails to account for the development of party unity in Canada. Although this increase in partisan behaviour appears to have followed the Anglo-American example during the second half of the nineteenth century, we suspect that different mechanisms were involved. Canada was still very much a rural country with a relatively small electorate until the end of the First World War. The rules and procedures of the Canadian House were also simple; the government’s struggle to control the agenda was largely over by 1913, and the next wave of important reforms did not occur until 1968.Footnote 16 In the end, a bi-cultural and regionally diverse population combined with a single member plurality electoral system produced unusual tensions in the national legislature. This ultimately resulted in the multiplication of regional parties and in more frequent minority governments after the First World War.
The previous development stands in sharp contrast to the British and American experiences, where electoral and legislative reforms were introduced earlier and preceded the consolidation of parties in the legislature.Footnote 17 In the discussion section of the article, we return to this comparative analysis to determine whether there is a set of common factors to explain the emergence of party unity across different types of political systems.
The study is organized as follows. In the first section, we review the most important factors identified in the literature to explain the emergence of party cohesion in the legislature. In the second section, we present the data and measures used in this study. In the third section, we report on the results of the empirical analyses to account for the development of party voting unity in Canada. And in the final two sections, we review our findings and conclude.
LEGISLATIVE VOTING AND PARTY UNITY
The most common approach for studying the development of legislative party voting unity has been through the analysis of roll-call votes or recorded divisions, where unity is usually measured by calculating how frequently members vote together in the legislature. Starting with the work of Lowell and Rice, studies have shown that parties tend to become more cohesive over time, not only in more established democracies such as in Britain, but also in newer ones such as those found in Eastern Europe or in the European Parliament.Footnote 18
Several theories have been proposed to explain these transformations. One strand of research argues that legislative behaviour is determined by individual preferences and that parties are created in order to reduce co-ordination problems and transaction costs among legislators.Footnote 19 This approach has been used primarily to analyse the emergence of parties in the United States Congress, but also to suggest that legislators support party leaders to promote collective electoral goals.Footnote 20 A second strand of research links the emergence of disciplined political parties more directly to institutional changes.Footnote 21 Here, the introduction of different organizational constraints – such as voting procedures, primary elections, legislative committees, or electoral rules – are said to influence cohesion.Footnote 22 This view is perhaps best represented by the work of Cox, who shows that the increase in the level of partisanship observed in Westminster during the Victorian era is explained by the extension of the franchise and by the fusion of legislative and executive branches in parliament.Footnote 23
From these two theoretical perspectives, scholars have identified several different factors to account for the variations in the levels of partisanship found across different types of legislatures.Footnote 24 Of course, not all of these determinants are relevant to the Canadian context. Some, such as the plurality voting rule, remain constant over time, while others, such as the content of the legislative agenda, change from one parliament to the next. Because we are interested in understanding the growth of partisanship in one specific legislature, the analysis presented below focuses primarily on the elements that can explain the development of party voting unity in more than one legislative term. We have grouped these factors into four categories and show in the remainder of this section how they relate to the Canadian context.
The first group is linked to extra-parliamentary party organization and electoral incentives. Perhaps the most important of these is the expansion of the franchise. Cox explains that as the size of the electorate grew in England during the nineteenth century, MPs had to rely increasingly on partisan organizations to get elected.Footnote 25 Thus, members of the same caucus developed a collective incentive to protect their party’s brand in the legislature: first, by promoting a common set of public policies; and second by supporting leaders in the assembly. In the same vein, the emergence of a more partisan electorate may also have generated additional incentives for members to support their caucus, especially if voters expected their representatives to follow the party line.
In the Canadian context, we must consider the possibility that the increase in the number of voters influenced the development of legislative party voting unity as well. Although the franchise was comparatively higher in Canada than in the Britain during the nineteenth century, there was still an increase in the number of voters after 1898 when universal male suffrage was introduced, and later again in 1918 when women were allowed to vote for the first time.Footnote 26
The second group of factors is linked to the socialization of members.Footnote 27 Scholars have noted that legislators tend to become more loyal as their legislative career progresses. In this context, party unity could result from internalized norms of caucus solidarity, which can then be reinforced over the course of a legislative career.Footnote 28 It is also possible that the development of party unity is linked to the gradual replacement of independent members elected in earlier terms, when party leaders may have been less influential.Footnote 29 If so, the surge in partisanship observed in Canada could be explained by the professionalization of the legislature and the subsequent election of more career oriented and loyal members.
The third group of factors relates to the internal organization of the legislature. The fact that the Canadian House of Commons operates under a Westminster parliamentary system is likely to explain why party discipline is so high in the first place, because caucus solidarity is necessary for a government to remain in office. In this type of legislature, members have an incentive to support their leaders, even when in opposition, since cohesive parties are more likely to be rewarded by voters.Footnote 30 It is important to note, however, that the confidence convention of responsible government cannot, on its own, explain the development of party unity in Canada. Indeed, this custom was already in place at the time of Confederation, when partisanship was lower.
Cox also highlights the rewards given by the executive in exchange for support in the legislature.Footnote 31 Most likely, the biggest prize is to be named to the cabinet, followed by other promotions such as becoming a parliamentary secretary or a committee chairman. In Canada, loyal members could also be appointed judges, provincial governors or senators.Footnote 32 However, since the availability of these patronage opportunities remained relatively limited until the 1960s, it is unlikely that they could have had a significant effect on the growth of partisanship in the legislature.
Another important aspect of legislative organization that can influence party unity relates to agenda-setting powers. According to Cox and McCubbins, leaders can always maintain party cohesion by preventing debates over bills or motions that have the potential to divide the caucus internally.Footnote 33 This is likely to occur when the leadership has the power to determine the content of the legislative agenda. This concept of negative agenda control has mostly been used to analyse party voting in the United States Congress, although we find evidence of this strategy in other legislatures as well.Footnote 34 In Canada immediately following Confederation, the proceedings of the House of Commons were roughly divided equally between government and private member business. However, over time, the amount of government activities and workload increased dramatically. Eventually, between 1906 and 1913, the rules governing the legislative agenda were modified to reflect this reality.Footnote 35 It follows that once the government won the right to control most of the business of the House, it became easier to prevent backbenchers from debating controversial issues in the legislature.
The fourth and final group of factors linked to the development of party voting unity is ideology and partisan sorting. As Krehbiel and Ozbudum explain, members of the same party can consistently vote together in the legislature, not because of party pressure, but because they share common policy preferences.Footnote 36 In this context, a growth in partisanship could simply reflect a better match between party affiliation and the ideological views of legislators. Unfortunately, it is very difficult to disentangle the influence of party discipline and ideological cohesion when analysing the sources of party loyalty. Here, we circumvent this problem by using three extra-parliamentary measures of preferences – language, profession and geography – to identify regional factions within the two major parties, and assess their influence on caucus cohesiveness over time.Footnote 37
To summarize, we have identified four different groups of internal or external factors that could explain the development of legislative party organization. So far in the British House of Commons, the focus has generally been on measuring the impact of electoral incentives on party loyalty and on determining whether cohort or replacement effects can account for the greater partisanship observed during the Victorian era.Footnote 38 In the Canadian context, there is no clear evidence to suggest that elections matter in explaining the increase in party voting unity during the first ten parliaments.Footnote 39 However, it is possible that the high levels of partisanship observed in later terms are related to the gradual replacement of more independent members and to the professionalization of the legislature.Footnote 40 It could also be linked to the ideological cohesiveness of the caucuses, or the ability of party leaders to control the legislative agenda.Footnote 41 In order to measure these sources of party influence, we outline in the next section a research strategy that estimates how individual legislator characteristics and the content of the legislative agenda affect voting behaviour in the legislature.
LEGISLATIVE VOTING RECORDS
This section describes the data and methodology used in the empirical analysis. The data were collected from the Canadian parliamentary debates of the House of Commons between 1867 and 2011. For the first thirty-four Parliaments, each recorded vote was coded by a team of research assistants. These votes were identified from the Hansard Journals and transcribed directly into the dataset. For the subsequent Parliaments (35th to 40th), an automated coding scheme was used to transcribe the votes from the online published records available on the Canadian Parliament website.
Because divisions are recorded by the names of the MP only, we matched the recorded votes with a biographical file built from the historical listing of the Members of the House of Commons (also available on the Canadian Parliament website). These data were supplemented by the online records of Election Canada’s Historical Results in Federal Electoral Ridings.
Overall, the data contain 4,093 Conservative and Liberal Members of the House of Commons and a total of 10,893 divisions recorded between 1867 and 2011 (Appendix A provides a summary of the distribution of this variable over time). This gives us 1,979,233 individual voting decisions. A division is recorded in the debates if a request is made to the Speaker by at least five members. This rule has been in place for the entire period under investigation. A member can either vote Yay, Nay, or be paired.Footnote 42 Abstentions are not recorded; therefore, we cannot differentiate between members who abstained from voting voluntarily or involuntarily – although in the first few decades after Confederation, a strict attendance rule was maintained in the House.Footnote 43
As we indicated earlier, we are interested in identifying what factors explain the increase in partisanship over time. Our investigation is limited only to the two parties that were in the government between 1867 and 2011 – the Conservatives and Liberals. However, as we will see later, the arrival of third parties in the 1920s played an important role in consolidating party unity.
Our analysis focuses on two aspects of voting behaviour: individual level party loyalty and vote-specific party unity.Footnote 44 Party loyalty is calculated for each individual MP and reports the proportion of votes in which a member sided with a majority of his or her caucus on all of the recorded divisions in a given parliament.Footnote 45 Note that there are no party tellers in the Canadian Parliament, therefore we cannot assume that whips always represent the official party position.Footnote 46 In Appendix B, we use a different specification for this variable to consider only divisions related to motions introduced by members of the cabinet (which should be closest to whipped divisions). The second unit of analysis focuses on the outcomes of legislative votes, where the results are aggregated at the party level. This analysis is necessary to evaluate the impact of the legislative agenda on voting unity. The dependent variable here is the Rice index.Footnote 47 In Appendix C, we also use a weighted Rice index to consider abstentions as a vote choice.Footnote 48
Our analysis begins in the next section by looking at the determinants of individual party loyalty, and then moves on to explain aggregate shifts in voting unity for both the Liberal and Conservative parties. In the section that follows, we focus on measuring the relationship between partisan sorting and legislative voting.
ANALYSIS
We start this section by noting that several Members of Parliament have perfect or near perfect voting records, especially towards the latter part of the twentieth century (the same is true for our aggregated measure of party unity). This is shown in Figure 1, but also in Appendix A, where we include a more detailed analysis of the distribution of individual loyalty scores. The values of these indices imply that a standard linear model will be problematic because it assumes that the dependent variable will be free from upper or lower bounds. In our case, the dependent variables – individual loyalty score and party unity – cannot be above 1 or below 0. Failure to take this into consideration could bias the results. Consequently, we estimate fractional logit regressions, which account for variations in the standard unit interval of 0 to 1. We also adjust the standard errors to control for autocorrelation and heteroscedasticity.
Another concern with the distribution of these indices is that a standard statistical model could fail to capture historical changes in the relationship between the variables in the analysis. To address this problem, we have estimated (and compared) different change-point models (one for each parliament) to locate potential structural breaks in the data.Footnote 49 This analysis identified two distinct breaks: one around the 16th Parliament (1926) for the loyalty scores, and one around the 17th Parliament (1926–30) for the unity scores. Both of these changes are relevant, as they occur in the middle of the transition period towards a multi-party system in Canada, when the growth in voting unity appears to have levelled off. Therefore, in order to control for the potential effects of these change points, the analysis presented below considers all of the parliaments in a cumulative model (1867–2011), but also separately by dividing the data into two distinct periods (before and after the change points).Footnote 50
PARTY LOYALTY
The empirical exploration of partisanship begins by focusing on the individual determinants of legislative behaviour. This analysis is conducted to verify whether electoral pressure and cohort or career incentives explain the increase in party loyalty observed over time. Aside from loyalty scores, which represent our dependent variable in the regression models, we control for the legislative Turnout of members.Footnote 51 We also control for electoral competition in a district by using the Effective number of candidates during an election (Laakso and Taagepera’s index).Footnote 52 This index ranges from 1 to 6.29 in the data (with a mean of 2.31 for the whole period), where 1 represents an election in which there was only one candidate who won 100 per cent of the votes (i.e., the candidate won by acclamation). Therefore, a value greater than 1 implies that competition increased in that district.Footnote 53 Furthermore, we include a control for the size of the electorate in each district by adding a variable that reports the Total number of voters during an election.Footnote 54 These last two measures evaluate the effects of electoral pressures on partisan loyalty in the legislature.
The models also contain several parliamentary status variables, such as Cabinet membership, since members of the executive have a collective responsibility to support the government.Footnote 55 Following the same logic, we determined whether an MP was a member of the Governing party, elected during a Minority government, or whether an MP was in the First or Last term of his or her legislative career.Footnote 56 This group of variables was added to measure career incentives as well as the effects of being in the governing party. We include regional dummies (Quebec, Ontario, Maritimes and Western provinces), as Canada is a federation of former independent colonies with strong regional ties.Footnote 57 Finally, we identified the forty different election Cohorts for every sitting MP and added a Parliamentary term component to the models, representing the parliament number.Footnote 58 These two variables are also squared, and were added to control for variations over time and for the replacement of members when parliament and cohort fixed effects were not included in the models.
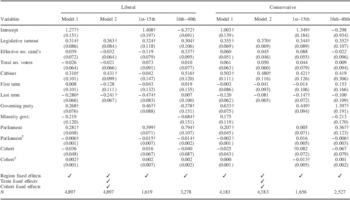
The results of the analysis for Liberal and Conservative MPs are presented separately in Table 1. The table includes four different specifications: Model 1 is a simple fractional logit regression for the whole period; Model 2 adds both term and cohort fixed effects; and Models 3 and 4 divide the data according to the structural break points previously identified (before/after the 16th Parliament). In Appendix B, we conduct a similar analysis on divisions over motions introduced by cabinet members only. The Appendix also includes a more detailed summary of the results presented in Table 1.
Fractional Logit Models of Individual Voting Behaviour

Note: The dependent variable is the individual party loyalty score. Heteroscedastic and autocorrelation consistent standard errors are reported in parentheses. †p<0.05.
One of the most important findings from this table relates to the influence of the government and cabinet variables. Not only are members of the cabinet more likely to be loyal, but government backbenchers are also more likely to toe the party line. Note that this last variable is only included in the first model, as it is redundant in the second specification when we add dummy variables to control for the parliamentary terms (the same logic applies for minority governments).
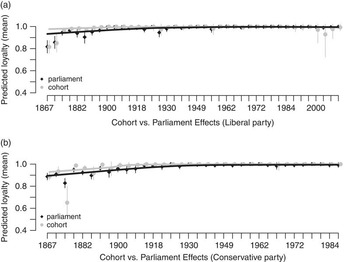
The analysis demonstrates that party loyalty increases over time, but at a decreasing rate for both parties. We also find that cohorts have a limited impact on party loyalty. To illustrate the contrast between the impact of cohorts and parliamentary terms on the development of party unity, Figure 2 reports the mean-centred cohort and term-specific effects of these variables as measured by Model 2 (the predicted level of loyalty). Clearly, the plots show that cohorts have a small influence on legislative behaviour. Rather, it is the parliament number that seems to matter. This effect becomes more substantive as we approach the 1920s (around the 15th Parliament, which corresponds to the break point identified previously), but stabilizes after this.Footnote 59
The influence of cohort and term specific effects on individual party loyalty Notes: The plots display the predicted mean level of party loyalty from Model 2 (Table 1) for both the cohort and parliamentary term dummies when the remaining variables are held at their mean level. The bars indicate the 95 per cent confidence intervals.

The analysis presented in Models 3 and 4 also demonstrates that the influence of certain variables is not constant across the two periods identified by the change point models. Most of these differences are minor, but there are a few exceptions. For example, we find that the Cabinet membership variable is not significant for the Liberal party in the first period (Model 3). However, this variable is significant in the second period (Model 4). Even more puzzling are the differences in signs between the Governing party variable in periods 1 and 2 for the Liberals. This last result can be explained by the presence of minority governments. Indeed, this variable does not differentiate between opposition and government status (i.e., government×minority government). When we include this interactive term in the analysis, the conditional effect of being in the government becomes positive and significant for the Liberal party in the second period.
Another important determinant of individual party loyalty relates to the influence of legislative careers. The results from Table 1 show that MPs who are preparing to exit the House of Commons are less likely to be loyal during their last term in office. Note, however, that this effect is only significant during the earlier legislatures for both the Liberal and Conservative parties (Model 3). The same cannot be said for freshmen representatives: they are not more (or less) likely to be loyal when compared to their more experienced colleagues. We also find that participation in House votes is related to higher loyalty scores. In other words, MPs who are regularly absent from the House of Commons are less likely to support their caucuses as well. This last finding suggests that abstentions represent an alternative to open dissension in the legislature, and this is confirmed during both periods.
Finally, we find little systematic evidence that electoral incentives matter. For Liberal and Conservative legislators, the impact of the effective number of candidates fails to significantly influence loyalty in the House (the results in Appendix B that focus on government divisions show this as well). The only exception here is for the Liberal party after the 16th Parliament (Model 4). Here, we can see that an increase in competitiveness is associated with higher levels of party loyalty (but this result is not robust across specifications). Similarly, and contrary to what Cox concluded for the British case, we do not find that a larger electorate is associated with higher loyalty scores.Footnote 60 Note, however, that the growth in the number of voters mirrors the growth in loyalty over time, but that loyalty scores do not increase when a district has more voters.
Overall then, this first analysis demonstrates that being a member of the governing party (or the cabinet) is associated with higher levels of loyalty. However, we also find that over time there is an important increase in the average level of partisanship in the legislature, especially before the 15th Parliament. Unfortunately, cohort or career specific effects cannot explain this trend. The same is true for electoral incentives: they do not appear to be related to party loyalty. Therefore, our analysis shows that two of the most commonly identified mechanisms for explaining the development of party unity fail to be relevant in the Canadian context. In the next section, we investigate whether the content of the legislative agenda could account for the gradual transformation of parties in the House of Commons.
PARTY UNITY
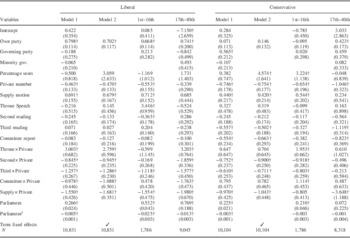
Table 2 reports the results of four different models for explaining the influence of the legislative agenda on the voting unity of the Liberal and Conservative parties. Recall that this analysis is conducted at the party level, and that the aggregate unity scores are computed for each of the 10,893 recorded divisions. As before, Model 1 controls for time variation by including the linear and quadratic effects of parliament number; Model 2 includes fixed term effects; and Models 3 and 4 divide the data according to the change point previously identified (before/after the 17th Parliament). In Appendix C, we reproduced the same analysis by including abstentions in the voting unity measure. This Appendix also contains a more detailed analysis of the results presented in Table 2.
Fractional Logit Models of Party Unity on all Recorded Votes

Notes: The dependent variable is the individual-vote Rice index. Heteroscedastic and autocorrelation consistent standard errors are reported in parentheses. †p<0.05.
Since our goal is to understand variation in party unity across votes, we include several different variables to control for the content of the legislative agenda.Footnote 61 For example, we specify whether a vote is related to a motion introduced by a party member (Own party), whether a motion was sponsored by a non-cabinet member (Private), or whether the vote occurred during a Minority government.Footnote 62 We also control for the size of the party in the House as a proportion of all the seats (Percentage seats). In this analysis, we classified each motion according to six categories: Committee report; Second reading and Third reading of a bill; Supply motion; reply to the Speech from the Throne; and a residual baseline category. Finally, in order to distinguish between the influence of government-sponsored activities, we separate motions that originate from within the cabinet from those introduced by private members (i.e., the interactive terms).
The results suggest that party unity is to a large extent influenced by the origin of the motion under consideration. The most important finding relates to the relationship between party unity and the type of vote recorded. For each party, unity is lower when a motion is introduced by a private member whether from the government or opposition sides. The interactions between this variable and the type of motion under consideration are also mostly negative and significant, and these effects are constant over time (as indicated by the pre/post 17th Parliament split in the models). Government supply motions have higher unity levels when compared to any other motions. In contrast, private member supply motions are associated with lower levels of party unity. There is a similar difference for private member initiatives on the second and third readings of bills. The only exception here is amendments to the Speech from the Throne, which has a positive effect on unity, though this last finding is not robust across the different specifications. Nevertheless, because a successful amendment made to the Speech from the Throne implies a loss of confidence in the government, party unity should be higher for these votes.
Overall then, the results presented in Table 2 show that party voting unity is largely a function of the origin of the motion under consideration. For example, supply motions sponsored by non-cabinet members are associated with a lower value of the Rice index, and this is true for both parties. In Canada, these motions are often related to controversial issues, because they give backbenchers an opportunity to decide the topic of parliamentary debates.Footnote 63 Between 1867 and 1968, there were more than 615 supply motions recorded on divisions, but their frequency declined over time as the government increasingly won the right to control the legislative agenda.Footnote 64
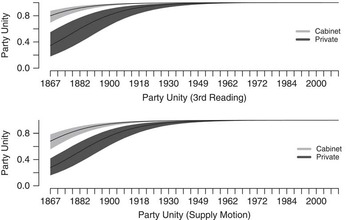
Figure 3 illustrates this trend by reporting the predicted level of party unity for the Liberals during two different types of votes: supply motions and third reading of bills (Appendix C includes the same analysis for the Conservatives). Each plot also compares the level of party unity observed for cabinet and non-cabinet members. We see that the level of party unity is initially lower for private member motions when compared to motions originating from the cabinet. This is demonstrated for both third reading of bills and supply motions, although the level of party unity is highest for the former case. It is important to note, however, that this difference declines over time and converges towards 0 after the 1930s (once again, around the break point identified previously). After this decade, the predicted lines appear to reach perfect unity, regardless of the type of motion under consideration. This pattern is also confirmed for the Conservative party (see Appendix C).
Evolution of party unity by motion type Notes: The black lines show the estimated level of party unity from Model 1 (Table 2) for two different types of vote over time when all of the remaining variables are held at their mean level. This analysis is for the Liberal party only. The grey area surrounding the lines is the 95 per cent confidence interval.

Because initiatives sponsored outside of the cabinet are associated with weaker party unity, it is not surprising to find that majority party leaders have, over the years, modified the rules to reduce the influence of private members in the legislative process. One of the most important reforms to this effect was adopted in 1913, when the Conservative government adopted a closure rule and restricted the number of private member motions that could be debated during the budgetary process. The consequence of these changes was to limit the opportunities for opposition members to air their grievances in the legislature.Footnote 65 Likewise, there was a similar push to centralize backbencher activities into the hands of party leaders. In the first decades after Confederation, private member business had precedence over government activities on certain days of the week.Footnote 66 However, the rules were eventually changed in 1906 to increase permanently the number of days in which the legislative agenda was controlled by the government.Footnote 67
The adoption of these new rules provides indirect evidence that the growth of party voting unity observed in the Canadian Parliament is linked to the reduction in the number of private member motions in the legislative agenda. Indeed, as the bulk of voting in the legislature became increasingly dominated by government business after the First World War, the proportion of private member motions on the agenda abruptly declined from about 35 per cent of all recorded divisions before the 17th Parliament (i.e., the change point identified in the data) to an average of 22 after this term. Note that we can directly relate this change to the modification of the rules of the House, which reduced the time allotted for private member initiatives in the legislative process.Footnote 68
FACTIONS AND THIRD PARTIES
So far, we have established that the government’s ability to control the legislative agenda is an important tool for preventing intra-party divisions. However, we have not yet considered the possibility that the ideological cohesion of party members and partisan sorting could also explain the development of voting unity. Recall that in the context of a parliamentary system, it is very difficult to disentangle the preference of legislators (which can vary across time) and the ability of party leaders to enforce discipline within their ranks (which can also vary across time).Footnote 69 To get around this problem, we have identified two factions of parliamentarians who have historically been at odds with the positions of the Conservative and Liberal Parties: Western farmers and French Canadian nationalists.Footnote 70 Since we cannot directly compare the ideological preferences of these members, we use three proxy variables – language, occupation, and geography – to determine whether their presence in the main parties is associated with lower levels of voting unity.
The first group of MPs is composed of French-speaking nationalists, which constitutes a small proportion of all French Canadian representatives elected in Parliament.Footnote 71 It is relatively easy to identify the preference of these members on several important issues that have created internal divisions in both major parties over time. These conflicts are related to language and religious rights.
In the years immediately following Confederation, French Canadians MPs were more or less equally divided between the Liberal and Conservative parties. Over the following years, however, the Liberals became known as the defenders of the French language and the Catholic religion in parliament.Footnote 72 Still, the positions of the Liberals on several related issues, such as imperial relations, conscription and education, were often perceived by many members of the French Canadian elite to be insufficient compromises for protecting their rights in the federation. As a consequence, Quebec voters often elected nationalist representatives when conflicts over culture and language became salient, such as in the 1911 election. These candidates usually ran under the Conservative party banner until the end of the First World War. However, once in parliament, they regularly failed to support the party platform during important legislative votes.Footnote 73
The second group of dissenting MPs is found within the Liberal party. Like Quebec nationalists, Western farmers were at odds with the position of the two main parties on several important issues. On one hand, the first split was over economic policies; farmers were more likely to favour lower tariffs and free trade, a position championed by the Liberals, but opposed by the Conservative party until the end of the twentieth century. On the other hand, Western farmers were also more likely to be socially conservative on issues such as prohibition and temperance, and oppose the Liberal party on questions of French language rights and confessional education.
In the first decades following Confederation, Western farmers frequently elected their own candidates within the Liberal party structure. Their goal was to influence politics from within the existing two-party system. However, several of these representatives were either co-opted by the Liberal leadership or prevented from expressing their grievances in the House, which became easier to do after the government won the right to control most of the legislative agenda between 1906 and 1911. Eventually, the farmers rebelled against the two main parties in 1919 and constituted their own separate caucus in the legislature.Footnote 74 This group further organized to create the Progressive party, which later went on to win the second highest number of seats in the 1921 election. Once in parliament, Progressive leaders refused to impose party discipline within their ranks because they believed that it prevented a fair representation of the interests of Westerners and farmers in the legislature.Footnote 75
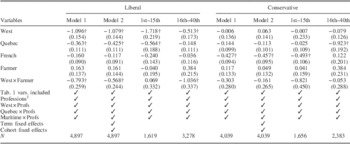
In order to determine whether the presence of these factions within the two main parties could be associated with lower levels of voting unity, Table 3 offers a replication of the individual loyalty analysis presented in Table 1. However, this time we include several new variables to locate Western farmer and French Canadian MPs in the data. French speakers were identified by name and biographical information, while the identity of Western farmers was determined by interacting the profession of the MP prior to entering parliament (Business, Education, Health, Media, Farming, and others) with region of residence (West, Quebec, Maritimes, and Ontario).Footnote 76 The inclusion of these interaction terms adds more than fifteen variables to our baseline model. Therefore, the results presented in Table 3 only report the regression coefficients for the French and Western farmer interactive terms (the complete set of results is available in Appendix D).
Fractional Logit Models of Individual Legislator Voting Behaviour

Notes: The dependent variable is the individual party loyalty score. Heteroscedastic and autocorrelation consistent standard errors are reported in parentheses. The full results are available in Appendix D. ‡The Professions are Farming, Business, Health, Media, Education, and other (baseline). †p<0.05.
This last analysis shows that MPs from the Western provinces and Territories are less likely to be loyal when they are elected under the Liberal party banner, and this is true for all periods. We also find that the interactive variable West×Farmer is associated with a lower level of party loyalty for Liberals. Likewise, we observe the same negative relationship between French Canadian MPs and the Conservative party (but this effect is stronger during the first period identified in Model 3). Both of these findings demonstrate that members of these factions were more likely to oppose their party in parliament. As with the case of private member business, our findings suggest that the overall level of party unity will increase whenever the proportion of Western farmers and French Canadian nationalists declines within the Liberal and Conservative parliamentary caucuses.
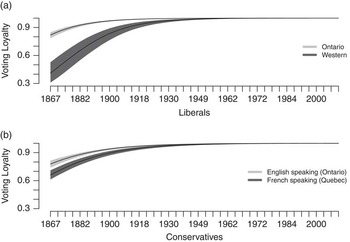
Figure 4 illustrates this trend by comparing the voting loyalty for MPs across the backgrounds that we take as external measures of preferences. For the Liberal party, we compare MPs from central Canada (Ontario) with MPs from the farming-oriented Western provinces. As expected, there is a substantive difference in voting loyalty across these groups. MPs from central Canada remain substantively more loyal for the whole period, although the difference becomes smaller as the two-party system breaks down during the 1920s. We see a similar pattern within the Conservative party when we compare the voting loyalty of English-speaking MPs from Ontario with French-speaking MPs from Quebec. This latter group is less loyal, and remains so until the 1920s.
Estimated voting loyalty for MPs with different backgrounds Notes: The plots display the predicted mean level of party loyalty from Model 2 (Table 3) for both the cohort and parliamentary term dummy variables when the remaining variables are held at their mean level. The bars indicate the 95 per cent confidence intervals. The top plot represents Ontario Liberals versus Western Liberals while the lower plot represents English speaking Conservatives from Ontario versus French speaking Conservatives from Quebec.

The analysis demonstrates that the emergence of third parties occurred during a period when party voting unity became, for the first time, extremely high in the Canadian Parliament. We believe that this transformation was made possible by the removal of two important dissenting factions within the Conservative and Liberal caucuses, who later found a niche inside several different temporary regional parties, such as the Bloc Populaire (1942–47), the Progressives Party (1919–30), the Social Credit Party (1935–79), the United Farmer Party (1926–49), and the Cooperative-Commonwealth Federation (1932–61). In Appendix D, we provide additional evidence to corroborate this view by showing that the proportion of French Canadians and Western farmers was gradually reduced within the Conservative and Liberal parties respectively after 1900.
DISCUSSION
This analysis has evaluated competing theories for explaining the development of legislative party unity over time. We can summarize the principal findings as follows. First, both electoral incentives and the replacement of members have a relatively small influence on party-line voting in the Canadian legislature. Secondly, we found evidence that motions introduced by non-cabinet members are associated with lower levels of unity. We also saw that there was a concerted effort by the executive to reduce the amount of these initiatives in the legislative agenda over time. And, thirdly, we have shown that the presence of two distinct regional factions within the main parties is associated with lower levels of unity, an effect that was significantly reduced after the arrival of third parties. How do these findings compare with what we know about the development of legislative party unity elsewhere?
To begin, the expansion of franchise and the emergence of a more partisan electorate have both been identified as central components to explain the emergence of modern, unified and programmatic political parties in Britain and the United States. In both of these cases, the development of parties in the legislature preceded the introduction of franchise reforms. In contrast, suffrage in Canada was always comparatively higher than it was in Britain during the nineteenth century, while the size of electoral districts remained relatively small until the end of the First World War.Footnote 77
It follows that the traditional sequential model proposed by Duverger and Sartori to explain the development of the first political parties – which begins with the organization of parliamentary groups, followed by franchise reforms, greater electoral competition and, finally, the establishment of permanent party organizations – is not supported by the Canadian case.Footnote 78 Rather, our analysis shows that the increase in the number of voters fails to have a significant effect on the development of party unity. This finding is in line with the experience of several other European countries throughout the nineteenth century, where the introduction of the first major franchise reforms often occurred after the emergence of strong legislative party organizations.Footnote 79
Secondly, this study shows that the gradual replacement of older cohorts of members has a relatively small influence on the development of party unity. This result is also confirmed by Eggers and Spirling in their analysis of legislative voting in Westminster during the Victorian era.Footnote 80 In the same study, Eggers and Spirling suggest that the lure of ministerial promotions could also represent an alternative for explaining partisan support in the legislature. In the Canadian context, we did find that members of the cabinet were on average more loyal. However, this finding could simply be explained by collective ministerial responsibility. Furthermore, because promotions to the frontbench in this country have always conformed to certain norms of representation (i.e., regional, linguistic or confessional), a large number of outsiders without any prior parliamentary experience have regularly been appointed to the cabinet.Footnote 81 For these reasons, we suspect that the lure of ministerial promotions could only have had a marginal impact on the growth of partisanship over time.
The third implication relates to the influence of the legislative agenda. Our analysis has shown that once the government took control of the proceedings in the House, voting became increasingly related to government business. Of course, the importance of the legislative agenda in explaining the emergence of cohesive parties has long been known in the context of the British parliament.Footnote 82 Studies of partisan behaviour in the United States have also reached a similar conclusion, namely that the agenda or the rules and procedures play a fundamental role in accounting for partisan polarization in the American Congress.Footnote 83
This finding is perhaps the most direct evidence that there is a set of common denominators to explain the growth of partisanship in the Canadian, British and American legislatures. Each case demonstrates that special agenda-setting powers were granted to the majority party in order to prevent systematic obstruction in the assembly. For example, closure in the British House of Commons and Reed’s rules in the US House of Representatives were both adopted so as to reduce the influence of members of the Irish Home Rule League in Britain and the populist Silverites in the United States during the second half of the nineteenth century, respectively.Footnote 84 Likewise, the adoption of closure in Canada on the eve of the First World War was also done in part to prevent an organized minority of French Canadian MPs from blocking the granting of emergency funds to protect the British Empire.
The fourth implication concerns the partisan sorting argument and the structure of the party system more broadly. Recall that Canada is composed of several regional, linguistic and ethnic groups whose interests have not always been adequately represented within the traditional Westminster model of two-party competition. As we saw earlier, conflict over certain issues, such as religion or tariffs, have at times divided the two major parties internally and have even led to the creation of third parties in the legislature.
This is by no means exceptional. We observe a similar pattern in Britain following the split of the Conservative party during the Corn Law debates, and in the United States following the division of the Whig party over the issue of slavery.Footnote 85 In both of these cases, the presence of strong regional factions weakened the unity of the dominant parties – until the electorate realigned and the remaining members of these factions banded together to form a new political party (i.e., the Liberals and the Republicans).
What is exceptional in the Canadian case is the fact that once third parties entered the House of Commons, they never fully disappeared, nor did they manage to replace either one of the two dominant parties. Canada’s long-standing ‘two-party-plus’ system has therefore been sustained by the presence of strong regional political parties.Footnote 86 However, these minor parties have also prevented the government from obtaining a majority of the seats in thirteen of the following twenty-eight parliaments elected after the First World War.
The continued presence of third parties has also allowed for a more diverse representation of interests in the Canadian House of Commons. By extension, this has created more homogeneous and unified party caucuses in the legislature.Footnote 87 This last finding highlights one of the limitations of the Westminster model of government, namely, that the combination of high levels of party discipline and regionally/ethically diverse populations appears to increase the incentives for creating third parties. It would be interesting here to explore whether this relationship exists in other former British colonies as well – such as New Zealand, Australia, India and South Africa – to see whether the introduction of stricter parliamentary rules could also lead to the fragmentation of their respective party system.
CONCLUSION
This study represents an important step towards developing a genuine comparative assessment for understanding the emergence of legislative party organization outside of the British and American legislatures. We analysed an original dataset of more than 10,893 recorded votes – comparable in scope and detail to those that have invigorated the historical study of the United States Congress and the British Parliament – to explain the development of party organization in the Canadian House of Commons between 1867 and 2011.Footnote 88
In the first part of the empirical analysis, we studied the voting behaviour of 4,093 Members of Parliament, and found that electoral pressures, the size of the franchise, and the professionalization of the House of Commons had only a limited influence on the transformation of parties over time. This result highlighted an important difference between the experience of Canada and that of Britain, where electoral reforms and the suffrage have always been linked to the development of party organizations. In the second part of the empirical analysis, we argued that this change is more likely to be explained by institutional rules and the content of the legislative agenda. Here, we focused on the level of party cohesion for each individual recorded vote and found that motions introduced by the cabinet were associated with higher levels of unity than motions sponsored by members of the opposition or even government backbenchers.
From these findings, we concluded that the observed consolidation of party unity was linked to the government’s ability to control the legislative agenda, especially after 1900. Since the confidence convention lowers the costs of imposing discipline for government business in a parliamentary system, it is not surprising to find that party voting unity increased after government-related motions took precedence over private member initiatives in the Canadian legislature.Footnote 89 It is important to note, however, that we are not suggesting that the agenda explains everything. Rather, the variations in the data are more closely associated with the reduced influence of backbenchers in the legislative process. The previous finding also supports the notion that agenda control represents a common pathway for the development of legislative party unity in different types of legislatures, as shown by the American and British experiences.Footnote 90
Finally, in the last part of the empirical analysis, we saw that limiting the influence of backbenchers in a parliamentary system could also exacerbate intra-party conflicts, and this could in turn lead members to split from their caucus. We have argued that this is more likely to occur when party leaders control most of the legislative agenda, but also when members have heterogeneous preferences on several important policy issues. In Canada, we have identified two such political cleavages: one was related to language and religious rights and the other was linked to agrarian and frontier ideology. This is by no means an exhaustive list; we can think of various other issues, including immigration, economic development, and foreign policy, that could also divide parties internally, or even lead to a realignment of the political forces in the legislature.
From a comparative perspective, this study demonstrates some of the limits of exporting the Westminster model of government to a geographically diverse population. The combination of strict party discipline and heterogeneous preferences is not conducive to the representation of groups with distinctive sectional interests. In the Canadian context, this has translated into a permanent multi-party system after the 1921 election and a series of hung parliaments since then (a comparable situation can be observed in India, for example). Nevertheless, the Canadian experience has also confirmed the adaptability and resilience of the British constitutional model. Not one government has ever fallen due to intra-party conflict, and the high levels of party cohesion observed in the legislature have promoted legislative accountability and cabinet stability. This would have been much more difficult without the presence of third parties in the legislature.
SUPPLEMENTARY MATERIAL
To view supplementary material for this article, please visit http://dx.doi.org/10.1017/S0007123415000368