Implications
Repetitive, invariant, functionless behaviours, or so-called stereotypies, are used as indicators of poor animal welfare in on-farm assessments and research. It is hence crucial that we understand underlying mechanisms driving stereotypies. This study demonstrated that stereotypy development is driven by a gene by environment interaction: calves in a barren environment and that responded actively to challenge were more likely to show high levels of tongue playing. This study did not support the idea that stereotypies and inactivity are two alternative responses to sub-optimal conditions, nor that stereotyping and non-stereotyping calves differ in terms of cortisol secretion.
Introduction
Stereotypies are seemingly functionless behavioural patterns that are repeated invariantly over and over again (e.g. Wiepkema, Reference Wiepkema1987). Stereotyped behaviour in animals is most common in sub-optimal environments (Mason and Latham, Reference Mason and Latham2004), suggesting a link with negative affective states, poor health or, more generally, poor welfare. For example, in ruminants, oral stereotypies such as tongue playing and oral manipulation of the environment result from a limited opportunity to chew and ruminate roughage, which is presumably associated with frustration, boredom and stress, as well as poor rumen function and poor abomasal health (Bergeron et al., Reference Bergeron, Badnell-Waters, Lambton and Mason2006). Within environments in which stereotypies are displayed, however, stereotyping animals may have better welfare than non-stereotyping animals (Mason and Latham, Reference Mason and Latham2004; Fureix et al., Reference Fureix, Walker, Harper, Reynolds, Saldivia-Woo and Mason2016). Stereotypies may in fact be one of two possible responses to sub-optimal environments, the alternative being hypo-activity (Fureix et al., Reference Fureix, Walker, Harper, Reynolds, Saldivia-Woo and Mason2016). Hypo-activity was previously linked to learned helplessness, which was itself linked to depression in mice (Fureix et al., Reference Fureix, Walker, Harper, Reynolds, Saldivia-Woo and Mason2016). Evidence towards a coping function of stereotypies at the neurobiological or physiological level, via, for example, opioid release, decreased heart rate or decreased hypothalamic–pituitary–adrenal (HPA) activity, is somewhat ambiguous but is receiving increasing attention as more and more findings point in that direction (Würbel et al., Reference Würbel, Bergeron and Cabib2006). Another interesting finding is that stereotypies most likely result from a gene by environment interaction, with individual differences also playing an important role in the predisposition to select hyper- (stereotypies) v. hypo-activity as a strategy to deal with sub-optimal conditions (e.g. Gottlieb et al., Reference Gottlieb, Capitanio and McCowan2013; Ijichi et al., Reference Ijichi, Collins and Elwood2013).
The overall aim of this study was to increase our understanding of oral stereotypies in young ruminants, here calves. This aim was divided into three hypotheses: (1) oral stereotypies in calves are one of two alternative responses to sub-optimal conditions, the alternative being hypo-activity; (2) stereotyping and non-stereotyping calves differ in terms of HPA axis (re)activity; and (3) stereotypy development in calves depends on a gene by environment interaction. If stereotypies are one of two alternative behavioural strategies to deal with sub-optimal conditions, that is, hyper- v. hypo-activity, then one would expect an inverse relationship between stereotypies and inactivity. Furthermore, if stereotypies are caused or maintained by changes in HPA axis activity, then stereotyping and non-stereotyping calves may be expected to show differences in baseline cortisol or in cortisol response to a stressor. It has been suggested that stereotypies may be some way of coping with adversity: a way of down-regulating a continuously mobilised HPA axis (Mason and Latham, Reference Mason and Latham2004; Gabriels et al., Reference Gabriels, Agnew, Pan, Holt, Reynolds and Laudenslager2013), because a sustained stress response, that is, chronic stress, may result in pathology (Ursin and Eriksen, Reference Ursin and Eriksen2004). The link between cortisol and stereotypies, however, is not a straightforward one, with certain studies finding differences between stereotyping and non-stereotyping animals (e.g. Freymond et al., Reference Freymond, Bardou, Briefer, Bruckmaier, Fouche, Fleury, Maigrot, Ramseyer, Zuberbuhler and Bachmann2015), and others not (e.g. McBride and Cuddeford, Reference McBride and Cuddeford2001). This study tested whether stereotyping and non-stereotyping calves differ in cortisol secretion, both at the baseline level and in response to a stressor. No inference is made regarding the direction of the potential difference, including its meaning in terms of chronic stress (Miller et al., Reference Miller, Chen and Zhou2007; Mormède et al., Reference Mormède, Andanson, Auperin, Beerda, Guemene, Malmkvist, Manteca, Manteuffel, Prunet, van Reenen, Richard and Veissier2007).
Finally, this study tested whether the propensity to develop stereotypies is based on a gene by environment interaction, with barren environments and an active response to challenge predisposing calves to stereotypies. The environment was varied using different solid feed (SF) allowances. This manuscript focussed on two oral stereotypies: tongue playing and oral manipulation of inanimate objects. Tongue playing is a clear, accepted stereotypy in ungulates (Bergeron et al., Reference Bergeron, Badnell-Waters, Lambton and Mason2006). Object manipulation could technically be done in a non-stereotypical way: (1) it could represent normal exploration or (2) it could be displayed for abnormally long periods of time but not be repetitive and invariant. However, differencing between stereotypic and non-stereotypic object manipulation would bring a level of unwanted subjectivity to the observations, and thus, all object manipulation was considered stereotypical in this study. Other abnormal behaviours that can be performed in a stereotypic manner include cross-sucking, which is less obvious beyond 8 weeks in calves (Wiepkema, Reference Wiepkema1987), and sham chewing (Morisse et al., Reference Morisse, Cotte, Huonnic and Martrenchar1999), which is extremely difficult to differentiate from normal chewing. Cross-sucking and sham chewing were, hence, not included under the umbrella term ‘oral stereotypy’ in the present study. Individual differences in behaviour may also be linked to the development of stereotypies. Gottlieb et al. (Reference Gottlieb, Capitanio and McCowan2013) demonstrated that rhesus macaques with a more active personality displayed more motor stereotypic behaviours. Furthermore, stress resulting from sub-optimal environments may lead to brain alterations, possibly within the dopaminergic system, which in turn may lead to impulsivity, inflexibility and compulsivity and, subsequently, an increase in stereotypic behaviour (Cabib, Reference Cabib2006). We hypothesise that calves in the most barren environments, that is, with the smallest amounts of SF, and with more active responses to a challenge, would be found to display the highest levels of oral stereotypies.
Material and methods
This study was conducted at the experimental facilities of Wageningen University, the Netherlands. All procedures abided by the Dutch law for animal experiments and the ETS123 (Council of Europe 1985 and the 86/609/EEC Directive) and was approved by the Wageningen University Committee on Animal Care and Use. Holstein-Friesian bull calves (n=48; 7.6±0.1 weeks of age; 54.7±0.3 kg BW) were purchased from a Dutch veal farm. Calves were housed in groups of three in 2.35×2.45 m pens with wooden-slatted floors. The room was mechanically ventilated and lit by daylight and artificial lighting (0600 to 2300 h). Calves were assigned to one of four blocks, based on BW. Within blocks, calves were randomly allocated to one SF allowance (0, 9, 18 or 27 g dry matter (DM)/kg of BW0.75 per day). Each block comprised of four pens, one per SF allowance. The SF was 50% concentrate, 25% maize silage and 25% chopped wheat straw, on DM basis. Allowance of SF was adjusted to the average BW of a pen on a weekly basis.
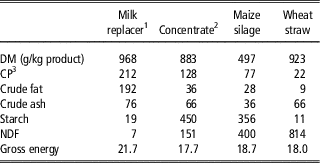
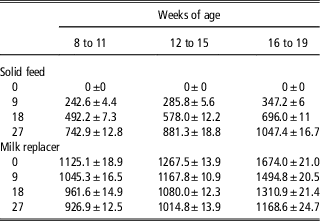
Milk replacer allowance was adjusted for equal growth rates, that is, calves receiving less SF received more milk replacer and vice versa. Milk replacer allowance was also adjusted per block in such a way that each calf reached ~108 kg BW (excluding gut fill) at the time of the challenge. It is currently unclear how satiety is affected by a full rumen v. a full abomasum. These milk replacer adjustments were carried out in an attempt to reduce potential differences in satiety between calves with different SF allowances. These milk replacer adjustments were, moreover, done to enable all calves to receive the challenge at a similar BW. The nutrient composition of the diet components are given in Table 1. Calves were fed their allowance of milk replacer and SF twice daily in open buckets at 0700 and 1600 h, and were locked in the fence during milk replacer drinking to prevent calves ingesting other calves’ allowance. Intakes of SF and milk replacer are given in Table 2. Water was offered ad libitum with nipple drinkers.
Nutrient composition of the different diet components, expressed in g/kg of dry matter (DM), except where specified otherwise

1 35.7% Whey powder, 20.0% whey powder concentrate, 13.3% delactosed whey, 6.0% lard, 6.0% tallow, 4.6% coconut oil, 4.0% wheat protein, 2.5% soya concentrate, 2.5% premix (3.5 g lysine and 2 g methionine, per kg milk replacer), 2.0% starch, 2.0% palm oil, 1.4% soya lecithin.
2 36.1% Barley, 30% corn, 15% lupines (CP<335 g/kg), 12.5% carob, 1% premix (lactose carrier, provided per kilogram of concentrate: vitamin A, 4000 IU; vitamin D, 500 IU; vitamin E, 100 IU; zinc, 25 mg; manganese, 20 mg; iodine, 0.8 mg; selenium, 0.15 mg; copper, 15 mg; cobalt, 0.1 mg), 1.15% MgSO4·7H2O, 0.77% NaCl, 2.15% CaCO3, 1.35% KH2PO4.
3 N×6.25.
Mean (±SEM) solid feed and milk replacer provision in g of dry matter (DM)/day, for each solid feed allowance in g of DM/kg of BW0.75 per day, that is, 0, 9, 18 or 27 (Webb et al., Reference Webb, Bokkers, Engel, Berends, Gerrits and van Reenen2012)

Challenge
When calves were aged 14 to 18 weeks, and weighed ~108 kg BW, they were subjected to a challenge, that is, they were moved from their home pens to metabolic cages, and restrained therein. Two adjacent pens from the same block (these groups of six calves are henceforth referred to as ‘restraint groups’) were individually walked to a room adjacent to the home pen room. Calves were then individually placed inside metabolic cages (height 1.11 m; width 0.79 m; length 1.85 m) and tethered with a neck-collar and chain. The collar and chain permitted all movements, including lying down and sticking of the head out of the front of the cage. The only movement that was not possible was a full turn inside the cage, which was thought to be dangerous for the calves. The cages allowed visual and auditory contact between calves. The calves remained in these metabolic cages for 4 to 6 days. During this restraint period, milk replacer schemes were identical for all calves (37.3 g DM/kg of BW0.75 per day). This was necessary for another aspect of this experiment aimed at assessing nitrogen and energy balances caused by the different feed allowances (Berends et al., Reference Berends, van den Borne, Alferink, van Reenen, Bokkers and Gerrits2012). In order to reach these identical milk replacer allowances and intakes for all calves, the milk replacer schedules were modified in the week before restraint. This resulted in calves with a high milk replacer allowance, that is, low SF allowance, experiencing a decrease in their milk replacer allowance, and calves with a low milk replacer allowance experiencing an increase in their milk replacer allowance in the week before restraint. The SF provision was kept the same as in the home pens. After these initial 4 to 6 days, calves were moved to other metabolic cages, which were situated within calorimetric chambers. They remained in these chambers for an additional 4 to 5 days before returning to their home pens. The total duration of the restraint period was 8 to 10 days.
Behavioural observations
Direct and indirect (video) observations were carried out. These two observation methods were carried out by two different observers, using The Observer XT (Noldus Information Technology, Wageningen, the Netherlands).
Direct observations were carried out in the home pens using instantaneous scan sampling at a 5-min interval for 30 min every 2 h from 0600 to 1900 h (seven sessions per day) once a week. These observations were carried out 4 weeks before and following restraint. During these observations, the frequency of tongue playing, oral manipulation of inanimate objects and inactive behaviour was recorded. Tongue playing was defined as ‘rolling and unrolling of the tongue inside and outside of the mouth’. Object manipulation was defined as ‘any contact of the mouth or tongue with any aspect of the environment, except calves’. Inactive behaviour was defined as ‘absence of active behaviour other than turning of head and blinking, including standing or lying with head supported, or not, by neck, and eyes opened or closed’. Indirect behavioural observations were carried out in the first 30 min after entry into the metabolic cages, using focal animal sampling and continuous recording. These observations were done in an attempt to record immediate behavioural response to a challenge (first 30 min) and to derive underlying traits using principal component analysis (PCA). Behaviours recorded using indirect observations are described in Table 3.
Ethogram for indirect (video) observations of the immediate behavioural response of calves (n=48) to restraint inside metabolic cages at 14 to 18 weeks of age, using focal animal sampling and continuous recording

1 These behaviours were recorded as behavioural events (i.e. counts). All other behaviours were recorded as behavioural states (i.e. durations).
Saliva sampling
Salivary cortisol was measured instead of plasma cortisol, because cortisol response to ACTH is similar in saliva and plasma (although less sensitive and with a smaller peak) in cattle (Negrâo et al., Reference Negrâo, Porcinato, De Passillé and Rushen2004), and because it requires a non-invasive sampling method that only measures ‘free’ cortisol (Mormède et al., Reference Mormède, Andanson, Auperin, Beerda, Guemene, Malmkvist, Manteca, Manteuffel, Prunet, van Reenen, Richard and Veissier2007). Saliva sampling was done before and after the onset of restraint to measure the physiological response to restraint at 14 to 18 weeks of age. A baseline sample was collected at 0900 h on the 1st day of restraint (~120 min before the first calf was moved to the cages), followed by samples at +40, +80, +120 min and +48 h, relative to the time calves were tethered inside the metabolic cages. These sampling time points were chosen on the basis of previous research in calves comparing cortisol response in saliva and blood (Negrâo et al., Reference Negrâo, Porcinato, De Passillé and Rushen2004). Two cotton swabs (150×4 mm; VWR®, Amsterdam, the Netherlands) were inserted into the mouth of a calf, who chewed on them voluntarily. Calves were habituated to this procedure in their home pens in the weeks before the challenge. The cotton swabs were then placed inside a salivette (Sarstedt B.V., Etten-Leur, the Netherlands) and immediately set on ice. Within 4 h, the samples were centrifuged at 4650 r.p.m. (4630 r.c.f.) for 6 min, the cotton swabs removed and the salivettes stored at −20°C until analysis using enzyme immunoassay (Salimetrics Europe Ltd, Newmarket, UK). The final cortisol concentration was based on two independent 25 µL samples for a given saliva sample, tested on the same microplate. The optical density, that is, magnitude of colour (inversely proportionate to the amount of cortisol in the sample) change, was measured using a microplate spectrophotometer for all microplate wells containing control and test saliva. Two measures of optical density were taken, 450 nm (primary) and 650 nm (reference), and the difference was calculated. Then the CV percentage in optical density between both independent samples was calculated. The sample was re-assayed if this coefficient was >10.
Statistical analysis
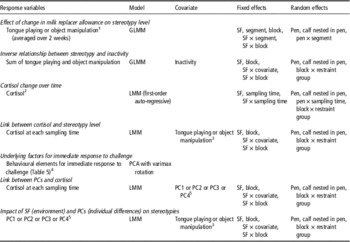
The various models used for this study’s analyses are described in Table 4. Instantaneous scan sampling data were expressed as proportions of total scans. Focal behavioural data were expressed as proportions of total time if they were durations (i.e. behavioural states) or as counts (i.e. behavioural events) (see Table 3). The focal behavioural data were entered into a PCA (see below), and because this analysis requires approximate normality, these data were first transformed as follows: count data were log transformed, whereas proportion data were logit transformed. Cortisol data were log transformed to achieve approximate normality and stable variance. Data are analysed either by a generalised linear mixed model (GLMM) or a linear mixed model (LMM). In the GLMM, effects for proportions were introduced on a logit scale (Table 4). In the LMM effects were introduced on the original scale of the data, possibly after log transformation (Table 4). Effects were either fixed or random with associated components of variance. The random effects account for dependence between data, for example, between observations from calves that are in the same pen. In LMMs inference was by restricted maximum likelihood and in GLMMs by maximum pseudo-likelihood. Approximate F tests for fixed effects due to Kenward and Roger (Reference Kenward and Roger1997) were constructed. For proportions, in addition to the logit link function, the binomial variance function with an extra multiplicative (over) dispersion parameter was introduced. In the LMMs stable variance was assumed. Statistical analyses were carried out using SAS (version 9.3; SAS Institute Inc., Cary, NC, USA).
Models used for statistical analyses

GLMM=generalised linear mixed model; SF=solid feed allowance; LMM=linear mixed model; PCA=principal component analysis; PC=principal component.
1 Sum of 2-week averages called segments.
2 All cortisol data were log transformed.
3 Averaged across the 4 weeks preceding challenge.
4 Proportions (states) were logit transformed and counts (events) were log transformed.
5 PC with eigenvalue>1, extracted from PCA.
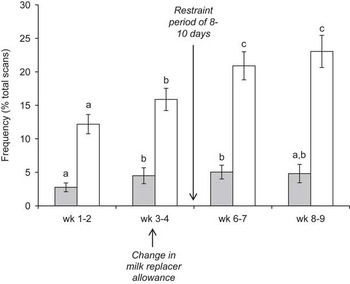
The first step of the analysis was to evaluate the impact of changing the milk replacer allowance in the week before the challenge. Stereotypy data were averaged across 2 consecutive weeks, forming four segments of 2-week periods, with two segments occurring before restraint, and two segments occurring after restraint (Figure 1). Non-significant interactions (P<0.05) were removed from this and subsequent models. For subsequent analyses, stereotypy frequency in the home pens was averaged across the 4 weeks preceding challenge. The second step of the analysis was to check for an inverse relationship between stereotyped behaviour and inactivity. A regression analysis was conducted with a GLMM, where stereotypy level (sum of tongue playing and object manipulation) was entered as the response variable and inactivity was entered as the explanatory variable. The third step of the analysis was to control whether stereotypic and non-stereotypic calves differed in terms of cortisol. First, cortisol data were analysed for differences between sampling times using a LMM, with a first-order auto-regressive structure in time for the residual error term. Second, regression analyses were carried out using a LMM, to determine whether stereotypy frequency might be related to cortisol. The frequency of tongue playing or manipulation of objects was entered into the model as a covariate, with cortisol level at different sampling time points being the response variable, in other words, cortisol level at baseline was first entered as response variable, then cortisol at +40 min and so on. The fourth and final step of the analysis was to investigate whether stereotypy occurrence rests upon a gene by environment interaction. First, to prepare for the actual analysis, the behavioural elements from the immediate response to a challenge were entered into a PCA in order to extract underlying factors. PCA was carried out with varimax rotation. Principal components (PCs) with eigenvalues >1 were considered of importance, according to the Kaiser rule. Second, regression analysis was performed on the cortisol data (at each time point separately) with each of the selected PCs as covariate (in separate analyses), to investigate whether PCs were related to acute stress. Third, further regression analysis was carried out to investigate how individual differences (PCs) and environmental factors (SF allowance) affected stereotypy display (see Table 4 for fixed and random effects, and covariates).
Frequency (mean±SEM) of tongue playing (grey bars) and manipulation of objects (white bars) over time (segments of 2 weeks). Same colour bars with different letters differ (P<0.05). Error bars represent the differences between calves.

Results
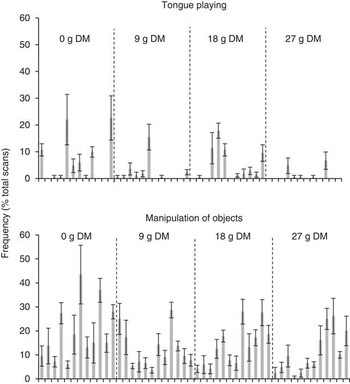
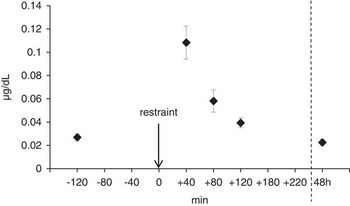
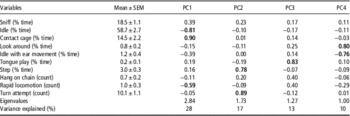
During the change in milk replacer allowance in the week before restraint, both the frequencies of tongue playing and manipulation of objects increased (Figure 1). After the period of restraint, only the frequency of manipulation of objects increased (Figure 1). No interaction between SF allowance and segment was found (tongue: P=0.850; object manipulation: P=0.761). Individual differences in the level of tongue playing and manipulation of objects before restraint varied greatly between calves, even within groups of calves with the same SF allowance (Figure 2). No linear relationship was found between stereotyped behaviour and inactivity (P=0.513), regardless of SF allowance. The salivary cortisol response to challenge was not affected by SF allowance (P=0.287) or restraint groups nested within blocks (P=0.514). Cortisol level varied over sampling time point (P<0.001; Figure 3): all time points differed from each other except the baseline and +48 h on the one hand, and +80 and +120 min on the other. No relationship was found between tongue playing or manipulation of objects in the home pens and cortisol levels at any of the sampling time points (P>0.05). Summary statistics for the behavioural elements recorded to monitor immediate behavioural response to challenge are shown in Table 5. From the PCA of these behavioural elements, four PCs were extracted with eigenvalues >1, which together accounted for 68% of the total variation. Loadings of interest (>0.50) on these four PCs are indicated in bold in Table 5. Regression analysis revealed four relationships between cortisol and the four PCs: PC1 was negatively associated with cortisol levels at +40 min (β=−0.05; P=0.003), +80 min (β=−0.03; P=0.003) and +120 min (β=−0.01; P=0.050); PC4 was negatively associated with cortisol levels at +48 h (β=−0.01; P=0.017). Further regression analysis revealed three relationships between oral stereotypies and the four PCs. PC1 was negatively associated with the frequency of object manipulation, but this was only statistically significant for calves fed no SF (β=−5.90; P=0.039). Similarly, calves with no SF showed a negative relationship between PC2 and tongue playing (β=−8.27; P=0.049). Finally, a positive relationship was found between PC3 and tongue playing (β=9.19; P=0.047), in all calves.
Individual differences in stereotypy frequency in calves with four solid feed allowances (0, 9, 18 and 27 g dry matter (DM)/kg0.75 per day). Stereotypies were observed once a week in the 4 weeks before the restraint period, using instantaneous scan sampling. N.B.: each bar corresponds to the average frequency of the behaviour across 4 weeks for one individual calf, therefore, error bars represent the variation between these 4 weeks.

Salivary cortisol response of calves to challenge. The error bars represent the standard error to the mean or the variation between individual calves. The vertical dashed line indicates a brake in the x-axis between +220 min and +48 h.

Means±SEM for the behavioural elements collected during the first 30 min of restraint in a metabolic cage at 14 to 18 weeks, and loadings on the first four principal components (PCs) from the PC analysis on these elements

Loadings >0.5 were considered of interest and are in bold.
Discussion
The aim of the present study was to increase our understanding of oral stereotypies in calves, in particular, those oral stereotypies linked to insufficient provision of structured fibre, that is, tongue playing and oral manipulation of objects. This study tested three hypotheses: (1) oral stereotypies in calves are one of two alternative responses to sub-optimal conditions, the alternative being hypo-activity; (2) stereotyping and non-stereotyping calves differ in terms of HPA axis (re)activity; and (3) stereotypy development in calves rests on a gene by environment interaction. No clear linear relationship could be found between oral stereotypies and inactivity, in disagreement with our first hypothesis. This finding was independent from SF allowance. This is in contradiction with past research in mice demonstrating that in barren environments inactivity was negatively correlated with stereotypies (Fureix et al., Reference Fureix, Walker, Harper, Reynolds, Saldivia-Woo and Mason2016). Our study may have failed to find this relationship because no distinction was made between different sub-types of inactivity. Research in mink showed that different inactivity sub-types are differently linked to welfare (Meagher et al., Reference Meagher, Campbell, Dallaire, Díez-León, Palme and Mason2013). Another reason why this study may have failed to find an inverse relationship between stereotyped behaviour and inactivity could be that not all stereotypies were included into the analysis, and certain non-stereotypic behaviours may well have been included. Sham chewing was not included here because it is extremely difficult to differentiate from true chewing. However, the calves with a zero feed allowance displayed ~11% chewing throughout the day, which was most likely sham chewing (Webb et al., Reference Webb, Bokkers, Engel, Berends, Gerrits and van Reenen2012). In addition, certain calves were observed using the water nipple for long periods of time and in a repetitive manner, but these behaviours were recorded as water drinking. Furthermore, a small amount of the oral manipulation of objects that was included in this study as stereotypic behaviour was probably normal exploration.
The second hypothesis tested in this study was also not verified, as no linear relationship could be found between the performance of stereotypies and baseline cortisol or cortisol response to a stressor. This suggests that stereotyping and non-stereotyping calves did not differ in terms of HPA axis (re)activity, at least in terms of cortisol secretion. The average cortisol baseline and cortisol peak response to the stressor (i.e. restraint) were lower in the present study than levels reported previously in cattle plasma (Mormède et al., Reference Mormède, Andanson, Auperin, Beerda, Guemene, Malmkvist, Manteca, Manteuffel, Prunet, van Reenen, Richard and Veissier2007). Cortisol levels are lower in calves compared with adult cattle (Redbo, Reference Redbo1998), and lower in saliva compared with plasma (Negrâo et al., Reference Negrâo, Porcinato, De Passillé and Rushen2004). The HPA axis of the calves in the present study seemed to rapidly adapt (within 48 h) to the stressor. This decline in cortisol levels despite the continuation of the stressor is consistent with previous research in pigs (Jensen et al., Reference Jensen, Pedersen, Nielsen, Heller, Ladewig and Jorgensen1996) and calves (Friend et al., Reference Friend, Dellmeier and Gbur1985).
The third hypothesis was supported. Calves with a zero SF allowance showed a relationship between stereotyped behaviour and their immediate behavioural response to a challenge, that is, PC1 and PC2. PC1 loaded high on oral contact with the cage and low on idle and rapid locomotion. PC1 is not thought to reflect how active calves were in their immediate response to challenge because both high and low scores on this PC were associated with active behaviours, that is, oral contact and rapid locomotion. Low scores on PC1 were linked with higher cortisol at +40, +80 and +120 min. This may indicate that PC1 represents underlying stress, and that in this context idle and rapid locomotion reflected high stress, whereas oral contact with the cage reflected low stress. Idle behaviour could be synonymous with freezing behaviour, and rapid locomotion could be synonymous with escape behaviour (e.g. Reimert et al., Reference Reimert, Bolhuis, Kemp and Rodenburg2013). Alternatively, idle may have reflected resting in-between bouts of escape attempts (Cronin, Reference Cronin1985). PC1 was also inversely associated with object manipulation, thus calves with low scores on PC1, and potentially, thus, calves that experienced high levels of stress in response to the challenge, displayed high levels of object manipulation in the home pens. PC2 loaded high on stepping and turn attempts, and was the only PC in this study that could potentially come close to reflecting (locomotor) activity in response to challenge. Previous research into animal personalities found independent traits for fear and activity (Andersen et al., Reference Andersen, Boe, Foerevik, Janczak and Bakken2000; van Reenen et al., Reference van Reenen, Engel and Ruis-Heutinck2004), similarly to what was found here. An inverse relationship was found between PC2 and tongue playing in the home pens, that is, calves with a zero SF allowance that displayed high levels of tongue playing in the home pen, showed low levels of stepping and turning attempts during the challenge, hence lower levels of locomotor activity. Interestingly, theoretical papers assessing the relationship between stereotypies and propensity to respond to challenge in an active manner, sometimes referred to as proactive coping, consistently suggest that proactive animals are more likely to develop stereotypic behaviour compared with reactive animals, or animals who respond to challenge more inactively (Mason, Reference Mason1991; Ijichi et al., Reference Ijichi, Collins and Elwood2013). In experimental studies with horses, pigs and calves, however, reactive animals displayed more stereotypies (Schouten and Wiepkema, Reference Schouten and Wiepkema1991; Redbo, Reference Redbo1998; Nagy et al., Reference Nagy, Bodo, Bardos, Banszky and Kabai2010). Another interesting observation, is that object manipulation and tongue playing were linked to two separate PCs in the present study. These two stereotypies may in fact be driven by separate motivations/traits in calves, as we recently suggested in Webb et al. (Reference Webb, van Reenen, Berends, Engel, de Boer, Gerrits and Bokkers2015). PC3, which loaded high on tongue playing (during the challenge) was positively related to tongue playing in the home pens, in all calves. Given the time frame (30 min), it is unlikely that tongue playing developed spontaneously in response to challenge (Wiepkema, Reference Wiepkema1987). Mason and Latham (Reference Mason and Latham2004) suggested four underlying mechanisms for the onset of stereotypies once they are already established in an animal: (1) self-enrichment, (2) calming effect through repetition, (3) habit or (4) change in behavioural control. Calves that displayed high levels of tongue playing in their home pens may have used it as a means of soothing/calming themselves during the challenge or simply out of habit (Mason and Latham, Reference Mason and Latham2004). PC4 loaded high on looking around and low on idle with ear movements. The negative relationship between PC4 and cortisol levels 48 h after the onset of restraint indicates that the HPA axis of the calves that looked around more and showed less idle behaviour with ear movements adapted to the challenge faster.
Results regarding the effect of diet on behaviour and welfare are presented in Webb et al. (Reference Webb, Bokkers, Engel, Berends, Gerrits and van Reenen2012), and showed that increases in SF allowance decreased stereotypy incidence, albeit in a non-linear manner and despite large individual variation. In the present study, no clear effect of SF allowance was observed on cortisol response to restraint. Groups of calves with different SF allowances also received different amounts of milk replacer, because milk replacer allowance was based on achieving equal growth rates. Calves fed little or no SF, and hence large milk replacer quantities, experienced a decrease in their milk replacer allowance in the week before challenge. This could have resulted in frustration or hunger. However, when changes in oral stereotypies were analysed over time and an increase in these behaviours was observed in the 2 weeks before restraint (Figure 1), no differences between the different SF allowances was observed. This increase could, therefore, have represented a general (stress) response to a dietary change or an increase in age or cognitive development.
Acknowledgements
The authors thank the Division for Earth and Life Sciences (ALW) of the Dutch Organisation for Scientific Research (NWO), and the Product Board Animal Feed for funding, as well as Bert Beukers, Joswita van der Velde, Carène Bulte, Joost van den Borne, Fleur Bartels and Monique Ooms.