I. INTRODUCTION
In nanostructured thin film materials, boundaries play a significant role in determining the electrical, optical, thermal and magnetic properties.Reference Buban, Matsunaga, Chen, Shibata, Ching, Yamamoto and Ikuhara1–Reference Hwang, Cheong, Ong and Batlogg3 Especially, the extrinsic low-field magnetoresistance (LFMR) effect, induced by either spin-polarized tunneling or spin-dependent scattering at the grain boundaries (GBs) of manganite bulks and thin films, has stimulated considerable interest in the past decades.Reference Hwang, Cheong, Ong and Batlogg3–Reference Staruch, Hires, Chen, Bi, Wang and Jain6 The GBs, decoupling the neighboring ferromagnetic (FM) grains and serving as energy barriers for the tunneling, are the key for the enhanced LFMR effect.Reference Gupta, Gong, Xiao, Duncombe, Lecoeur, Trouilloud, Wang, Dravid and Sun7–Reference Yang, Cao, Shen, Xian, Feng, Jiang, Feng, Wei and Dai11 Doping of a secondary phase at the boundaries is an effective strategy to further increase the LFMR properties because doping not only creates additional artificial GBs but also further increases the height of tunneling barriers due to the magnetic decoupling of FM phases.Reference Yan, Kong, Yang, Goh, Tan, Ong, Rahman, Osipowicz and Ren12–Reference Kang, Kim and Yoo18 The enhancement of the spin-dependent tunneling and scattering at the boundaries is considered responsible for the increased LFMR effect.Reference Lu, Sun, Zhu, Song and Du19–Reference Chen, Bi, Hazariwala, Zhang, Su, Chen, Jia, MacManus-Driscoll and Wang22
There is no doubt that boundaries play critical roles in the LFMR. There are various boundaries including GB, phase boundary (PB) and domain boundary in thin films. Designing boundary effects and understanding the mechanisms of boundary effect are particularly important for enabling device applications. Tuning grain size has been proposed and it was found that the intergrain magnetoresistance (MR) is inversely proportional to grain size.Reference Rivas, Hueso, Fondado, Rivadulla and Lopez-Quintela8 Nevertheless, a very limited MR enhancement (less than 4%) was reported by reducing grain size dramatically from 500 to 60 nm. Recently, Bhame et al.Reference Bhame, Fagnard, Pekala, Vanderbemden and Vertruyen23 reported that equivalent LFMR occurs in the La0.7Ca0.3MnO3 (LCMO)/Mn3O4 composites and pure LCMO phase and thus claimed that enhanced GBs do not always enhance the LFMR. Wang et al.Reference Wang, Dou, Liu, Ionescu and Zeimetz24 pointed out that GB is necessary but not sufficient to account for the LFMR effect. They argued that weak-link GBs rather than strong-link GBs are responsible for the MR at low-field over a large temperature range. Thus, the GBs, PBs and disorders at the boundary regions play significant roles in the magnetotransport behaviors.Reference Chen, Bi, Tsai, Chen, Su, Zhang and Wang9,Reference Chen, Zhang, Khatkatay, Su, Tsai, Chen, Jia, MacManus Driscoll and Wang25 However, it is not yet clear which of these boundaries are more effective in LFMR. It is possible that the arrangement of the boundaries rather than the type of boundaries plays a more important role in LFMR. In this work, first, we have studied the LFMR in pure LSMO films and (LSMO)0.5:(ZnO)0.5 (L0.5Z0.5) nanocomposite films on different substrates to examine the effects of GBs and PBs. Second, we have investigated LFMR properties versus PBs in a polycrystalline films with both GBs and PBs by varying the secondary phase composition.
II. SAMPLE DESIGN AND PREPARATION
The (LSMO)1-x:(ZnO)x (L1−xZx) (x is molar ratio) composite targets were obtained by conventional ceramic sintering process. Pulsed laser deposition (PLD) was used to grow nanocomposite films on different substrates (KrF excimer laser, λ = 248 nm).Reference Chen, Bi, Hazariwala, Zhang, Su, Chen, Jia, MacManus-Driscoll and Wang22,Reference Bi, Weal, Luo, Chen, MacManus-Driscoll, Jia and Wang26–Reference Chen, Bi, Jia, MacManus-Driscoll and Wang28 The substrate temperature of 750 °C and oxygen pressure of 200 mTorr were used for the depositions. The as-deposited films were cooled down to room temperature with a slow ramping rate. An oxygen pressure of 200 Torr was used in the cooling process to assure proper film stoichiometry. The structures of the films were examined by x-ray diffraction (XRD; θ–2θ scan). The microstructures were studied by transmission electron microscopy (TEM; model No. JEOL JEM-2010, JEOL, Japan) and FEI Tecnai G2 F20 (FEI Company, Eindhoven, Netherlands). The magnetotransport properties of the films were systematically investigated by a physical property measurement system (PPMS; Model 6000, Quantum Design, Inc. San Diego, CA). Magnetic properties were recorded by the vibrating sample magnetometer option in the PPMS. During electrical measurements, the magnetic field was applied perpendicular to the film plane and the current was applied in the film plane.
III. RESULTS AND DISCUSSIONS
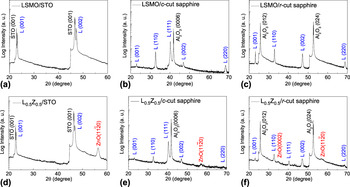
MR properties have been first investigated in single-phase LSMO films and they are compared with (LSMO)0.5:(ZnO)0.5 (L0.5Z0.5) nanocomposite films grown on strontium titanate [STO (001)], as also on c-cut sapphire and r-cut sapphire substrates. Figures 1(a)–1(c) show the XRD results of the pure LSMO films grown on different substrates, respectively. As shown in Fig. 1(a), pure LSMO films grow epitaxially on STO substrates owing to the lattice matching between them. Figure 1(b) shows the LSMO (111) plane prefers to sit on aluminum oxide (Al2O3) (0001) plane and the (111)-axis orientation ratio (P 111) is ∼83.4%, calculated from  $P_{kkk} = \sum\nolimits_k {I(kkk)} /\sum\nolimits_{hlk} {I(hlk)}$.Reference Yang, Long, Yang, Chen, Zheng and Lu29 The single-phase LSMO films on r-cut sapphire exhibit a double orientation growth with the (110)-axis showing orientation ratio of ∼51% and the (100)-axis likewise showing orientation ratio of ∼49%. The orientation ratio is summarized in Table I. Figures 1(d)–1(f) show the XRD patterns of L0.5Z0.5 nanocomposite films on different substrates. It can be seen that in Fig. 1(d), except for the substrate peaks, only the LSMO (00l) set peaks and zinc oxide (ZnO) (
 $11\overline 2 0$) peak appear in the nanocomposite films on STO. It suggests that the LSMO and ZnO phases can be grown in a highly textured manner. Nevertheless, the LSMO phases on c-cut and r-cut sapphire are polycrystalline. The LSMO phase on c-cut sapphire shows the (111)-axis orientation ratio to be ∼78.6% [Fig. 1(e)]. And the LSMO phase on r-cut sapphire shows the (110)-axis orientation ratio to be ∼47.6% [Fig. 1(f) and Table I]. The grain misorientation factor (β) is defined by the sum of all minor orientations ratio. These results demonstrate that doping of ZnO secondary phase in nanocrystalline LSMO films could slightly raise β of the LSMO phase.
The XRD θ–2θ scans of single-phase LSMO films grown on (a) STO (001), (b) c-cut sapphire and (c) r-cut sapphire substrates. The XRD patterns of L0.5Z0.5 nanocomposite films grown on (d) STO (001), (e) c-cut and (f) r-cut sapphire substrates. “L” indicates the LSMO phase.

Comparison of crystallinity and magnetoresistance in single-phase LSMO and L0.5Z0.5 nanocomposite films grown on STO (001), c-cut and r-cut sapphire substrates, respectively.

The grain size of the single-phase LSMO films has been studied by TEM. Bright-field plan-view TEM images of LSMO films on c-cut and r-cut sapphires are shown in Figs. 2(a) and 2(b), respectively. The nanocrystalline grains can be clearly seen in both plan-view images. Figures 2(c) and 2(d) show the grain size distribution for the c-cut and r-cut cases, respectively. It is found that the mean grain size of LSMO films on both substrates is ∼19 nm, which is quite close to the calculated values from XRD results (not shown here). Even though the misorientated grains in Figs. 2(a) and 2(b) can be resolved by the grain contrast, we conducted TEM in dark-field mode to identify the distribution of grains with different orientations. It is interesting to note that, in Fig. 2(e), the dark grains (minor orientations, marked in circle) are located in the matrix of the bright (111)-oriented grains (preferred orientation). Figure 2(f) shows the grain distribution of LSMO films on the r-cut sapphire. It can be seen that the bright grains and dark grains are almost uniformly distributed with a ∼1:1 volume ratio. This is consistent with the XRD results of the LSMO films on r-cut sapphires, i.e., 51% (110) and 49% (100) oriented grains.
Bright-field TEM images of single-phase LSMO films on (a) c-cut sapphire and (b) r-cut sapphire substrates. The circles represent the grains with minor orientations. (c), (d) The grain size distribution in LSMO films grown on c-cut and r-cut sapphire substrates, respectively. Dark-field TEM images of single-phase LSMO films on (e) c-cut sapphire and (f) r-cut sapphire substrates. The dark grains (in circles) in (e) are located in the matrix of white grains with (111) preferred orientation. The bright and dark grains in (f) are the (100) and (110) oriented, respectively.

Figures 3(a) and 3(b) show cross-section TEM images of L0.5Z0.5 nanocomposite films on STO and Al2O3, respectively. It can be seen that the L0.5Z0.5 nanocomposite films consist of vertically aligned nanocolumns with a small grain size of ∼10 nm. The insets represent the selected area electron diffraction (SAED) patterns of these two samples. It shows that the LSMO and ZnO phases on STO are highly textured and LSMO phase on c-cut sapphire is polycrystalline, which is consistent with XRD results. Plan-view TEM of L0.5Z0.5 nanocomposite films on r-cut sapphires shows the well-organized nanorectangles with an average length of 8 nm and an average width of 30 nm [Fig. 3(c)]. Detailed analysis shows the formation of rectangles is due to the ZnO phase grown along [ $11\overline 2 0$] direction out-of-plane, which favors the c-axis of ZnO growth in-plane. Overall, by ZnO doping, the microstructure has been modified into vertical nanocolumns and the column diameters are smaller than the average column size in single-phase films.
Cross-section TEM images of 10 Hz deposited L0.5Z0.5 nanocomposite films on (a) STO (001) and (b) c-cut sapphire, and a plan-view image of L0.5Z0.5 on (c) r-cut sapphire substrates. Insets of (a) and (b) represent the SAED from STO [100] zone and Al2O3 [ $2\overline 1 \overline 1 0$] zone, respectively.

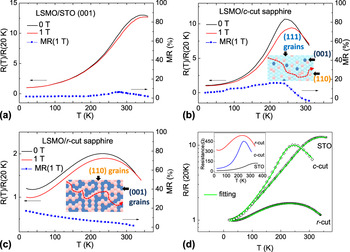
Figures 4(a)–4(c) show the temperature dependence of normalized resistance of single-phase LSMO films grown on STO (001), c-cut sapphire and r-cut sapphire substrates, respectively. The metal-insulator transition (MIT) can be observed in these films and the corresponding MIT temperature (T MI) is 340, 253, and 240 K on these three substrates, respectively. The MR-T curves, as also shown in Figs. 4(a)–4(c), were calculated by MR= (ρ0−ρH)/ρ0, where ρ0 and ρH are the resistivity in a zero field and in a finite field, respectively. As shown in Fig. 4(a), the LSMO films on STO show very limited LFMR at low temperatures due to the negligible large angle GBs and the strong intergrains magnetic couplings. An intrinsic colossal magnetoresistance (CMR) can be observed close to the T MI. The LSMO single-phase films grown on r-cut sapphire show that LFMR monotonously decreases with temperature, as expected in polycrystalline films. Interestingly, the MR of LSMO films on c-cut sapphire shows a GB-induced MR (6.2% at 40 K) and an intrinsic CMR close to the T MI (15.5% at 240 K), which combines characteristics of both epitaxial and polycrystalline films. It is interesting to find that single-phase LSMO films on c-cut and r-cut sapphire substrates, with the β of 16.6% and 49%, exhibit the LFMR of 6.2% and 16.7% at 40 K, respectively. Bear in mind that LSMO films on c-cut and r-cut sapphire substrates show similar grain size of ∼19 nm (Fig. 2), the significant increase of MR is not likely to have stemmed from the grain size effect. Thus, the grain misorientation could be the dominating factor on the MR effect in the single-phase LSMO films. The relation between the LFMR and β is shown in Fig. 5. The larger the existence of grain misorientations in the LSMO films, the larger the observations of LFMR would be.
Temperature dependence of normalized resistance and MR (1 T) for single-phase LSMO films deposited on (a) STO (001), (b) c-cut sapphire and (c) r-cut sapphire substrates. Inset of (b) and (c) are the illustrations of the plan-view microstructures. (d) Fitting of the transport data by Eq. (1). Inset of (d) represents the resistance of the single-phase LSMO films with the same thickness.

The relationship between the MR (40 K) and β of the single-phase LSMO films and L0.5Z0.5 nanocomposite films on STO (001), c-cut and r-cut sapphire substrates, respectively.

To better explain how the misorientation factor β affects the LFMR, the transport properties have been analyzed by a parallel connection channel model. Transport results can be fitted by the following equation,Reference Chen, Bi, Tsai, Lee, Su, Zhang, Jia, MacManus-Driscoll and Wang27
 $${1 \over {\rm{\rho }}} = {G \over {{\rm{\rho }}_i }} + {1 \over {f \times {\rm{\rho }}_{{\rm{FM}}} + (1 - f) \times {\rm{\rho }}_{{\rm{PM}}} }}\quad,$$
with  $f = {\textstyle{1 \over {1 + \exp [U(T/T_{\rm{C}} - 1)/k_{\rm{B}} T]}}}$. G is the geometrical factor that rates the relative contributions from the cross-section of insulating channels and the cross-section of conducting channels (spin-polarized tunneling channels). f is the volume fraction of the FM domain in LSMO grains. ρPM and ρFM correspond to the resistivity of paramagnetic (PM) and FM domains in LSMO grains, respectively. ρi denotes the resistivity for insulator phase channels and it is given by exp(∆E a/k BT). ∆E a is the effective activation energy for the insulator phase and disordered phase boundary regions, k B is Boltzmann’s constant and T is the absolute temperature. In single-phase films, insulator phase channels refer to the GB regions. In the nanocomposites, insulator phase channels represent the secondary phase, GBs, PBs and disorders. PM domains show an insulating behavior when T > T C and ρPM = exp(∆E PM/k BT). ∆E PM is the effective activation energy for the PM domains. FM domains show metallic behavior at low temperature regimes and ρFM is given by ρA + ρBT 2.5. The parameter ρA corresponds to the residual resistivity arising from defect scatterings such as GBs and domain boundaries. The ρB represents a combination of electron-electron, electron-phonon, and electron-magnon scattering. Fitting results in Fig. 4(d) show that the G value is close to ∼0 in epitaxial LSMO film, ∼3 in LSMO/c-cut sapphire films and ∼8 in LSMO/r-cut sapphire films. A larger G value is a sign of reducing the cross-section of conducting channels. The cross-section of conducting path reduction in r-cut sapphire samples is consistent with larger resistance [Inset of Fig. 4(d)]. One interpretation for the enhanced LFMR in films on r-cut sapphire is that the increased grain misorientation reduces the cross-section of conducting path, which favors the tunneling process and thus produces larger LFMR effect.
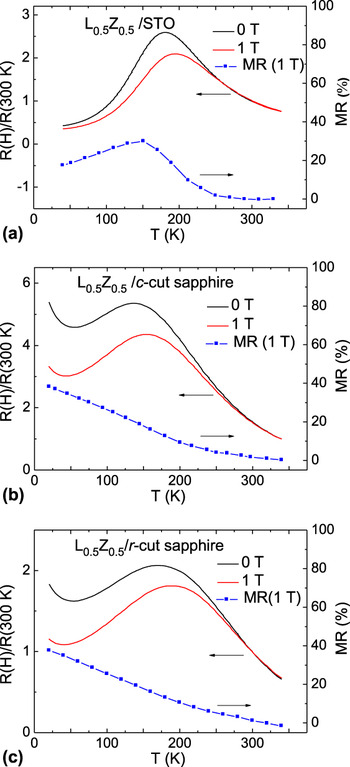
Figures 6(a)–6(c) shows MR-T in L0.5Z0.5 nanocomposite films grown on the different substrates. It is obvious that the L0.5Z0.5 nanocomposite films exhibit a larger LFMR effect at low temperatures, as compared with the single-phase LSMO films on the same substrates. For instance, L0.5Z0.5 nanocomposite films on STO substrates present a MR of 17.5% at 40 K [Fig. 6(a)], while the single-phase counterpart only shows a MR of 1.1%. The absence of large angle GBs in nanocomposite films grown on STO suggests the secondary ZnO-phase-induced PB is a dominant factor for the enhanced LFMR. The TEM image in Fig. 3 shows the ferromagnetic LSMO phases are separated by the ZnO phases. The secondary phase could decouple the neighboring LSMO domains and also serve as an insulating tunneling barrier. L0.5Z0.5 nanocomposite films on c-cut sapphire and r-cut sapphire exhibit a large MR of 35.4% and 35.1% at 40 K, respectively, which is also far larger than that of the counterparts on the sapphire substrates. These MR values at 40 K are summarized in Table I and Fig. 5. Two dominating factors for the dramatic MR enhancement in nanocomposites have been determined to be the PB effect and GB effect. The doping of ZnO phase will dramatically reduce the cross-section of conduction path. In addition, TEM analysis shows ZnO doping reduces grain size from ∼19 to 10 nm. It suggests that doping of ZnO phase increases the GB density and thus decreases the cross-section of conducting channels.
Temperature dependence of normalized resistance and MR (1 T) for L0.5Z0.5 nanocomposite films deposited on (a) STO (001), (b) c-cut sapphire and (c) r-cut sapphire substrates, respectively.

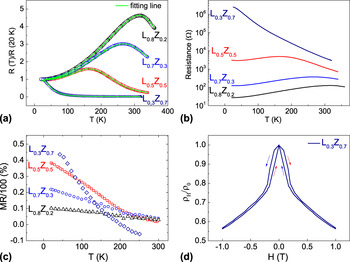
Variation of phase ratio is a very effective way to probe the underlying mechanisms for the LFMR in the nanocomposite films. L1−xZx (0 ≤ x ≤ 0.8) nanocomposite films are deposited on c-cut sapphire substrates. Figure 7(a) shows the temperature dependence of normalized zero-field resistance in 10 Hz deposited L1−xZx films. It can be seen the T MI gradually decreases with the increase of secondary ZnO phase. A previous report shows that the increased GB effects could be responsible for the larger resistivity and lower T MI values in the nanocomposite films with higher secondary phase contents.Reference Yang, Cao, Shen, Xian, Feng, Jiang, Feng, Wei and Dai11 Fitting of the transport results by Eq. (1) shows that the G value gradually increases from 0.27 at x = 0.2 to 131.1 at x = 0.7. It suggests that the increase of secondary phase concentration gradually reduces the cross-section of conducting path and increases the cross-section of insulating channels, which is evidenced by the increased resistance in the whole temperature range [Fig. 7(b)]. Figure 7(c) shows the temperature dependence of MR in the nanocomposite films with different ZnO compositions. First, it can be seen that the MR value monotonously decreases with the increase of temperature in all compositions. Second, the nanocomposite films with more secondary phase always exhibit a larger MR value at low temperatures (T < 200 K). The large MR value in L0.3Z0.7 nanocomposite films is also evidenced by the butterfly-shaped resistivity ratio curve in Fig. 7(d).
(a) Temperature dependence normalized resistance in L1−xZx nanocomposite films on c-cut sapphire substrates (10 Hz). The solid curves are the fitting results from Eq. (1). (b) Temperature dependence of resistance of the (LSMO)1−x:(ZnO)x nanocomposite films with the same thickness. (c) Temperature dependence of MR (1 T) in L1−xZx nanocomposite films. (d) Resistivity ratio of ρH/ρ0 and magnetic hysteresis loop of 10 Hz L0.3Z0.7 nanocomposite films as a function of magnetic field at 40 K.

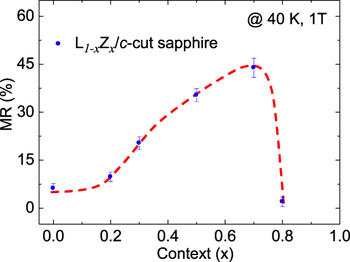
The overall composition effect on MR properties in the nanocomposite films grown on c-cut sapphire substrates is shown in Fig. 8. It can be seen that the MR gradually increases with the increase of ZnO composition and then dramatically drops as the ZnO content crosses the percolation threshold (x = 0.7). When the amount of ZnO is less than the critical value, most of LSMO domains are still connected. The magnetic coupling among the FM domains could hinder the LFMR effect. When the volume ratio of ZnO in the nanocomposite is slightly larger than 50%, the FM domains tend to be located in the ZnO matrix. At this critical point, the neighboring FM domains are completely magnetically decoupled, which favors a large MR effect. It is interesting to note that 50% ZnO volume ratio in the composite is equal to 70% molar ratio of ZnO if one takes into account the density (ρ) and the molar mass (M) of LSMO (ρ = 6.5 g/cm3) and ZnO (ρ = 5.6 g/cm3). When x is larger than the percolation threshold, two important factors may be responsible for the sharp drop of MR: i.e., (i) the increase of ZnO composition will result in the increase of ZnO PB between neighboring FM domains, which may hinder electron tunneling across the PB; and, (ii) the dramatically increased insulating and nonmagnetic phase composition could significantly increase the resistivity of the nanocomposite system and reduce the percentage of the resistivity change under magnetic field. Thus, further increasing the secondary phase crosses the percolation threshold, and could reduce the MR.
(a) Secondary phase content x dependence of MR (40 K) in L1−xZx nanocomposite films deposited on c-cut sapphire.

IV. CONCLUSION
In summary, pure LSMO and (LSMO)1−x:(ZnO)x nanocomposite thin films have been grown on different substrates by PLD. Polycrystalline single-phase LSMO film on r-cut sapphire shows a larger MR as compared with the one on c-cut substrate. In addition, the LFMR was found to gradually increase as the β increases. The nanocomposite films could exhibit larger MR as compared with single-phase films, which is mainly due to the reduced grain size, increased FM grain decoupling and increased grain misorientation. Composition study indicates the maximum MR appears at x = 0.7, which is close to the conduction percolation threshold of nanocomposite system. The fitting results show that both GB and PB can enhance the LFMR by reducing the cross-section of the conduction path. The maximum MR appears close to the percolation threshold because of the formation of quasi-one-dimensional transport channel. Our results demonstrate that enhanced LFMR effect can be realized by reducing the cross-section of the electron conduction paths through nanocomposite approach.
ACKNOWLEDGMENTS
The work was supported by the U.S. National Science Foundation (Ceramic Program, NSF-1007969 and NSF-0846504). The work at Los Alamos was performed, in part, at the Center for Integrated Nanotechnologies, an Office of Science User Facility operated for the U.S. Department of Energy (DOE) Office of Science. J.L.M-D thanks the Advanced Investigator Grant, Novox, ERC-2009-adG 247276.