INTRODUCTION
The rate of new emerging infectious diseases entering the human population has increased over the past century (Jones et al. Reference Jones, Patel, Levy, Storeygard, Balk, Gittleman and Daszak2008). About 75% of the new diseases that have affected humans over the past ten years are caused by pathogens originating from animals or from products of animal origin (UN FAO, 2009) including HIV (Hahn et al. Reference Hahn, Shaw, De Cock and Sharp2000) and SARS (Holmes and Rambaut, Reference Holmes and Rambaut2004; Li et al. Reference Li, Shi, Yu, Ren, Smith, Epstein, Wang, Crameri, Hu, Zhang, Zhang, McEachern, Field, Daszak, Eaton, Zhang and Wang2005). Primary risk factors for the emergence and spread of emerging zoonoses include expansion and intensification of animal agriculture and long-distance live animal transport, live animal markets, bushmeat consumption and habitat destruction (UN FAO, WHO and OIE, 2004). In addition, these direct and indirect impacts have intensified outbreaks of many infectious diseases currently restricted to animal populations, which may have devastating economic and social impacts on people dependent upon them for survival in both developed and developing countries (Perry and Rich, Reference Perry and Rich2007). These risk factors are inter-related and result, in part, from increasing demand for meat worldwide as incomes have risen over the past decades. In addition, the rise of the ‘factory farm’ model of meat production has provided unprecedented mechanisms for rapid and explosive spread of infectious diseases (UN FAO, 2009). Given the current trajectory of human and animal population growth, incomes, technology and connectivity, the issues of epizootics and epidemics are likely to intensify in the future.
Developing effective control strategies is contingent upon the ability to test causative hypotheses of disease transmission within a statistical framework. Because the aetiology of outbreaks is likely multi-factorial, a broad range of factors should ideally be included in the analysis, e.g. epidemiological, climatological and anthropological. However, only limited information of this kind is often available, particularly in developing areas of the world where much of the human-mediated animal movement is part of the informal economy (Di Nardo et al. Reference Di Nardo, Knowles and Paton2011), or where infrastructural challenges prevent data collection.
Pathogen genomes sampled from a disease outbreak can provide important information on the past and current history of the epidemic, and have been used in many contexts for such a role. New technological developments in genomic sequencing are providing explosive amounts of genetic data, often, and importantly, accompanied by detailed spatial and temporal information. One of the challenges going forward is to develop methods that effectively integrate these data with myriad other parameters that impact disease spread (Gray et al. Reference Gray, Tatem, Lamers, Hou, Laeyendecker, Serwadda, Sewankambo, Gray, Wawer, Quinn, Goodenow and Salemi2009). Broadly speaking, phylogeography offers a framework in which specific hypotheses regarding pathogen gene flow and dispersal within an ecological context can be compared. A number of different methods have been developed for this goal, and a thorough review of these is outside scope of this work and discussed by others (i.e. Bloomquist et al. Reference Bloomquist, Lemey and Suchard2010; Biek and Real, Reference Biek and Real2010). Here, we discuss the application of a wide variety of statistically based methods (including Bayesian reconstruction, network parsimony analysis and regression) to specific viruses (influenza, salmon anaemia virus, foot and mouth disease and Rift Valley Fever) that have been associated with animal farming/movements and place them in a larger framework of the current threats of potential zoonotic events and the economic and biosecurity implications of pathogen outbreaks among our animal food sources. These studies all use inference of phylogenies and spatially explicit sampling to determine the patterns of movements with respect to the landscape. Such methodology is critical in order to understand and ultimately predict pathogen spread among animals and between animals and humans.
While the connection between molecular phylogeography, animal ecology and disease spread may appear to be a natural one, very often studies are undertaken in isolation without a holistic context or lacking statistical rigour. Our intent is to highlight the power of integrating these concepts and suggest that this type of analysis represents the way forward in addressing the complex problem of epidemics at the human-animal interface.
STUDIES
Influenza
Influenza has caused illness in humans since perhaps 412 BCE (Potter, Reference Potter2001). The first possible recorded epidemic occurred in 1173–4 CE, and the initial acknowledged report occurred in 1580 CE (Potter, Reference Potter2001). This 16th century pandemic arose in Asia and spread to Europe and Africa, and finally onwards to America. Subsequent pandemics from 1700 onwards also had a probable origin in China (Potter, Reference Potter2001), although the geographical origin of the 1918 outbreak may have been North America due to its first appearance there (Crosby, Reference Crosby1989). The ancestral lineages of the recent 2009 H1N1 epidemic have been found to co-circulate in China and not in North America (Smith et al. Reference Smith, Vijaykrishna, Bahl, Lycett, Worobey, Pybus, Ma, Cheung, Raghwani, Bhatt, Peiris, Guan and Rambaut2009), although the origin remains unclear (Lam et al. Reference Lam, Zhu, Wang, Smith, Holmes, Webster, Webby, Peiris and Guan2011). Thus, long before modern globalization, Asia was a major source of pandemics.
Influenza viruses are members of family Orthomyxoviridae, characterized by a negative-sense, single-stranded and segmented RNA genome. Three types of influenza circulate among humans: A, B, and C. Types A and B are both responsible for seasonal epidemics, while C appears to cause only mild respiratory distress in humans (CDC, 2011b). The impact of type A is much more severe than type B, both seasonally and in pandemics, due to several factors including higher genetic diversity, faster mutation rate and ability to infect multiple vertebrate hosts (humans, pigs and birds) (Hay et al. Reference Hay, Gregory, Douglas and Lin2001). Influenza A is further divided into subtypes defined by antigenic response to the haemagglutinin (H) and neuraminidase (N) proteins. At present, 16 haemagglutinin and 9 neuraminidase subtypes have been described (Palese and Shaw, Reference Palese, Shaw, Knipe and Howley2007). Due to the nature of the segmented genome, reassortment can occur between different antigenic subtypes, thus creating a novel combination of genes.
Avian waterfowl are considered to be the reservoir species for influenza A (Webster et al. Reference Webster, Bean, Gorman, Chambers and Kawaoka1992), as all known subtypes replicate asymptomatically in the intestines of aquatic birds (Hinshaw et al. Reference Hinshaw, Webster and Turner1980). Shed viruses from the birds infect other animals primarily through the faecal-oral route (CDC 2011a), often in lake water (Webster et al. Reference Webster, Bean, Gorman, Chambers and Kawaoka1992). In addition, the evolutionary rate appears much slower in birds than in pigs or humans, consistent with asymptotic infection (Fitch, Reference Fitch1996). Subtypes segregate both by species (shorebirds and ducks) and geographically (American and Eurasian strains) (Webster et al. Reference Webster, Bean, Gorman, Chambers and Kawaoka1992). Variants of H7 and H5 are highly virulent in domestic poultry and probably originated from the gene pool in aquatic birds. In contrast, a limited number of subtypes are found in humans and pigs. Pigs serve as a major reservoir of enzootic H1N1 and H3N2 (Webster et al. Reference Webster, Bean, Gorman, Chambers and Kawaoka1992). Pigs are susceptible to infection by both avian and human viruses due to broader specificity of cellular receptors in the trachea. Because pigs have both the avian and human-specific receptors, avian viruses can adapt to use the human-specific receptor within the pig, which then allows the virus to be spread via respiratory pathways (Ito et al. Reference Ito, Couceiro, Kelm, Baum, Krauss, Castrucci, Donatelli, Kida, Paulson, Webster and Kawaoka1998). Pigs may also transmit the virus back to birds in large poultry markets (Webster et al. Reference Webster, Bean, Gorman, Chambers and Kawaoka1992). Although other mammalian species are susceptible, pigs are the only ones that are domesticated and reared in high numbers, making them a likely vehicle in which avian and human viruses can reassort to create novel subtypes (Webster et al. Reference Webster, Bean, Gorman, Chambers and Kawaoka1992).
In temperate climates, influenza is a winter disease in humans and pigs, while in tropical regions the disease is present year-round. China may be unique among tropical regions in that the human and pig populations are the largest compared to other candidate tropical regions including Central Africa, India and Central America (Webster et al. Reference Webster, Bean, Gorman, Chambers and Kawaoka1992). The likelihood of a tropical epicentre for influenza was further demonstrated by a phylogenetic study of human H1N1 suggesting that continual and unidirectional gene flow provides fresh viral diversity for seasonal epidemics (Rambaut et al. Reference Rambaut, Pybus, Nelson, Viboud, Taubenberger and Holmes2008). A detailed phylogeographic analysis of H3N2 influenza A virus circulating in Southeast Asia has suggested that the global persistence of the virus may be the result of migrating metapopulations, in which multiple different localities may seed seasonal epidemics in temperate regions in a given year (Bahl et al. Reference Bahl, Nelson, Chan, Chen, Vijaykrishna, Halpin, Stockwell, Lin, Wentworth, Ghedin, Guan, Peiris, Riley, Rambaut, Holmes and Smith2011). Delineating the pattern of Influenza A movement among the potential porcine and avian reservoirs is, therefore, of critical importance in developing effective control strategies.
Case Study 1: H5N1 in Asian poultry
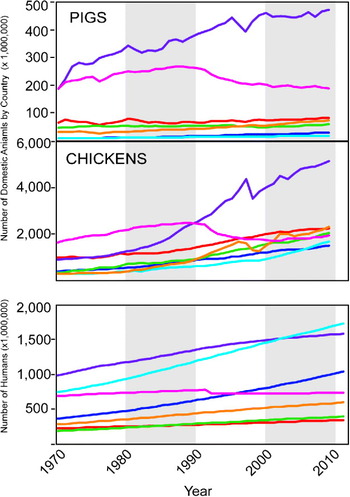
South and Southeast Asia are recognized as hotbeds of pathogen emergence (Coker et al. Reference Coker, Hunter, Rudge, Liverani and Hanvoravongchai2011). A particular cause for concern is the rapid growth of poultry and pig production in Asia, which provides multiple hosts in crowded conditions, often with absence of effective control and surveillance practices (Coker et al. Reference Coker, Hunter, Rudge, Liverani and Hanvoravongchai2011). East Asia (which includes China) has experienced a five-fold increase in the number of chickens since 1970, and a more than doubling of the number of pigs, far surpassing any other region (Fig. 1). Furthermore, nearly one-third of the human population lives in East or Southeast Asia despite only comprising 12% of the 13 billion hectares of the Earth's land (UN FAO-STAT, 2011). When India is included with South Asia, the three regions together account for more than half of the total human population, residing on only 17% of the Earth's surface (UN FAO-STAT, 2011).
Population growth for pigs, chickens and humans 1970–2011 in 7 major world regions. Data are from the Food and Agriculture Organization statistical database. The line colour corresponds with the colour of the country as follows: East Asia = purple, South Asia = cyan, Southeast Asia = orange, Europe = pink, North America = red, South America = green, Africa = blue.

The initial outbreak in humans of H5N1 occurred in Hong Kong in 1997. The ancestor of the virus was determined to have originated from a goose farm in the town of Shanshui, Guangdong (Fig. 2) (Zhao et al. Reference Zhao, Shortridge, Garica, Guan and Wan2008). The virus has also been found in pigs in Indonesia (Nidom et al. Reference Nidom, Takano, Yamada, Sakai-Tagawa, Daulay, Aswadi, Suzuki, Suzuki, Shinya, Iwatsuki-Horimoto, Muramoto and Kawaoka2010), and in 2005 a major outbreak was detected in migratory waterfowl in the Qinghai province, which caused concern for worldwide spread (Chen et al. Reference Chen, Smith, Zhang, Qin, Wang, Li, Webster, Peiris and Guan2005). Lemey et al. (Reference Lemey, Rambaut, Drummond and Suchard2009) employed a probabilistic model within a Bayesian framework to reconstruct the discrete geographic locations for each ancestral node in the phylogeny using the genetic sequence data from the virus. Highly supported migration routes of H5N1 through Asia were then determined. The dataset consisted of 192 HA and NA sequences sampled from 20 locations in Eurasia. This novel phylogeographic framework allowed the sampling locations to be taken into account, along with the sampling dates (Drummond et al. Reference Drummond, Nicholls, Rodrigo and Solomon2002) implemented in the program BEAST (Drummond and Rambaut, Reference Drummond and Rambaut2007) while accounting for uncertainty in parameter estimates. For parameters of interest (including the phylogeny), a posterior distribution was calculated with mean and 95% high posterior density intervals. The authors determined that the root location with the strongest support over all trees in the posterior distribution was Guangdong, China. This estimate from the genetic data was consistent with the epidemiological data, also indicating that Guangdong was the epidemic origin (Xu et al. Reference Xu, Subbarao Cox and Guo1999). The authors also tested whether including geographic distance between locations provided a significant improvement to the model. Distance was not found to add any information, which was interpreted as consistent with migratory birds and/or transport of poultry spreading the virus between infected locations.
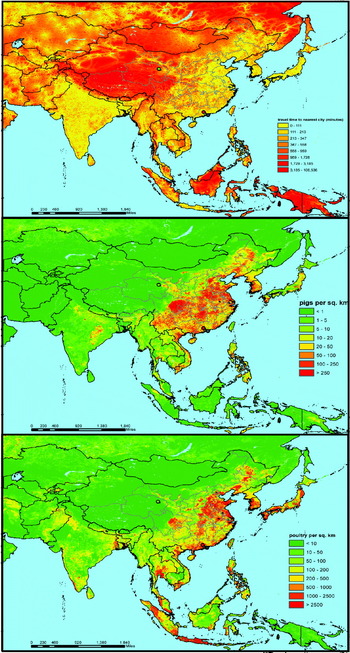
Accessibility and livestock density in East Asia. The top panel shows the travel time to the nearest major urban centre based on various factors including road quality and elevation. The middle panel shows the density of pigs and bottom panel shows the density of poultry. Black lines denote country boundaries, grey lines denote provinces in China. The green dot denotes Qinghai Lake in Qinghai province, site of the 2005 outbreak among migratory birds. The red dot denotes the town of Shanshui where the H5N1 epidemic likely arose. The blue dot indicates Hong Kong, where the H5N1 epidemic escalated. Data were obtained from http://bioval.jrc.ec.europa.eu/products/gam/software.htm. Livestock density data were obtained from the Food and Agriculture Organization http://www.fao.org/AG/againfo/resources/en/glw/GLW_dens.html.

Guangdong is also the overall largest livestock (pig and poultry) producer in China (Sichuan is currently the leader in overall pork production, although 70% of the pigs there are raised by small-scale farmers as opposed to only 20% in Guangdong) (Schneider, Reference Schneider2011). Thus, if the virus were to infect one of the millions of pigs in this region, this massive animal reservoir could provide the mechanism for reassortment and/or adaptation to human physiology. Fig. 2 shows the density of chickens, pigs and the ease of human movement in East Asia. It is clear that this region is characterized by rapid transit time along with high livestock density, making the chances of reassortment, transmission to humans and subsequent global spread a frighteningly real possibility.
Case Study 2: H1N1 in pigs in North America
There are an estimated 66·6 million heads of pigs in United States as of 2011 (USDA, 2011). The epicentre of swine processing is located the “Corn Belt” region, which includes Iowa, Illinois, Indiana and Minnesota (Shields and Mathews, Reference Shields and Mathews2003). However, a substantial number of pigs are reared in other states, such as North Carolina and Oklahoma, and shipped to the Corn Belt for finishing and slaughter. In 2001 over ¼ of all pigs crossed a state border at some point in their lives, and only 29 percent of pigs are ‘finished’ at the same site on which they were farrowed (Shields and Mathews, Reference Shields and Mathews2003).
Nelson et al. (Reference Nelson, Lemey, Tan, Vincent, Lam, Detmer, Viboud, Suchard, Rambaut, Holmes and Gramer2011) investigated the role of inter-regional pig-flows in the spatial dissemination of human-origin H1 influenza using a similar methodology as described in the above study. The authors generated 1,412 HA1 sequences from viruses collected from pigs in the United States and Canada that exhibited respiratory disease during the period 2003–2008, plus 104 sequences from Genbank, which in total represented 23 US states. A maximum likelihood tree revealed a subset of sequences (n = 325) that were phylogenetically distinct from the others. This subset was further broken down into two datasets that were used in the spatial analysis: 127 H1N1 and 169 H1N2. Sampling locations were grouped into the USDA-defined regions of Midwest, Southeast, and South-central. Phylogenies were inferred in a probabilistic framework that again incorporated the time of sampling and discrete location into the analysis.
Several methods were then applied to determine statistical spatial structure. First, the authors used the parsimony score and association index tests to determine whether location was significantly associated with the phylogeny. For all three regions, significant spatial structure was detected for the Midwest, South-central and Southeast samples (P < 0·05). Second, the mean and 95% confidence intervals of the number of movements from one of the three regions to another were calculated over the posterior distribution of trees. These movements were allowed to be asymmetric and were estimated under a single model of discrete diffusion among the three regions using both the H1N1 and H1N2 datasets combined. The vast majority of gene flow events occurred in the directions of Southeast to Midwest followed by South-central to Midwest. Less frequent viral migration was also detected from Midwest to Southeast. These migration patterns are consistent with the known flow of pigs from agricultural data.
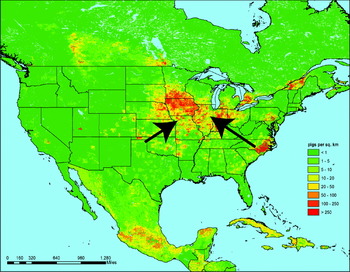
Importantly, the authors investigated specific hypotheses for the observed geographical patterns of gene flow. Four potential predictors were modeled into the Bayesian analysis: (1) the number of pigs transported annually from one region to another; (2) the pig population size in the region of origin; (3) the pig population size in the region of destination; and (4) the product of the pig population sizes in the region of origin and the region of destination. These data were collected from statewide data and aggregated to the region. A Bayes Factor test was used to compare the different models. The best fit was found for model 1 (rates proportional to the number of pigs transported from one region to another). The pig population size of the destination population was also a better fit than an equal rates model. Interestingly, the population size of the population at the origin was a very poor fit. The results from this study show that methods of rearing pigs involving long-distance transport are responsible for introducing new influenza strains into the massive pig population of the Corn Belt (Fig. 3). Unlike the case for H5N1, the origin of the virus was found in the less densely populated region.
H1N1 gene flow and poultry density in the USA. Arrows indicate the direction of movement as inferred by Nelson et al. (Reference Nelson, Lemey, Tan, Vincent, Lam, Detmer, Viboud, Suchard, Rambaut, Holmes and Gramer2011). Livestock density data were obtained from the Food and Agriculture Organization http://www.fao.org/AG/againfo/resources/en/glw/GLW_dens.html.

Infectious Salmon Anaemia Virus
In 2006, aquaculture provided over 50 million tons of food worldwide (a value of US$78.8 billion) and is the fastest growing animal food-producing sector. Production of farmed salmon is dominated by Norway and Chile, which produce 33 and 31 percent, respectively, of total worldwide output (UN FAO, 2008). Salmon farms are often of high density creating an environment in which pathogens can multiply and adapt quickly. Furthermore, these virulent strains may then be transmitted back to the wild population, posing a threat to the general fish supply (Krkosek et al. Reference Krkosek, Ford, Morton, Lele, Myers and Lewis2007).
Infectious Salmon Anaemia Virus (ISAV) belongs to the family Orthomyxoviridae (Falk et al. Reference Falk, Aspehaug, Vlasak and Endresen2004) and therefore shares similarities with influenza viruses (8 SS RNA segments) (Palese and Shaw, Reference Palese, Shaw, Knipe and Howley2007). This pathogen was first identified in Norway in 1984 (Thorud and Djupvik, Reference Thorud and Djupvik1988), and subsequently detected in the 1990s in Canada, Scotland and Chile. Two genotypes have been described, European and North American, which share a common ancestor around 1900, coincident with the initiation of salmon importation to America from Europe (Cottet et al. Reference Cottet, Cortez-San Martin, Tello, Olivares, Rivas-Aravena, Vallejos, Sandino and Spencer2010). Sequences from Norway, Scotland, Faroe Islands and Nova Scotia belong to the European genotype, while Canadian and North American sequences belong to the American genotype (Krossøy et al. Reference Krossøy, Nilsen, Falk, Endresen and Nylund2001). Interestingly, sequences sampled from a recent outbreak in Chile in 2007 all share a common ancestor within the European clade. The Chilean virus was probably introduced in the 1990s (Kibenge et al. Reference Kibenge, Godoy, Wang, Kibenge, Gherardelli, Mansilla, Lisperger, Jarpa, Larroquete, Avendaño, Lara and Gallardo2009), although the resulting epidemic was the result of reassortment among 4 parental strains (Cottet et al. Reference Cottet, Cortez-San Martin, Tello, Olivares, Rivas-Aravena, Vallejos, Sandino and Spencer2010).
ISAV causes fatal systemic infections in marine-farmed Atlantic salmon as well as asymptomatic infections in wild fish populations (Kibenge et al. Reference Kibenge, Munira, Kibengea, Josepha and Monekea2004). The virus can cause extreme mortality (up to 100%) and thus represents a major burden to the aquaculture industry (Kibenge et al. Reference Kibenge, Munira, Kibengea, Josepha and Monekea2004). Pathogenic strains in farmed salmon appear to be caused by independent introductions of distinct strains from the wild populations into the North American and European farmed fish, which then adapted to the intensive conditions at the fish farms (Blake et al. Reference Blake, Bouchard, Keleher, Opitz and Nicholson1999). The causes of the spread of ISAV are not clear (Murray et al. Reference Murray, Smith and Stagg2002). For example, the pattern of spread in the UK showed discontinuity in space but a large infected area, inconsistent with spread via fish to fish contact or avian vectors (Murray et al. Reference Murray, Smith and Stagg2002). However, in smaller regions the outbreaks do tend to cluster in space and time and the number of potential risk factors is quite large (Scheel et al. Reference Scheel, Aldrin, Frigessi and Jansen2007).
Case Study: ISAV in the Netherlands
Lyngstad and colleagues investigated the spatial dynamics of ISAV among sites in Norway (Lyngstad et al. Reference Lyngstad, Hjortaas, Kristoffersen, Markussen, Karlsen, Jonassen and Jansen2011). The study population consisted of farmed Atlantic salmon from sites with confirmed ISAV as well as at-risk sites neighbouring those with confirmed virus. Maximum likelihood phylogenies were inferred from sequences collected between January 2007 and July 2009. The authors found genetic similarities in geographic regions, particularly in the northern cluster. To investigate causes of geographic clustering, a binary variable that reflected genetic similarity between pairs of isolates was calculated by defining a pair as “similar” if they shared the same deletion patterns in the highly polymorphic region of the haemagglutininesterase (HE) gene, and a genetic distance of ⩽1% in the 5′-part of HE. The genetic distance was used as the dependent variable. Pairwise matrices were also calculated for explanatory variables including seaway distance, shared management and shared smolt-producing sites. In addition, a matrix of time of sampling was used as a fourth variable. A univariate logistic regression analysis showed significant association for significant effects for all the tested variables, although the most significant variable was seaway distance. Adding multiple variables did not improve the fit of the overall model. Geographic proximity was more strongly associated with transmission than shared smolting site or managements, since all of the northern transmission sites shared the same genotype but not the same suppliers.
The authors conclude that ISAV is spread directly between proximate salmon farms, and that direct transmission between sites results in nearly identical strains circulating within a small area. The transmission may be caused by virions in the water or via escaped fish introducing the virus directly. However, distance only accounted for about half of the observed patterns in the study. This suggests that factors unaccounted for the study also contribute to transmission. Furthermore, by investigating the virulent vs. non-virulent genotypes, the authors conclude that low virulent strains evolve independently into virulent ones, thus causing localized epidemics that are contained in space. Similar to influenza, a natural reservoir may exist for this virus from which new strains emerge that attain virulence in the dense conditions of factory farms. However, this natural reservoir has yet to be identified for ISAV.
Foot And Mouth Disease Virus
Foot and mouth disease virus (FMDV) is a member of the family Picornaviridae, genus Phthovirus. It is a single strand of positive-sense RNA approximately 8·3 kb in length encoding a single polyprotein. FMDV is the most contagious disease of both domesticated and wild ruminant cloven-hooved animals (Di Nardo et al. Reference Di Nardo, Knowles and Paton2011). Although not typically fatal, infected herds result in a decrease in productivity for farmers, posing a significant risk to food security in developing countries (Forman et al. Reference Forman, Le Gall, Belton, Evans, François, Murray, Sheesley, Vandersmissen and Yoshimura2009). Because foot and mouth disease (FMD) is highly contagious and results in severe economic impacts, FMDV is considered the most important pathogen limiting trade of animals and animal products worldwide (Arzt et al. Reference Arzt, Juleff, Zhang and Rodriguez2011).
Transmission occurs via direct contact between acutely infected and susceptible animals and appears to follow movement of infected animals, or animal products (Di Nardo et al. Reference Di Nardo, Knowles and Paton2011). Primary infection of ruminants is usually by the respiratory route, whereas pigs are more often infected by the oral route (Cottral, Reference Cottral1969). However, long-distance movements may implement an alternative method of transmission, such as fomites, other wildlife or water (Arzt, Reference Arzt, Juleff, Zhang and Rodriguez2011). Thus, as in the case of ISAV, the exact mechanisms by which this virus is spread are unclear.
Case study: FMD in the UK
There have been two recent major outbreaks of FMD in the UK in 2001 and 2007. While the latter incident was caused by an escaped virus from a laboratory (Cottam et al. Reference Cottam, Wadsworth, Shaw, Rowlands, Goatley, Maan, Maan, Mertens, Ebert, Li, Ryan, Juleff, Ferris, Wilesmith, Haydon, King, Paton and Knowles2008a) and was largely contained to a very limited geographic area (DEFRA, 2011), the 2001 epidemic had far more reaching consequences. In 2001, 2,030 infected premises of FMD were confirmed in Great Britain between February and September 2001 (DEFRA, 2002). The index case for the epidemic was a pig finishing unit in Northumberland where the virus was likely introduced via contaminated meat used as feed (DEFRA, 2002). Epidemiological evidence suggested that two routes of spread occurred from the initially infected farm: movement of infected animals and airborne transmission to sheep at a neighbouring farm, which then spread the virus to subsequent animals in the market chain (DEFRA, 2002).
Cottam and colleagues used complete genomic sequencing from viruses isolated from farms involved in the early outbreak to reconstruct transmission pathways (Cottam et al. Reference Cottam, Haydon, Paton, Gloster, Wilesmith, Ferris, Hutchings and King2006). These analyses were consistent with a model of direct contact transmitting the virus within a region. However, following the initial epidemic, movement of animals was banned on a national level. The mechanism of spread following this event is not fully understood and could have been ether via an airborne or fomite route. Thus, determining the alternative pathways of spread remains an important goal.
Substantial epidemiological information was collected during the UK crisis regarding exact dates of clinical symptoms and culling. To understand more fully the early FMD epidemic, Cottam and colleagues (Cottam et al. Reference Cottam, Thébaud, Wadsworth, Gloster, Mansley, Paton, King and Haydon2008b) investigated full genome sequences sampled from farms infected with FMD in 2001. Genealogies of the virus were inferred using statistical parsimony and rooted with a known outgroup. Then, the possible locations of each internal node were defined assuming no back mutation and that only one lineage would be present on any given farm. Putative transmission trees were constrained to be consistent with definitive transmission linkages established prior to the study. The likelihood of each of the possible transmission trees constructed with this method was then calculated based on epidemiological parameters, including probability of infection at a given time and duration of incubation. Over 40,000 transmission trees were consistent with the genetic data; however, only 4 trees comprised 95% of the likelihood sum, demonstrating that the inclusion of epidemiological data provides significant insight when combined with genetic reconstruction.
For the most likely tree, a Monte Carlo approach was used to determine whether the 13 identified transmission events occurred non-randomly with respect to distance and direction. The mean distance and direction of travel was compared to a null distribution obtained by randomizing the location assignments. This analysis demonstrated that transmission between pairs of farms was not random, but rather a trend was present for events to move in an easterly and southeasterly direction. Furthermore, the mean distance of the transmission events (4·8 km) was significantly less than expected when the transmission between farms occurred randomly with respect to distance (7·5 km).
The authors note some caveats to the study, including the accuracy of the epidemiological data. This will certainly remain a problem in all studies of this sort, as mild infections may not be observed and recorded as the true start of the epidemic at a particular site. Yet, this study provides additional information on the mechanisms of the FMD outbreak following the ban on animal movements.
Rift Valley Fever Virus
Rift Valley Fever Virus (RVFV) is a mosquito-vectored disease that causes explosive epidemics in livestock, primarily sheep and cattle, as well as illness in humans. A primary symptom is the abortion of foetuses among infected animals.The virus was first isolated in Kenya in 1930 and subsequently caused epidemics in other sub-Saharan African countries including South Africa in 1951 (Mundel and Gear, Reference Mundel and Gear1951), Egypt in 1977 (Meegan, Reference Meegan1979) and West Africa in 1987 (Jouan et al. Reference Jouan, Coulibaly, Adam, Philippe, Riou, Leguenno, Christie, Ould Merzoug, Ksiazek and Digoutte1989). In 2000, an outbreak occurred in the Arabian Peninsula, marking the first time the virus was detected outside of Africa (MMWR, 2000).
The epidemiology of RVFV during epidemics is well defined. Unusually heavy rainfall leads to localized flooding, which results in hatching of naturally infected mosquito eggs (Davies et al. Reference Davies, Linthicum and James1985). The adult mosquitoes then transfer the virus during feeding on livestock. Major outbreaks are associated with climatic variations such as El Niño and, indeed, a recent outbreak in East Africa was predicted based on weather patterns (Anyamba et al. Reference Anyamba, Chretien, Small, Tucker, Formenty, Richardson, Britch, Schnabel, Erickson and Linthicum2009). RFVF may be maintained during inter-epizootic events by transovarial transmission of Aedes eggs, during which time the eggs can remain dormant for long periods although it is unclear whether this mechanism is the sole factor in persistence of the virus (Davies, Reference Davies1975). Furthermore, the forces driving the long-distance movements of the virus across the continent are not defined and may differ among incidents. For example, the introduction into Egypt may have been associated with camel movement (Hoogstraal et al. Reference Hoogstraal, Meegan, Khalil and Adham1979), which would be an unlikely source of other introductions, e.g. to Madagascar.
The evolutionary history of RVFV has been well characterized. Bird and colleagues used full-genome sequencing to reconstruct the relationship among viruses sampled from 1944 to 2000 in the major sites of past epizootics (Bird et al. Reference Bird, Khristova, Rollin, Ksiazek and Nichol2007). The sequences were grouped into seven clusters (A–G) with strains from diverse geographic regions found in each cluster. Interesting relationships were found among the sampled sequences, including the probable ancestor of the Saudi Arabian outbreak in East Africa (Bird et al. Reference Bird, Khristova, Rollin, Ksiazek and Nichol2007).
Case study: RVFV spread in Africa
We sought to clarify the spatial patterns of this virus by incorporating geographic information using Bayesian analysis in combination with knowledge on the density of livestock on the continent. Publically available RVFV sequences for which information about the time and location of sampling was available were collected (Table S1). A total of 39 and 32 sequences were collected for the L and S genes, respectively, spanning from 1944–2007 and representing major epizootic outbreaks at 14 locations. Where the city was not available in the original publication, historical information was used to determine the most probable location. Bayesian phylogeographic analyses were performed for the two genes independently in the BEAST software package (Drummond and Rambaut, Reference Drummond and Rambaut2007) using the HKY + G nucleotide model under a relaxed clock model (Drummond et al. Reference Drummond, Ho, Phillips and Rambaut2006) with a constant population size coalescent prior. The probability distribution for all discrete locations was calculated for each internal node in the MCC tree using the phylogeographic model described by Lemey et al. (Reference Lemey, Rambaut, Drummond and Suchard2009). Hypotheses of viral spread were modeled by using either a flat prior or a prior informed by inverse geographic distance on the migration matrix. The resulting estimates were compared using Bayes Factors (Suchard et al. Reference Suchard, Weiss and Sincheimer2001) and the KL index (Lemey et al. Reference Lemey, Rambaut, Drummond and Suchard2009) for a specific internal node, which was well supported in both genes.
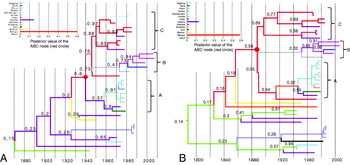
The reconstructed transmission history of RVFV is visualized in Fig. 4. The temporal origin of the epidemic was placed in the 19th century, consistent with previous estimates (Bird et al. Reference Bird, Khristova, Rollin, Ksiazek and Nichol2007). Overall, support for the putative geographic location of internal nodes was higher closer to the tips of the tree, while weaker closer to the root. This is expected due to sparse sampling in the early epidemic. Strong topological support was found for a super-clade containing the majority of sequences, which contained the sub-clades previously defined as “A”, “B”, and “C” (Bird, Reference Bird, Khristova, Rollin, Ksiazek and Nichol2007). The most recent common ancestor (MRCA) of this super-clade is referred to hereafter as MRCA(ABC). The most probable geographic location of MRCA(ABC) was Bangui (Central African Republic), while the support for the other potential locations was very low (Fig. 4). Similar patterns were observed for both the S and the L genes, suggesting strong phylogenetic signal. Interestingly, the virus is believed to be endemic in the forested regions of central Africa, in contrast to East and South Africa, in which the virus appears in epidemic bursts (Pourrut et al. Reference Pourrut, Nkoghé, Souris, Paupy, Paweska, Padilla, Moussavou and Leroy2010). RVFV is potentially involved in a sylvatic cycle that maintains diversity where it infects wild rather than domestic animals (Pourrut et al. Reference Pourrut, Nkoghé, Souris, Paupy, Paweska, Padilla, Moussavou and Leroy2010). These results are consistent, therefore, with a model in which multiple independent migrations emanated from a central African reservoir.
Reconstructed spatio-temporal transmission history of RVFV. The MCC tree for (A) S gene and the (B) L gene are shown in the main figure. Branch lengths are proportional to years according to the timescale at the bottom. Posterior probabilities of the ancestral location for internal nodes are given above the branch. Previously defined A, B, and C clades are indicated. The red circle denotes MRCA(ABC). Branches are coloured according to the sampling or inferred geographic location, corresponding to the colours used in the inset graphs. Inset graphs: probability (y-axis) of each of 14 locations (x-axis) as the location of MRCA(ABC).

To determine whether geographic distance acted as a significant factor in the spread of RVFV, we compared a model that incorporated the inverse geographic distance between locations as a prior for the migration matrix versus a model assuming equal probability of migration among locations. Two different comparative indices were used: (1) the ratio of marginal likelihoods between the models (Bayes Factor) (Suchard et al. Reference Suchard, Weiss and Sincheimer2001) and (2) the KL index (Lemey et al. Reference Lemey, Rambaut, Drummond and Suchard2009) for the spatial location of MRCA(ABC). Both measures indicated that the inclusion of geographic distance was statistically insignificant, suggesting that viral movement was independent of the distance between locations. This could point towards a model in which a non-terrestrial reservoir or vector species is the driving force behind the long distance migrations. Due to the short distances over which mosquitos travel during the course of their lifetime, it is unlikely that they are naturally carrying the virus long distances. However, infected eggs could be carried by wind or human mediated travels (e.g. airplanes or tyres).
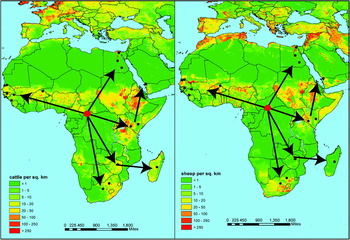
Finally, we compared the inferred migration patterns of RVFV from the Bayesian analysis with the distribution of cattle and sheep in Africa (Fig. 5). Strikingly, the epicentre of the epidemic in Bangui is in a very low cattle/sheep density area, while the outbreaks occur in very high-density areas. It is interesting that the movement of the virus crossed large areas of low livestock density, suggesting that other mechanisms besides movement of domestic cattle and sheep were responsible for the introduction of the virus in new areas. This pattern is similar to that shown for H1N1 in the US where the less-densely populated areas acted as the source.
RVFVgene flow and poultry density in Africa. Arrows indicate the direction of movement of the virus as described in the text. Livestock density data were obtained from the Food and Agriculture Organization http://www.fao.org/AG/againfo/resources/en/glw/GLW_dens.html.

DISCUSSION AND CONCLUSIONS
Profound changes in the relationship among humans and animals will likely provide fertile ground for new and re-emergent infectious diseases. Addressing this situation from a public health standpoint will require collaborative efforts from many fields, formalized by the ‘One World, One Health’ framework which emphasizes cooperation among diverse disciplines and focuses on the intersection of humans, animals, and ecology (UN FAO, 2009; American Veterinary Medicine Association, 2008). One major challenge to this ideal is the lack of institutional involvement in both the private sector and the informal economy, which are at the forefront of human-animal interactions, potentially hampering the ability of investigators to adequately collect relevant information in situations that foment epidemics/epizootics. For example, the transformation of meat production into an industrial model has occurred so quickly that governments have been unable to posit sufficient regulatory boundaries on virtually all aspects of production (UN FAO, 2009). On the other hand, technological improvements now allow detailed and precise information of many kinds (e.g. GPS coordinates, full genomes) to be collected, processed and analyzed. Adequately addressing the mounting challenges, and opportunities, in disease epidemiology will require a commitment to improve communications amongst investigators from many fields as well as the ‘participants on the ground’. Moreover, new ways of thinking about the intersection of myriad types of data and models to formalize their interactions are critical.
Phylogeography is an important tool to investigate epidemic emergence with respect to the human-animal interface. While several authors have discussed in detail the recent advances in phylogeographic inference (e.g. Bloomquist et al. Reference Bloomquist, Lemey and Suchard2010; Biek and Real, Reference Biek and Real2010), and the impact of their application in investigations of molecular epidemiology of viral pathogens (Holmes, Reference Holmes and Rambaut2008), the scope of the present work was to highlight the power of phylogeography in generating and testing hypotheses on zoonosis and/or ecological factors (e.g. climate patterns, animal farming/movements, etc.) driving specific outbreaks. The few case studies discussed are necessarily limited and certainly not representative of the extensive literature on the subject. These studies, however, highlight two important points: (1) the power of phylogeography in identifying probable mechanisms of infectious disease origin and spread within animal populations, as well from animal to human populations; (2) the consistent role of human-mediated long-distance transport of animals and intense animal farming in the emergence and global spread of such outbreaks. Influenza viruses are a clear example of how high livestock density or methods of rearing pigs involving long-distance transport can increase the chances of reassortment, transmission to humans and subsequent global spread. The directional spread of ISAV or FMDV between proximate farms represent other examples of how phylogeography can investigate the impact of human actions (in terms, for example, of specific farming practices) in the dissemination of animal pathogens and the emergence of local or even global outbreaks. Finally, RVFV phylogeographic patterns pointed out the need to investigate alternative hypotheses to explain the spread of the virus over long distances, demonstrating that phylogeography can be an effective tool to recognize gaps in our current knowledge and understanding of infectious diseases epidemiology, which is in itself a valuable pointer to future work.
In conclusion, this review highlights the importance of taking an inclusive and holistic approach to the study of emerging epidemics. Using epidemiological and ecological data along with the statistical tools of molecular phylogeography will allow a better understanding of the ways in which pathogens spread through animal and human communities. Further, we advocate for continued and improved communications and sharing of data amongst fields and institutions in order meet the challenges of 21st century disease dynamics.
ACKNOWLEDGEMENTS
RRG is supported by the UK Medical Research Council.