INTRODUCTION
Organic matter entrapped in speleothem carbonate is increasingly recognized as a promising tool for the reconstruction of past ecosystem and climate change (Bosle et al. Reference Bosle, Mischel and Schulze2014; Perrette et al. Reference Perrette, Poulenard and Protière2015; Quiers et al. Reference Quiers, Perrette and Chalmin2015; Blyth et al. Reference Blyth, Hartland and Baker2016; Heidke et al. Reference Heidke, Scholz and Hoffmann2018). Organic carbon (OC) primarily originates either from the overlying soil and karst system from which it is transported into caves by vadose water, or from microbial production within the cave (Blyth et al. Reference Blyth, Hartland and Baker2016). Other sources of OC in cave systems include airborne material, generally limited to areas near the cave entrances, and compounds derived from cave-dwelling animals, which can constitute a major source of OC if large animal populations are present (Blyth et al. Reference Blyth, Baker and Collins2008). The portion of OC stemming from the surface is argued to be dominant in most karst systems (Baker and Genty Reference Baker and Genty1999; Shabarova et al. Reference Shabarova, Villiger and Morenkov2014; Perrette et al. Reference Perrette, Poulenard and Protière2015; Quiers et al. Reference Quiers, Perrette and Chalmin2015), but substantial reworking of OC is generally observed (Einsiedl et al. Reference Einsiedl, Hertkorn and Wolf2007; Birdwell and Engel Reference Birdwell and Engel2010; Shabarova et al. Reference Shabarova, Villiger and Morenkov2014; Lechleitner et al. Reference Lechleitner, Dittmar and Baldini2017). Nevertheless, OC incorporated in stalagmites is considered a potentially very sensitive proxy for surface environmental conditions (Blyth et al. Reference Blyth, Hartland and Baker2016, Reference Blyth, Baker and Collins2008).
Isotopic studies on carbon can provide insight into provenance, processing, and age of organic matter in environmental matrices. Stable carbon isotope ratios (δ13C) in biogenic samples are generally strongly fractionated by metabolic processes. Higher plants utilizing the C3 carbon fixation pathway exhibit very negative δ13C values (–32 to –22‰), whereas C4 plants fractionate less strongly (–16 to –10‰) (Vogel Reference Vogel1980). Radiocarbon (14C), in contrast, provides a measure of the age of OC analyzed, indicating its recalcitrance and turnover time.
The conventional understanding is that OC incorporated in stalagmites is not directly affected by the addition of 14C-dead carbon from limestone dissolution (Blyth et al. Reference Blyth, Hua and Smith2017), and may thus provide important constraints on drivers of the karst carbon cycle, and on (past) surface conditions.
Because of the very low amounts of organic carbon found in stalagmites embedded in a matrix virtually exclusively derived of carbonate, large sample sizes typically need to be processed for analysis, and careful treatments are needed to remove inorganic carbon and other interferences. Both increase the potential for contamination through laboratory procedures, rendering such measurements challenging (Wynn and Brocks Reference Wynn and Brocks2014). Moreover, the effect of large sample sizes on their chronological assessment needs to be considered, e.g., ideally through sampling along growth layers where possible (e.g., fast growing stalagmites). Thus far, a few studies on δ13C in non-purgeable organic carbon (NPOC) incorporated in stalagmites have been conducted (Blyth et al. Reference Blyth, Shutova and Smith2013a, Reference Blyth, Smith and Drysdale2013b) using an approach based on acid digestion of stalagmite samples to remove inorganic carbon from CaCO3, followed by oxidation of the carbon remaining in the solution to CO2, from which δ13C can then be determined. Their results show that accurate and reproducible δ13C measurements are possible from stalagmites, using relatively small sample amounts (100–200 mg CaCO3). To our knowledge, the only published studies on stalagmite OC 14C to date concentrate on the use of speleothems with high OC concentrations for dating purposes (e.g., Borsato et al. Reference Borsato, Frisia and Jones2000; Genty et al. Reference Genty, Konik and Valladas2011; Blyth et al. Reference Blyth, Hua and Smith2017). This is because the greater sample sizes required for 14C measurements on stalagmite NPOC result in attendant increases in procedural blanks and other analytical uncertainties. The latter limitation is partly alleviated by recent developments in accelerator mass spectrometry (AMS) that permit analysis of small (<20 μg C) samples (Ruff et al. Reference Ruff, Wacker and Gäggeler2007; Fahrni et al. Reference Fahrni, Wacker and Synal2013). Here, we describe a suite of experiments conducted to develop an extraction and oxidation procedure that builds on prior developments (Lang et al. Reference Lang, Bernasconi and Früh-Green2012, Reference Lang, Früh-Green and Bernasconi2013, Reference Lang, Mcintyre and Bernasconi2016), and show results from its application for studies of both δ13C and 14C of NPOC preserved in stalagmites. We test the method on three stalagmites from caves in very different environments (Tskaltubo Cave in the Caucasus Mountains, Blessberg Cave in Germany, and Yok Balum Cave in Central America), and covering different time spans (40 – ∼2 ka BP, i.e., thousands of years before present, with the present defined as 1950 CE). We then apply the method on two well-dated stalagmites from Yok Balum Cave, Belize (YOK-G and YOK-I). The latter stalagmites were previously sampled for high-resolution inorganic 14C (Ridley et al. Reference Ridley, Asmerom and Baldini2015; Lechleitner et al. Reference Lechleitner, Baldini and Breitenbach2016), revealing a very clear imprint of bomb 14C in the carbonate phase. Because of high growth rates in these stalagmites, enough sample material was available to analyze NPOC 14C before and after the bomb pulse, providing a novel opportunity to study the organic carbon cycle in cave systems from a 14C perspective.
MATERIALS
Stalagmite Samples
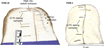
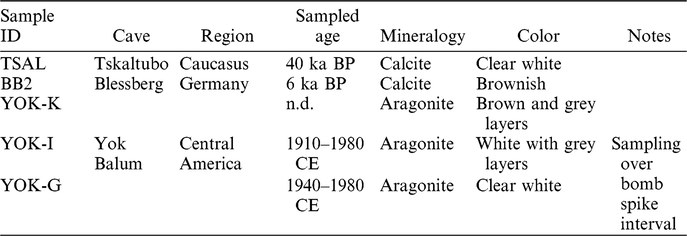
Five stalagmites of different provenance, age, and mineralogy were used for this preliminary study (Table 1, Figure 1). Stalagmites are prone to OC contamination, either from improper handling or outside influences (Wynn and Brocks Reference Wynn and Brocks2014). Therefore, any method attempting to extract a primary NPOC signal from these samples needs to consider and eliminate the possibility of sample contamination, particularly on the stalagmite surface. In this study, two methods for the removal of contaminated surfaces were applied. The test stalagmites TSAL, BB2, and YOK-K were available as discrete sample pieces. In this case, the entire sample was leached with 1N HCl to remove about 1 g of CaCO3 (5–20% of total mass) from all surfaces. After leaching, the samples were washed three times with ultrapure water and dried in an oven at 60°C, before being powdered to homogeneity using an agate mortar pre-cleaned with methanol and dichloromethane. All sample powders were stored in pre-combusted glass vials with acid-washed Teflon caps (storage time varied from days to months, depending on the sample).
Top sections of stalagmites YOK-G and YOK-I from Yok Balum Cave, Belize. In this study, the bomb spike interval was targeted for isotopic characterization of the organic matter entrapped in stalagmite carbonate. For sample YOK-G, the tracks left by drilling for NPOC analysis are visible.

Details of the stalagmites used. Sample ages are given in ka BP (thousands of years before present, with the present defined as 1950 CE), or as CE, i.e., Common Era.

For stalagmites YOK-I and YOK-G, smaller samples were drilled from specific depths to capture the bomb spike interval. For YOK-I, this was achieved by drilling samples using a hand-held drill (Dremel 4000) equipped with newly purchased diamond-coated drill bits. The drill bits were pre-cleaned by extracting them three times using methanol, dichloromethane, and ultrapure water, and dried in an oven at 60°C overnight. Before drilling, dust and particles were removed from the stalagmite surface using compressed air, and the top ∼1 mm was removed using a separate drill bit and discarded. For YOK-G, a new Kodiak carbide end mill was used on a Sureline micromill, and the drill bit was cleaned with HPLC-grade methanol and ultrapure water before and in between sampling. Dust and powder was removed from the stalagmite surface before and between sampling, and the powdered samples from YOK-G were shipped to the laboratory at ETH Zurich in sterile microcentrifuge vials.
METHODS
Decarbonation
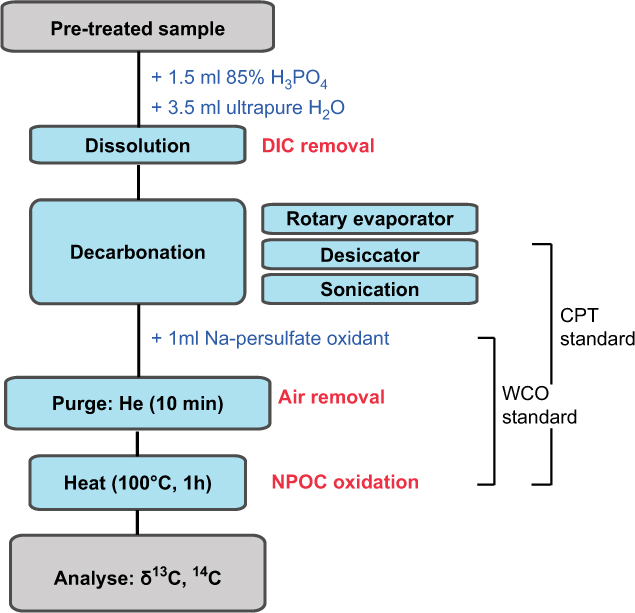
Aliquots of the powdered stalagmites were transferred to pre-combusted 12 mL borosilicate Exetainer screw-capped vials with butyl rubber septa (Labco, High Wycombe, UK). Decarbonation of the samples to remove inorganic carbonate proceeded by adding 1.5 mL of 85% H3PO4 (puriss. grade), followed by 3.5 mL of ultrapure water (18.2 MΩ and ≤ 5 ppb TOC) (Figure 2). Acid and water were added stepwise and the vials were briefly vortexed in between to ensure complete submersion of the CaCO3. The samples were then left to dissolve on the laboratory bench (room temperature: ∼ 23°C) covered with clean aluminium foil or acid-washed vial caps. Because traditional CaCO3 dissolution protocols (i.e., purging the solution with He for 5–10 min) resulted in residual inorganic carbon contributions in the final extracts (as indicated by high δ13C values, ∼ –9‰), we tested several approaches to ensure complete decarbonation of the samples. Early attempts involved subjecting the samples to gentle vacuum using a rotary evaporator, as successfully demonstrated by Blyth et al. (Reference Blyth, Shutova and Smith2013a), but this was quickly abandoned due to substantial blank contributions encountered with this method in our laboratory (supplemental Figure S1). More efficient and less detrimental methods in terms of blank contributions were (1) to place the samples in a desiccator that was evacuated using a hand-held pump for a few days while periodically renewing the vacuum, or (2) to subject the closed sample vials to sonication by placing them in an ultrasonic bath at room temperature for 30–45 min during acidification.
Flowchart describing the method. The method steps covered by WCO and chemical pretreatment (CPT) standards for blank assessment are indicated.

Wet Chemical Oxidation and Isotope Analysis
After decarbonation, organic carbon was converted to CO2 using a wet chemical oxidation (WCO) approach (described in Lang et al. Reference Lang, Bernasconi and Früh-Green2012, Reference Lang, Früh-Green and Bernasconi2013, Reference Lang, Mcintyre and Bernasconi2016, Figure 2). Briefly, sodium persulfate (Sigma, purum p.a. ≥ 99.0%, further purified by recrystallization) was added as an oxidant (1 mL; solution: 1.5g Na2S2O8 in 50 mL ultrapure water) after the decarbonation. All vials were capped and purged for ∼10 min using ultrapure helium to remove ambient air and remaining inorganic CO2 in the vials. For the oxidation to take place, the vials were then heated to ∼100°C for one hour (Figure 2). The headspace CO2 resulting from oxidation of the NPOC was analyzed for δ13C on a Thermo Delta V Plus isotope ratio mass spectrometer (IRMS) coupled with a ThermoFinnigan GasBench II carbonate preparation device at the Geological Institute, ETH Zurich, following the method described in Lang et al. (Reference Lang, Bernasconi and Früh-Green2012). δ13C values are reported as 13C/12C ratios expressed as the permil deviation from the international Vienna Pee Dee Belemnite standard (VPDB). 14C measurements were performed as described in Lang et al. (Reference Lang, Mcintyre and Bernasconi2016) using a MICADAS AMS equipped with a gas ion source (GIS) at the Laboratory for Ion Beam Physics (LIP) at ETH Zurich. AMS background correction and data normalization were carried out using the software BATS (Wacker et al. Reference Wacker, Christl and Synal2010) and 14C/12C ratios are reported as F14C according to Reimer et al. (Reference Reimer, Brown and Reimer2004).
Blank Assessment
Sucrose (Sigma, δ13C = –12.4‰ VPDB, F14C = 1.053 ± 0.003) and phthalic acid (Sigma, δ13C = –33.6‰ VPDB, F14C <0.0025) were used as standards to evaluate blank contributions from the different steps of the method. These standards were chosen for their distinct isotope signatures, which allow to capture different contamination end members, and their solubility in water (Lang et al. Reference Lang, Mcintyre and Bernasconi2016).
The contribution of extraneous carbon to the WCO was evaluated by a suite of standards (WCO standards) prepared for each run by adding varying amounts of standard solution to vials containing 5 mL of ultrapure water, then taking them through the WCO procedure. To evaluate the mass and F14C of extraneous carbon for each run, we used the model of constant contamination described in Hanke et al. (Reference Hanke, Wacker and Haghipour2017) and Haghipour et al. (Reference Haghipour, Ausin and Usman2018). The procedural blank of the decarbonation (chemical pretreatment standard) was quantified by spiking vials containing acid with variable amounts of sucrose and phthalic acid, before taking them through the entire procedure (Figure 2). The decarbonation efficiency and possible carbonate matrix effects were tested by analysing carbonate samples with no oxidant added, and/or by spiking IAEA-C1 (carbonate F14C = 0, NPOC presumed 14C-dead) samples with known amounts of standard solution. Finally, we tested whether prolonged storage of oxidised samples (three weeks) resulted in CO2 losses from leaky seals. This was achieved by preparing chemical pretreatment standards that were subsequently measured in two batches, the first one day and the second three weeks after oxidation.
RESULTS
Blank Assessment
Because of the typically low amount of extraneous carbon in WCO samples, standard curves were used to assess blank contamination in each run. Using two standards with very different F14C and δ13C values allows quantification of the amount and isotopic composition of the blank (Lang et al. Reference Lang, Mcintyre and Bernasconi2016; Hanke et al. Reference Hanke, Wacker and Haghipour2017). All runs were corrected for extraneous carbon contributions following the methodology by Haghipour et al. (Reference Haghipour, Ausin and Usman2018) for F14C and Lang et al. (Reference Lang, Bernasconi and Früh-Green2012) for δ13C (not discussed here). Both methods assume constant contamination from each method step on all samples.
Long-Term 14C Blank Assessment of WCO Procedure
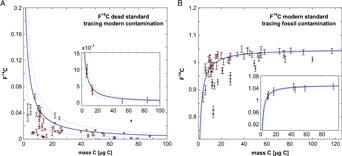
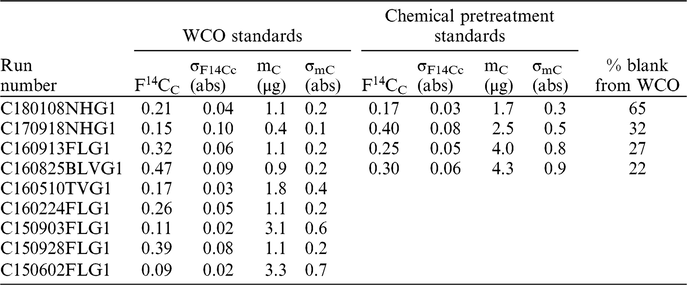
For the WCO standards (Figure 3, Table 2), the average blank contamination over all runs was 1.30 ± 0.52 μg C, F14C = 0.42 ± 0.17, when calculated with the method of constant contamination by Haghipour et al. (Reference Haghipour, Ausin and Usman2018; supplemental Table S1). However, the fluctuation in the contribution of extraneous carbon varied greatly between runs over the course of the study (2015–2018). Within a single run, contamination can be as low as 0.4 ± 0.1 μg C (F14C = 0.15 ± 0.04, run C170918NHG1). For six out of the nine runs, contamination remained below 1.15 μg C and only two runs had contamination > 3 μg C (Table 2).
Summary of all WCO standards analyzed in the course of the study. A: F14C of the 14C-dead standard, phthalic acid. B: F14C of the modern standard, sucrose. Outliers are marked in black and were not included in the calculation of the blank contribution. Inserts show values for a single measurement run. The solid blue lines represent the best fit with 1σ error ranges. All data is provided in supplemental Table S1.

Blank contamination for all AMS runs for WCO standards, as well as the chemical pretreatment standards (where available).

Chemical Pretreatment Blank
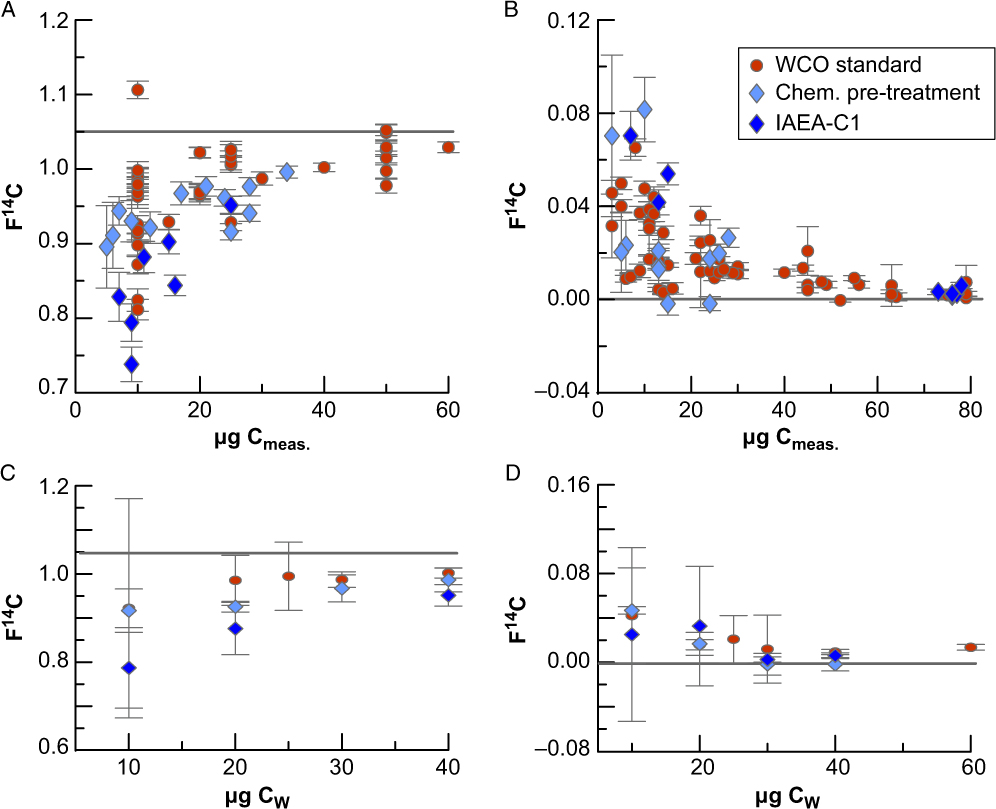
Overall, the chemical pretreatment standards show larger blank contamination than the WCO (1.7 ± 0.34 – 4.3 ± 0.86 μg C, Table 2, Figure 4), with the WCO contributing between 22 and 65% (average 37%, n = 4) of the total extraneous carbon in the samples. The F14C values between individual chemical pretreatment and WCO standards were usually within the 2σ-bound of each other, although contamination F14C values were always lower for the chemical pretreatment standards. Incomplete removal of inorganic CO2 from the sample solution proved to be one of the main challenges faced during method development. Tests on samples that were not oxidised and processed using the desiccator revealed that 23 out of 42 test vials contained small amounts of residual inorganic carbonate, with enriched δ13CCO2 values (average over all samples –8.92‰ VPDB). Sonication at room temperature also typically resulted in small (∼0.7–1.5 μg C) amounts of carbonate left in the solution. Vials containing known amounts of 14C-dead IAEA-C1 carbonate and spiked with phthalic acid show a weak correlation between the amount of carbonate added and the isotopic composition of the WCO extract (supplemental Figure S2), suggesting a possible influence of sample size on decarbonation efficiency. Loss of CO2 during extract storage due to leaky rubber septa does not appear to be an issue, as we find no significant difference between the concentration and isotopic value of sucrose and phthalic acid samples measured before and after storage.
Comparison between chemical pretreatment and WCO standards, as well as IAEA-C1-spiked procedural standards, presumed NPOC-dead. A and B: standard curves for sucrose and phthalic acid, respectively. C and D: average of the standard groups per weight class (grouped by amount of standard weighed in).

Stalagmites
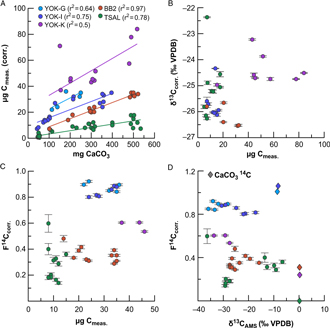
For each stalagmite, the amount of C measured is positively correlated to the initial carbonate sample size, and is fairly reproducible for different initial weights (Figure 5A, supplemental Table S2). NPOC concentrations vary greatly between stalagmites, ranging between 0.003 and 0.017 wt% (averages calculated for all samples of one stalagmite), with TSAL yielding the lowest concentrations and YOK-G and YOK-K the highest. These NPOC concentrations are within the range of previously published values for speleothems (0.01–0.3 wt%, Li et al. Reference Li, Hu and Huang2014; Quiers et al. Reference Quiers, Perrette and Chalmin2015; Blyth et al. Reference Blyth, Hartland and Baker2016;). Most stalagmite WCO extracts are depleted in 13C, with δ13C values clustering around –24 to –26‰ VPDB, values typical of C3 vegetation (Figure 5B). No clear trend in δ13C values between the different stalagmites can be discerned, and the intra-sample variability in δ13C is generally larger than the difference between samples.
Results of the stalagmite samples. A: amount of carbon (μg C) measured and corrected for procedural blanks vs. weight of CaCO3 (in mg) added to the vials for all stalagmites used in this study. Data is combined from all runs for δ13C and 14C. B: blank corrected δ13C values from IRMS vs. amount of C measured. C: F14C vs. amount of C measured. D: F14C vs. δ13C from the same AMS run. Note that the precision on AMS δ13C is ± 2‰. Diamonds denote the corresponding values measured on carbonate samples.

F14C values show no trend with sample size, and appear to be relatively consistent for the different stalagmites (Figure 5C, supplemental Table S2). TSAL, the oldest stalagmite (40 ka) also exhibits the lowest NPOC 14C activities (average F14C = 0.29), but these values are still significantly higher than the corresponding carbonate value (F14C ∼0, Figure 5D). Stalagmite YOK-K (estimated age ∼2 ka) shows a similar offset between NPOC and carbonate (NPOC F14C = 0.52, CaCO3 F14C = 0.24), whereas no difference is found between NPOC and CaCO3 in stalagmite BB2 (assumed age: 3–6 ka, NPOC F14C = 0.35, CaCO3 F14C = 0.31). For YOK-I and YOK-G (covering the bomb spike interval), the trend is reversed, with F14C values of CaCO3 higher than those of NPOC (YOK-I: NPOC F14C = 0.77, CaCO3 F14C = 1.0; YOK-G: NPOC F14C = 0.88, CaCO3 F14C = 1.01).
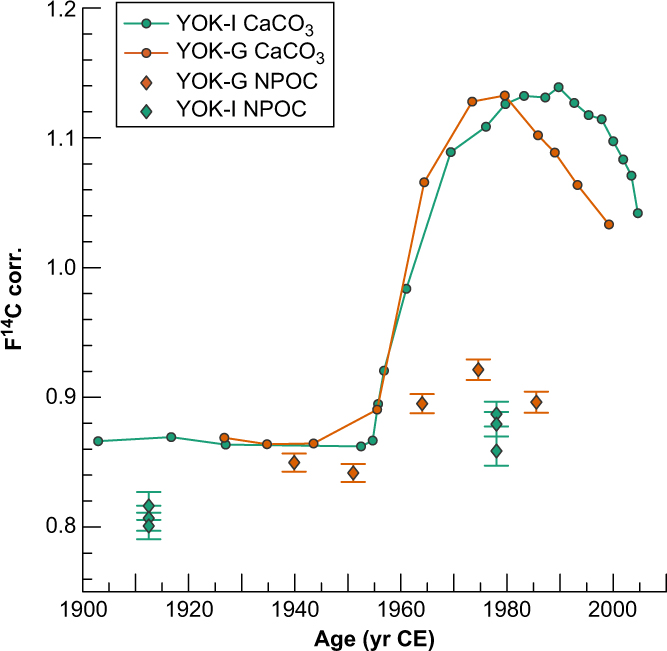
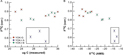
The pre- and post-bomb spike NPOC samples from stalagmites YOK-I and YOK-G both show an increase in F14C with the bomb spike (Figure 6). However, in both cases, the NPOC F14C is lower than the contemporaneous carbonate F14C. Samples from the first batch of samples from YOK-I (YOK-I A, analyzed in May 2016) have markedly lower F14C and less negative δ13C values compared to both a later analysis (YOK-I B) and to the samples of YOK-G (Figure 7).
Comparison between the bomb spike measured in stalagmites YOK-I and YOK-G carbonate with the results from WCO measurements on NPOC extracts.

Comparison of the results for stalagmites YOK-I and YOK-G. Samples from YOK-I analyzed during May 2016 (YOK-I A), likely affected by incomplete decarbonation, are highlighted by the black box.

DISCUSSION
Method Evaluation
The method described here holds promise as a fast and simple procedure to extract and isolate NPOC from carbonate samples. Extensive testing has provided encouraging results, which provide a foundation for further development and refinement of the method. One of the key advantages of the method lies in the comparatively small sample sizes required. Depending on the amount of NPOC present in a stalagmite, as little as 50 mg sample mass is required for a high-precision IRMS δ13C measurement, and 100–200 mg for an AMS 14C measurement. This is similar to amounts reported by Blyth et al. (Reference Blyth, Shutova and Smith2013a, Reference Blyth, Smith and Drysdale2013b) for δ13C, and paves the way for conducting high-resolution studies of isotopic variations in NPOC from stalagmites. Additionally, the simple procedure, conducted entirely in one single vial, greatly reduces the risk of laboratory contamination, considered a major problem for studies of organic matter in stalagmites (Wynn and Brocks Reference Wynn and Brocks2014). Indeed, the contamination on single runs with this method can be as low as 0.4 ± 0.1 μg C (F14C 0.15 ± 0.04), which greatly improves confidence in the interpretation of NPOC δ13C and 14C signatures even on very small samples (<10 μg C). Due to blank fluctuations, we recommend measuring a complete standard curve, ideally with 5 or more standards for both end members, with each sample run. Moreover, it appears that the sucrose standard is very susceptible to degradation once in solution, and future tests should investigate the use of an alternative modern standard with similar specifications (e.g., oxalic acid).
Lowest blank contributions are typically obtained using freshly prepared standard solutions and oxidant (re-precipitated using ultra-pure water). The chemical pretreatment standards tend to have slightly lower F14C compared to the WCO standards (but the difference is not significant), which could point towards a minor blank contribution from the chemicals used or from the rubber septa. Although previous studies did not report blank issues related to these method specifications (Lang et al. Reference Lang, Bernasconi and Früh-Green2012, Reference Lang, Früh-Green and Bernasconi2013, Reference Lang, Mcintyre and Bernasconi2016), future studies should investigate how the much larger volume of acid needed for this method might influence overall blank contributions (e.g., Blyth et al. Reference Blyth, Farrimond and Jones2006). Storage times of up to three weeks do not result in significant changes in the amount and isotopic value of carbon measured, which would be expected if the rubber septa were leaking. However, we still recommend swift analysis of prepared extracts, ideally within a few days of the oxidation (but allowing enough time for solution re-equilibration after sample heating, i.e., ∼24 hr), to achieve best results. Finally, prolonged storage of powdered carbonate samples should be avoided, as sorption of extraneous carbon on carbonate is common (Stipp and Hochella Reference Stipp and Hochella1991). Both stalagmites YOK-I and YOK-G were sampled shortly (hours–days) before analysis, and therefore we do not expect sorption effects to play a major role.
Confidence in the results presented here stem from (1) steadily increasing NPOC concentrations with increasing sample size, suggesting that the carbon extracted is likely inherent to the sample, and not introduced by external background contamination, and (2) NPOC δ13C values that are consistent with organic biomass, most likely reflecting carbon sources from terrestrial (C3) vegetation or microbial activity. However, our results show significant variability, both within replicate NPOC samples, as well as in the relationship between NPOC and CaCO3 values. This is likely the result of variable matrix effects as a function of sample type, as well as in some cases incomplete decarbonation. We discuss these issues further below.
Decarbonation Efficiency
Ensuring the complete removal of inorganic carbon proved to be the most difficult step of the method development. Subjecting the samples to a weak vacuum or to sonication was often successful in removing all CaCO3 from the solution, but the efficacy of the method still has reproducibility issues, especially for some stalagmites (e.g., TSAL). Decarbonation using rotary evaporation was the only method that reliably removed all CaCO3 from solution in all tested stalagmites, but in our case introduced large blanks, probably from the oil pumps (supplemental Figure S1). However, this should not discourage others from further tests using a rotary evaporator, as this is the standard technique for DOC analysis of aquatic samples, and can often be employed successfully (Bryan et al. Reference Bryan, Meredith and Baker2017). The other methods tested (desiccator and sonication) have the advantage of allowing a much higher throughput of sample batches compared to the rotary evaporator, an essential attribute if the method is to be applied to high-resolution studies. In this study, reproducibility and decarbonation efficiency were assessed by analysing chemical pretreatment standards and carbonate samples without oxidant. This approach, albeit time and resource consuming, allows to assess contamination and decarbonation individually, ideally for each run, and is advantageous for cases where method reproducibility is problematic.
Quantification of the amount of inorganic carbon in the NPOC extracts remains difficult, because the amount and isotope value of the organic “end member” is not known. A simple isotopic mass balance can be carried out:
 $${{\rm{A}}_{\rm{m}}} \times {{\rm{\delta }}^{13}}{{\rm{C}}_{\rm{m}}} = {\rm{ X}} \times {{\rm{\delta }}^{13}}{{\rm{C}}_{{\rm{ic}}}} + {\rm{ }}\left( {{{\rm{A}}_{\rm{m}}} - {\rm{ X}}} \right) \times {{\rm{\delta }}^{13}}{{\rm{C}}_{{\rm{oc}}}}$$
where Am and δ13Cm are the measured amount and δ13C of carbon in the samples, δ13Cic is the δ13C of the inorganic carbon, δ13Coc is the δ13C value of the organic end member. X is the amount of inorganic carbon. We assume that the OC is entirely derived from C3-plants, a good approximation for all the caves studied here, resulting in an organic end member δ13C value of –25‰ VPDB. For stalagmite YOK-K, which shows the most consistent δ13C values for NPOC (Figure 5B), mass balance reveals that about 1.2–4 μg C are likely CaCO3-derived, which amounts to 2–11% of the original CaCO3 remaining in the solution. For the other stalagmites, the scatter between different measurements is much larger, and it is not straightforward to calculate the amount of CaCO3 remaining in the solution. This shows that complete removal of residual inorganic carbon from the samples remains a challenge, with implications for the fidelity of isotopic values measured in NPOC. Residual carbonate can also be detected in the IAEA-C1 vials spiked with phthalic acid (supplemental Figure S2), where larger samples display lower F14C and less negative δ13C values, suggesting incomplete decarbonation. This was confirmed by tests using the IAEA-C2 standard (F14C = 0.41, δ13C = –8.25‰ VPDB, not shown).
Combined δ13C and 14C datasets can help distinguish, and thus exclude, compromised samples. For example, samples from YOK-I batch A (YOK-I A, analyzed in May 2016) have markedly lower F14C and higher δ13C values compared to both a previous analysis and to the samples of YOK-G (Figure 7). These results suggest that the YOK-I A samples are affected by incomplete decarbonation, and thus should be excluded from further interpretation. Similarly, TSAL proved to be an especially difficult stalagmite to achieve complete decarbonation, which might point towards an inherent matrix effect that is more pronounced in this stalagmite than in others (supplemental Figure S3). More detailed studies of mineralogy and microstructure (e.g., through X-ray diffraction or scanning electron microscopy) in the samples should be encouraged in future studies, to better characterize the sample matrix.
Significance for Interpretation of NPOC in Stalagmites
The pronounced bomb spikes found in the carbonate of stalagmites YOK-I and YOK-G (Figure 6) suggests that the majority of carbon transferred to the cave is cycled rapidly, and no large reservoir of pre-aged carbon is present. Previously published results on 14C analysis of water extractable organic carbon (WEOC) from soil samples collected above Yok Balum Cave reflect the dominant contribution of very young OC from the soil, with 96% of the soil carbon being less than 50 years old (Lechleitner et al. Reference Lechleitner, Baldini and Breitenbach2016). This is likely a function of the shallow thickness of the host rock above the cave (∼14 m), and the rapid response of the active drips to increases in rainfall (peaks during large rainfall events, and a general increase in drip rate over the rainy season; Ridley et al. Reference Ridley, Asmerom and Baldini2015), which lead to rapid surface-to-cave signal transfer and minimize input from deeper carbon sources within the host rock. Compared to the test stalagmites from mid-latitude sites (BB2 and TSAL), the Yok Balum Cave stalagmites have higher concentrations of NPOC, which might additionally point towards a faster carbon transfer at this tropical location (Figure 5A).
The NPOC F14C from stalagmites YOK-I and YOK-G shows good agreement with the progression of the bomb spike rise in the carbonate of both stalagmites (Figure 6). Compared to the carbonate F14C however, the NPOC signal is significantly dampened and overall F14C is much lower. This is somewhat counterintuitive, as one would expect the carbonate, affected by dissolution of 14C-dead host rock carbon (e.g., Hodge et al. Reference Hodge, Mcdonald and Fischer2011), to be more depleted with respect to the vegetation-derived NPOC F14C. At this preliminary stage, methodological issues, such as an unaccounted contamination source or stripping of more volatile (and potentially younger) molecules during purging (Lang et al. Reference Lang, Butterfield and Schulte2010, Reference Lang, Mcintyre and Bernasconi2016) cannot be entirely ruled out. However, our extensive blank assessment, and the fact that the chemical pretreatment standards are not significantly different from the WCO standards, suggest that our results are robust, and that the signal is likely real. One way to explain the difference between NPOC and carbonate 14C signatures in stalagmites YOK-I and YOK-G is through a contribution of OC from a refractory (insoluble and non-hydrolyzable) pool that is not sourced from the soil. This could be related to mobilization of a deep organic carbon source in the karst, as previously recognised in other karst systems (Benavente et al. Reference Benavente, Vadillo and Carrasco2010; Noronha et al. Reference Noronha, Johnson and Southon2015; Mattey et al. Reference Mattey, Atkinson and Barker2016; Bergel et al. Reference Bergel, Carlson and Larson2017). Although these studies focused on the presence of elevated pCO2 deeper in the karst that contribute carbon depleted in 14C to the drip water solution, it is also possible that refractory organic compounds are transported to the cave from such a source. Similarly, organic matter produced in situ (on the cave walls or on the stalagmites themselves) by microbial communities has been suggested as an important source of OC in stalagmites (Blyth et al. Reference Blyth, Jex and Baker2014; Tisato et al. Reference Tisato, Torriani and Monteux2015; Lechleitner et al. Reference Lechleitner, Dittmar and Baldini2017), and could be responsible for the divergence between inorganic and organic carbon in stalagmites. A third potential source of refractory carbon in the karst system is fossil OC leached from the bedrock carbonate rock itself, e.g., through partial microbial oxidation. Such “petrogenic OC” can have a measurable impact on bulk F14C values, e.g., in rivers (Galy et al. Reference Galy, Beyssac and France-Lanord2008; Bouchez et al. Reference Bouchez, Beyssac and Galy2010; Hemingway et al. Reference Hemingway, Hilton and Hovius2018), and has previously been identified as an important component of some speleothem OC (Gázquez et al. Reference Gázquez, Calaforra and Rull2012). One challenge to these explanations is the inverse trend found in stalagmite YOK-K, where the carbonate 14C is older than the NPOC, which might point towards contamination from a modern OC source during sampling, given that this is the sample with the highest NPOC concentrations tested here.
At present, our dataset does not allow a more definitive attribution of a single process (or a combination of several processes) that can explain the contrasting behavior of inorganic and organic carbon in the stalagmites. It should be noted, however, that a previous study seeking to characterize the molecular spectrum of the dissolved organic matter (DOM) at Yok Balum Cave found very different molecular compositions of soil and drip waters, and stalagmites, with the stalagmite DOM fingerprint suggesting a contribution from microbial organic matter (Lechleitner et al. Reference Lechleitner, Dittmar and Baldini2017). Irrespective of these unresolved issues, it is clear that at Yok Balum Cave, OC entrapped within stalagmites derives from one or several dynamic pool(s). Whether stalagmites from other locations (e.g., high latitudes) exhibit similar characteristics, both in the magnitude and cycling of organic matter, remains to be seen.
CONCLUSIONS
We present first results from a method development study on extraction and isotopic (δ13C and 14C) characterization of speleothem NPOC. The advantages of the method lie in its simple, rapid protocol that is carried out in a single vial, minimizing the potential for contamination through laboratory procedures, and in the small sample sizes needed. Encouraging results indicate that the extracted carbon is likely inherent to the sample and organic, as shown by depleted δ13C values. However, unresolved issues remain, and need to be addressed by future studies to fully make use of the method. A major remaining issue is incomplete sample decarbonation, resulting in biased isotope values. Although anomalous samples can be detected via combined δ13C and 14C analyses, further methodological improvements are needed before the method can be made routine. Complete decarbonation was so far achieved only when subjecting the samples to a weak vacuum using a rotary evaporator. Unfortunately, this method had to be abandoned as it resulted in contamination of the samples from the oil pump. Sonication appears to be a promising tool to increase decarbonation efficiency, with the advantage of working on a closed vial and thus minimizing contamination, but needs to be tested more thoroughly. Sample contamination through laboratory procedures need to be minimized, as this method is very susceptible to blank effects. Ideally, a designated “clean” fume hood should be used for this method only, and in any case work producing large amounts of dust should not be carried out in the same room as the decarbonation and wet oxidation procedure. The sucrose standard appears to be very susceptible to alteration, and might be better replaced by another compound with modern F14C and similar δ13C (e.g., oxalic acid).
Subsequent studies that further improve upon methodologies and expand measurements to a broader suite of stalagmites and their host cave systems should add important new constraints on carbon cycle processes in karst systems and organic signals preserved in stalagmites. Moreover, detailed investigations on organic and inorganic carbon fluxes in karst systems and the isotopic fingerprint of processes acting on them could provide important insights into the local carbon cycle and the sources of carbon in speleothems.
SUPPLEMENTARY MATERIAL
To view supplementary material for this article, please visit https://doi.org/10.1017/RDC.2019.35.
ACKNOWLEDGMENTS
We thank the staff at LIP, especially Lukas Wacker, and Daniel Montluçon, Stewart Bishop and Madalina Jaggi at the Geological Institute, ETH Zurich for their assistance with sample analysis. We thank José Mes for assistance during fieldwork at Yok Balum Cave. We gratefully acknowledge Sebastian Breitenbach, Denis Scholz, and Birgit Plessen for provision of sample materials from stalagmites BB2 and TSAL. We thank Andy Baker and Kathleen Johnson for critical reviewing of this manuscript, and the editorial team at Radiocarbon for manuscript handling. This research was supported by the European Research Council grant 240167 grant to JULB, and by Swiss National Science Foundation grant P2EZP2_172213 to FAL. Field collection was supported additionally by the National Science Foundation (grant HSD 0827305) and the Alphawood Foundation.