INTRODUCTION
The Kura-Araxes (KA) culture refers to a material “package” that is considered distinctive of communities that spread throughout the Southern Caucasus between the second half of the 4th and the beginning of the 3rd millennium BC (Chataigner and Palumbi Reference Chataigner and Palumbi2014; see also Kohl Reference Kohl1995, Reference Kohl2007; Kushnareva Reference Kushnareva1997; Palumbi Reference Palumbi2008). The internal chronology of the KA culture has been traditionally divided into three phases—KA I, KA II, KA III—based on typological changes detectable within the material package. Pottery classes, in particular, are regarded as the main diagnostic trait of each KA cultural phase, with Monochrome Ware (MW) typical of phase KA I, the extensive use of Red and Black Burnished Ware (RBBW) distinctive of phase KA II, and the diffusion of incised Black Burnished Ware (BBW) characteristic of phase KA III (Sagona Reference Sagona1984; Palumbi Reference Palumbi2008; Chataigner and Palumbi Reference Chataigner and Palumbi2014). Broad changes in the architecture and metallurgy also contribute to this tripartite chronocultural subdivision, although not without numerous inconsistencies due to a wide diachronic and synchronic regional variability within these KA material expressions (Sagona Reference Sagona1984, Reference Sagona1993; Kushnareva Reference Kushnareva1997; Kohl Reference Kohl1995, Reference Kohl2007; Palumbi Reference Palumbi2008; Chataigner and Palumbi Reference Chataigner and Palumbi2014).
Currently, the definition of the absolute chronological outlines of the KA cultural phases still constitutes a challenge within the archaeology of the Southern Caucasus, owing to the lack of a substantial corpus of reliable radiocarbon dates anchored to secure stratified archaeological contexts, as well as of complete excavated site sequences. In recent years, these lacunae have started to be filled through the application of tailored and up-to-date research methodologies, which produced new reliable data on the KA culture in the framework of systematic archaeological investigations. Among these, the excavations at Aradetis Orgora by the joint Georgian-Italian Shida Kartli Archaeological Project (Gagoshidze and Rova, in press Reference Gagoshidze and Rovaa, Reference Gagoshidze and Rovab) yielded evidence of well-stratified KA levels that allowed for the application of a vertical 14C dating strategy, thus constituting a first step towards the redefinition of the KA absolute chronology in the Shida Kartli region of Georgia. This article presents the 14C dating results of the KA sequence at Aradetis Orgora, including a detailed report on the strategy adopted for the study, from field sampling to final chronocultural interpretations.
THE SITE AND ITS STRATIGRAPHY
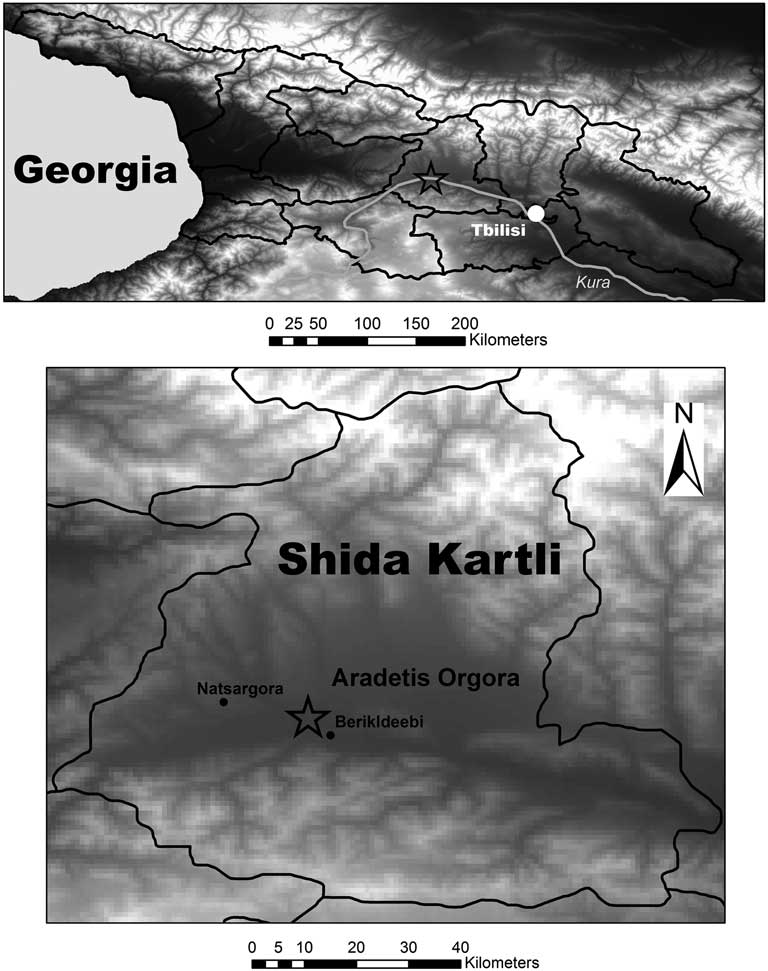
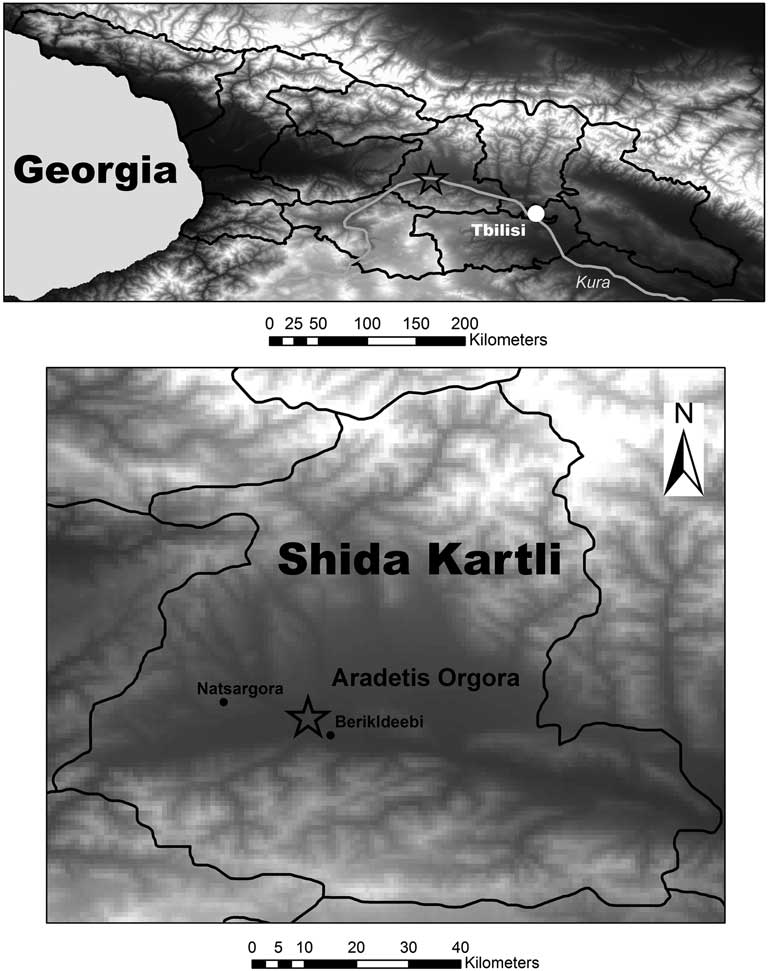
The site of Aradetis Orgora is located in the district of Kareli, on the left bank of the Western Prone River, not far from the confluence with the Kura (Figure 1). The main mound—also known as Dedoplis Gora—is roughly triangular in shape with very steep sides, with an approximate length of 70–80 m and standing 34 m in height from the present level of the river, which has eroded most of its southern slope. Since 1926, the site has been repeatedly investigated by Georgian teams. In particular, an archaeological project devoted to the investigation of the Late Hellenistic–Early Imperial palace on top of the main mound has been led since 1985 by Prof Iulon Gagoshidze of the Georgian National Museum (Furtwängler et al. Reference Furtwängler, Gagoshidze, Löhr and Ludwig2008). According to previous excavations, the thickness of the site’s cultural sequence amounted to a maximum of 14 m, as visible in the section of the eroded SW side of the mound. The sequence includes remains of the Late Chalcolithic, Early Bronze, Late Bronze, Early Iron, Hellenistic, Roman Imperial, and Early Medieval periods.
Map showing the location of Aradetis Orgora (ASTER GDEM is a product of METI and NASA).
In 2009, a preliminary visit of the site was undertaken by a team from the Ca’ Foscari University of Venice (Italy). Evidence for Kura-Araxes and Bedeni occupations was observed on the exposed section produced by river erosion on the southwestern slope of the mound (Gagoshidze and Rova, in press Reference Gagoshidze and Rovaa). Following this discovery, and alongside archaeological evidence unearthed elsewhere in the Aradetis area—such as the presence of Bedeni pits on the Aradetis Orgora northern mound and the, already known, Bedeni settlement at the neighboring site of Berikldeebi (Jalabadze Reference Jalabadze2014)—it was decided to propose to the Georgian authorities to investigate the preclassical sequence at the site (Gagoshidze and Rova, in press Reference Gagoshidze and Rovab).
Since 2013, Aradetis Orgora has thus been the object of excavations by the Georgian-Italian Shida Kartli Archaeological Project, under the auspices of the Ca’ Foscari University of Venice in collaboration with the Georgian National Museum of Tbilisi. So far, three excavation seasons have been completed at the site. The material discussed in this article was discovered in the course of the first two campaigns (16 June–31 July 2013, and 16 June–2 August 2014).
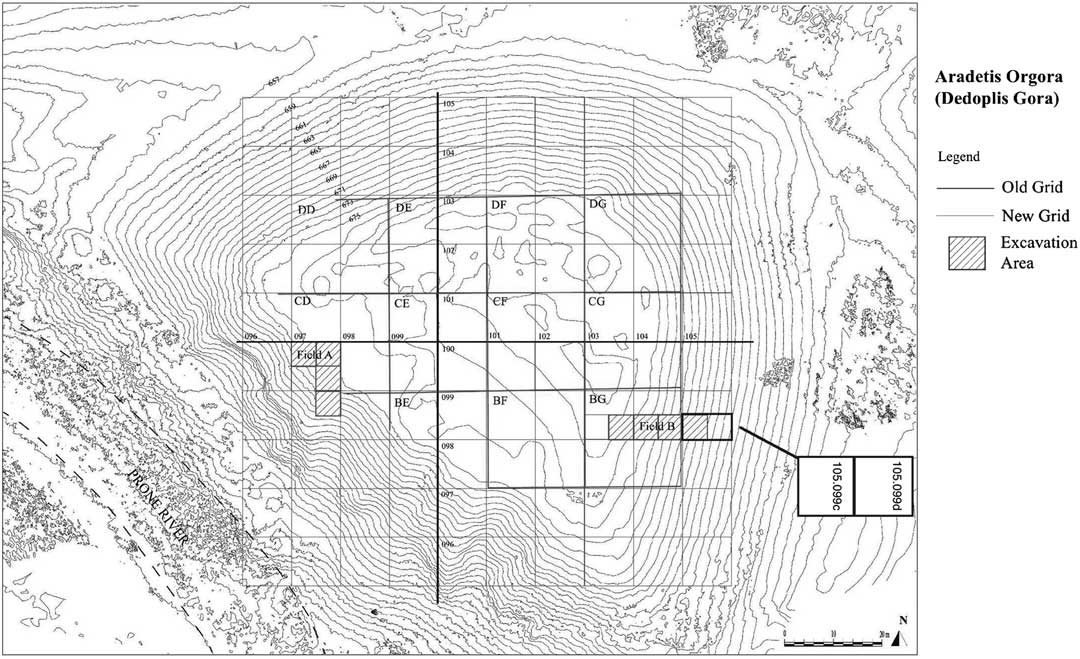
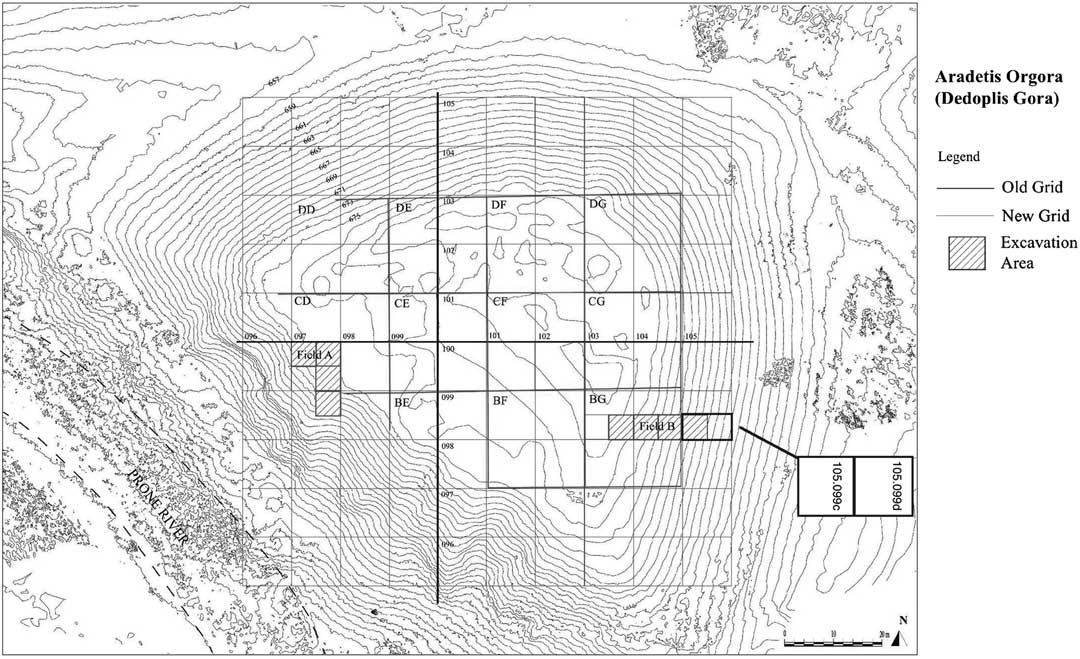
Excavations focused on two different soundings (Field A and Field B, Figure 2) that were initiated on opposite—western and eastern—sides of the mound.Footnote 1 Field A is located on the southwestern slope of the mound, where the eroded section had already yielded evidence for KA and Bedeni occupation. The hitherto excavated sequence of the sounding has been provisionally divided into 10 levels, which cover the Hellenistic period (Level 1), the Iron Age (Levels 2–4), the Iron Age–Late Bronze transition (Levels 5–7), and the Late Bronze Age (Levels 8–10). The Early Bronze levels have unfortunately not yet been reached. Field B is located on the southeastern side of the mound. A sequence spanning from the Hellenistic to the end of the Late Chalcolithic periods has been excavated there from the present top of the mound down to the natural soil.
Contour map of the Aradetis Orgora mound with excavations areas highlighted: the new excavation grid (Georgian-Italian expedition) in black, and the old excavation grid (Georgian excavations) in red (online version) (©Georgian-Italian Shida Kartli Archaeological Project). The quadrants that yielded KA remains are highlighted in the bottom right.
KURA-ARAXES OCCUPATION
Stratified archaeological remains related to the KA culture have been uncovered thus far only in Field B, on the southeastern side of the mound, although the preliminary exploration of the western slope in 2009 revealed the presence of KA and Bedeni materials, which suggest the probable presence of stratified occupation related to these periods also in Field A. Considering that excavations in this area have hitherto only reached the LB occupation, no stratigraphic evidence for the KA and post-KA occupation is yet available from the western side of the mound. Nonetheless, a sample for 14C dating was collected from this sector (RTK-6134), namely in association with Kura-Araxes ceramic sherds, at what appeared to be the base of the site’s anthropic sequence.
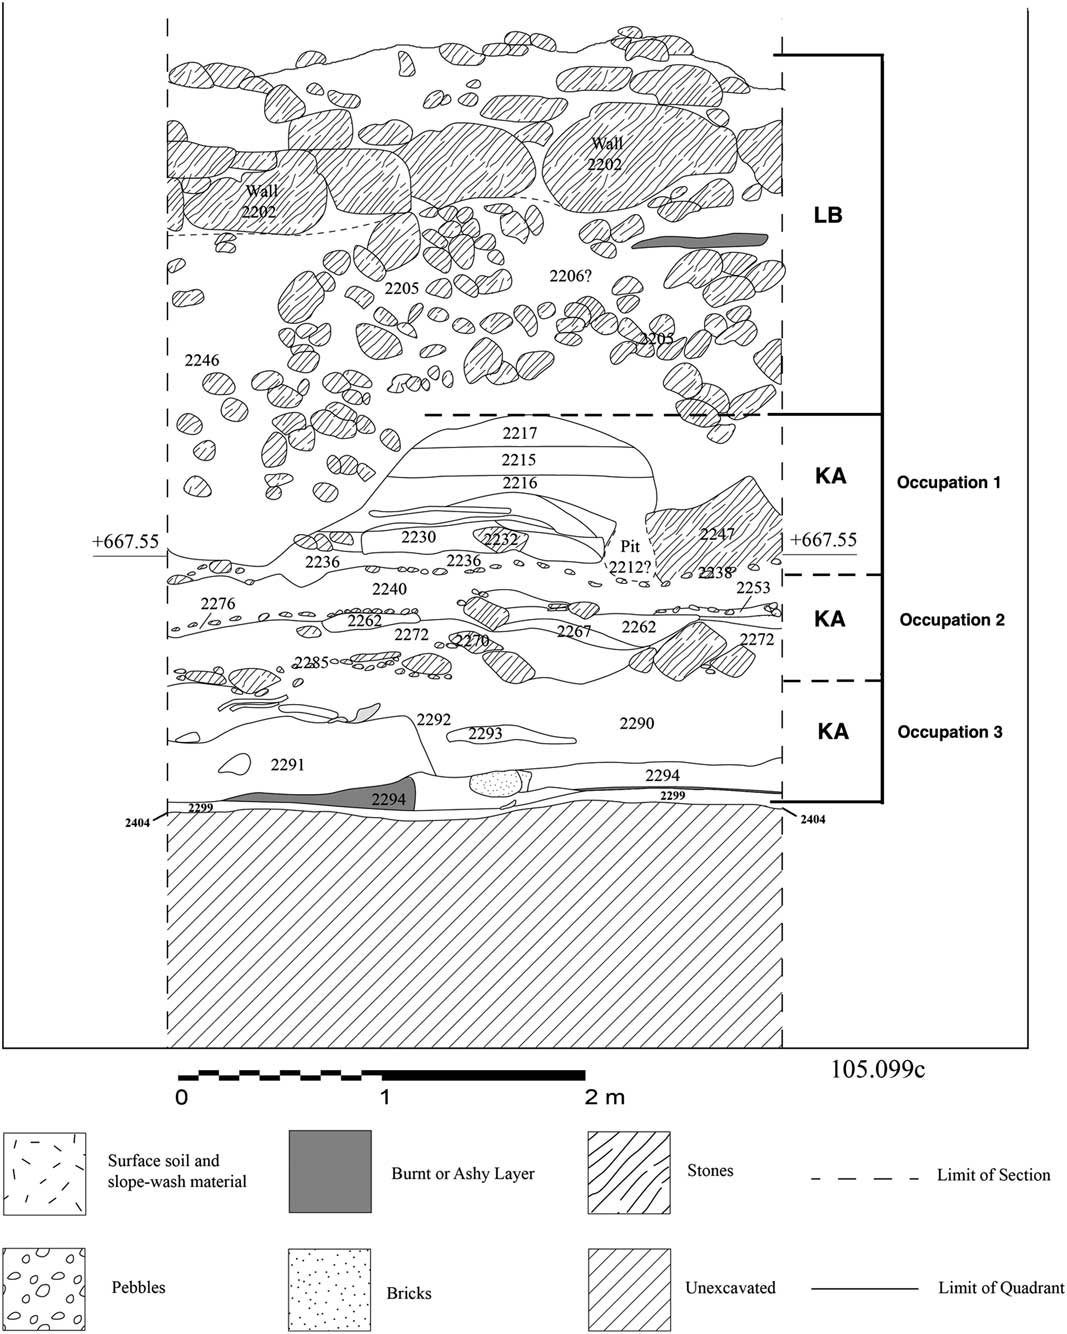
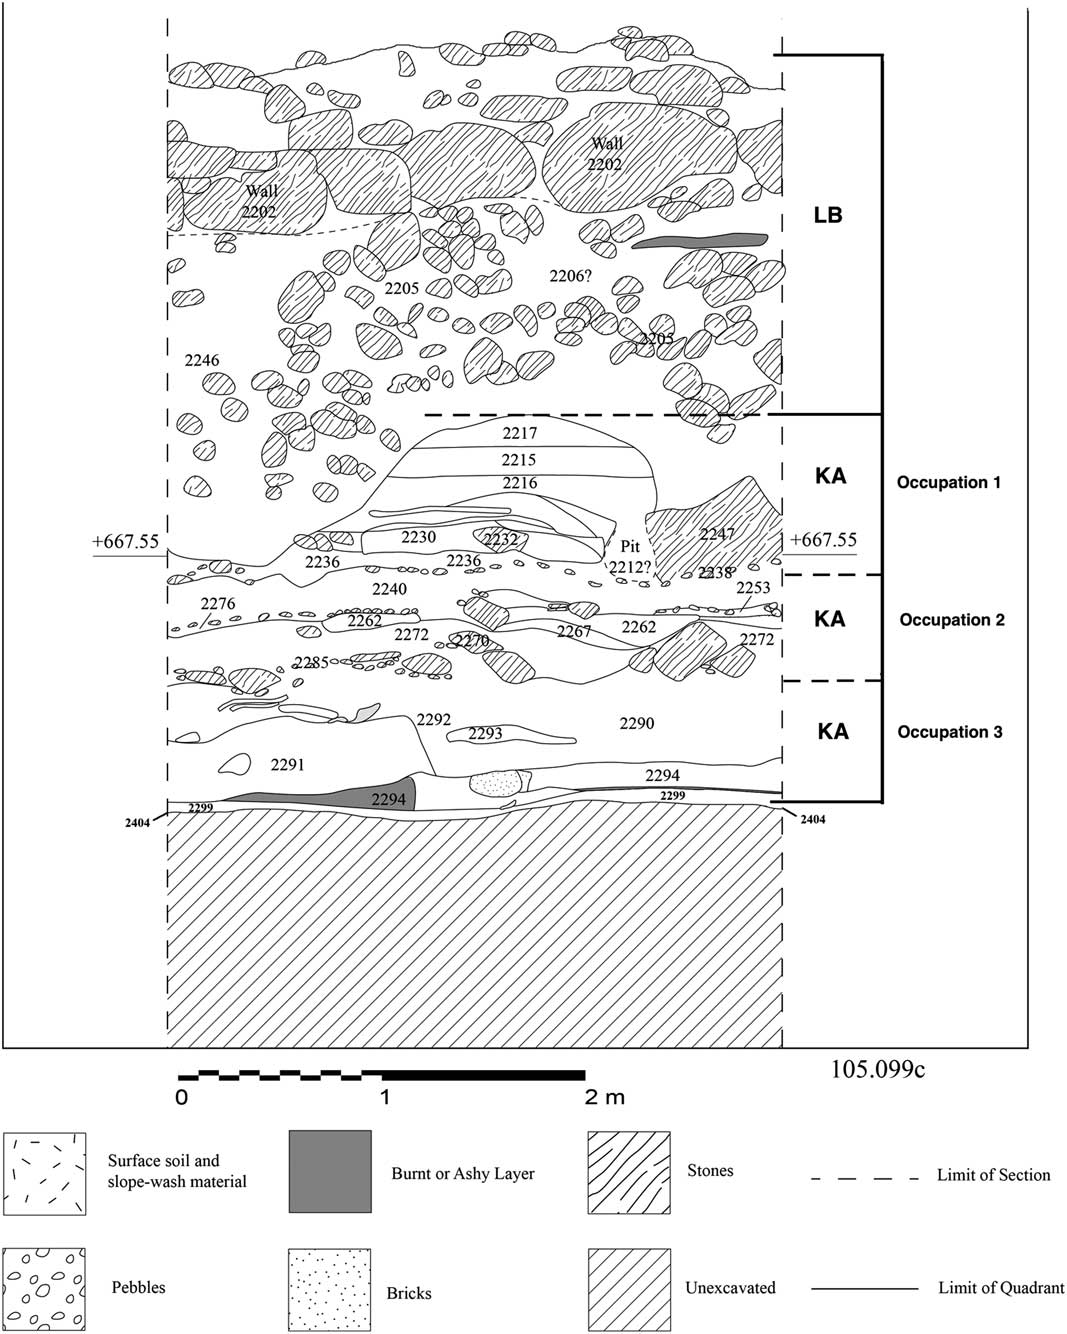
In Field B, remains belonging to the KA occupation were uncovered in quadrant 105.099c, corresponding to the fourth “step” of the trench, under the surface of an ancient slope of the mound (locus 2215). Later LB structures were built on, and partially cut into, this surface, which in its turn sealed the KA deposits. In total, three KA phases of occupation were distinguished in this quadrant (Figure 3). A fourth KA occupational stage was uncovered in quadrant 105.099d, corresponding to the fifth “step” of the trench, under a thick layer of pebbles (loci 2302 and 2303) that covered the continuation of the ancient surface of the mound (here locus 2311), as previously observed in quadrant 105.099c. It rests on the natural soil, and thus represents the earliest occupation in this part of the mound; it is separated by the third stage by ~80 cm of occupational layers, which by the end of the 2014 excavation season were still unexcavated.Footnote 2
Quadrant 105.099c, section W with indication of Kura-Araxes occupation (©Georgian-Italian Shida Kartli Archaeological Project).
KA Occupation, Phase 1
The latest level of the KA sequence consists of a series of thin horizontal layers. The topmost portion of the sequence was made of two layers (loci 2219, 2217) of compacted clay sitting on top of a poorly preserved surface (locus 2216), whose composition is akin to the material that characterized the poorly preserved remains of wattle-and-daub structures (loci 2220 and 2221), which were found underneath. A roughly rectangular plan was recognized in the spatial disposition of these structures. Locus 2222 was distinguished in the space delimited by the two structures and might be interpreted as the remains of their associated floor. Below these remains, an occupation marked by the presence of two rectangular spaces delimited by mud-brick structures (loci 2224, 2225, 2230, 2231, 2232) was detected. This architectural occupation was laid on a white-plastered surface (locus 2236), underlain by a floor of small pebbles (locus 2238). Layer 2238 was underlain in its turn by a layer of whitish clay (2240), within which poorly preserved remains of pisé walls (2242 and 2243) were discovered, followed by a series of stone alignments whose function has not yet been clarified.
KA Occupation, Phase 2
The second KA occupation phase is characterized by the presence of a round clay structure (space 2287), which cut into another earlier building (space 2288) of similar shape. The later structure (2287) was located in the southern portion of the excavated area; it was delimited by a clay wall (2277), which was preserved to a height up to 30 cm in the southern section. A line of vertical flat stones (2264) was found leaning to the northern part of the outer face of wall 2277. The floor (locus 2271) associated with the space was laid on a preparation layer of pebbles (locus 2285); faint traces of a later floor (2278) were also discovered. The fragmentary remains of a fireplace (locus 2284) can possibly be connected with floor 2271.
The earlier structure, space 2288, had a similar layout, and was also equipped with a fireplace (locus 2283). Floor 2275, associated with the space, probably corresponds to the replacement of a previous floor (locus 2279).
KA Occupation, Phase 3
Following the removal of these structures, a layer of collapsed material covering the whole excavated surface of the quadrant was revealed (locus 2290). Despite the fact that no architectural remains were found in this intermediate level, typical KA materials—in particular a one-handle carinated jar of RBBW production and a small flint spearhead—were recovered in it. Finally, layer 2290 was underlain by a destruction horizon related to a firing event (locus 2294). The latter, which was uncovered over the whole surface of the excavated area, was characterized by the consistent inclusion of charcoals, ash, and fragments of fired daub that probably derive from the collapse of KA wattle-and-daub structures. Additionally, an installation of unclear function was surrounded by a high ring of clay (locus 2295) and cut through layer 2294.
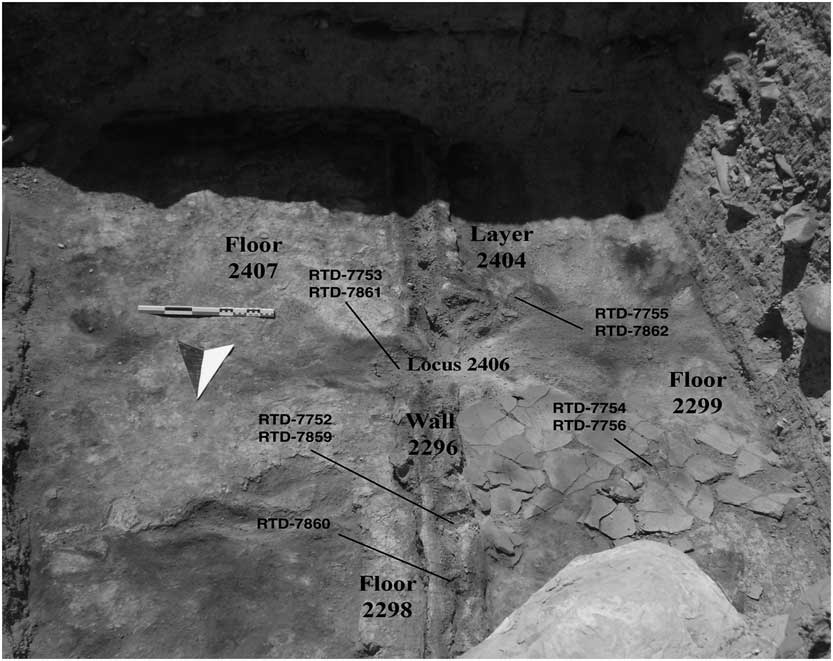
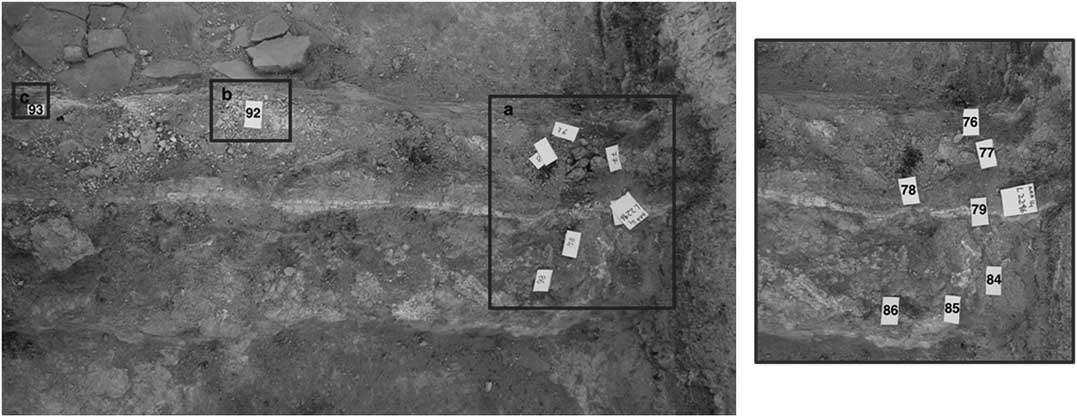
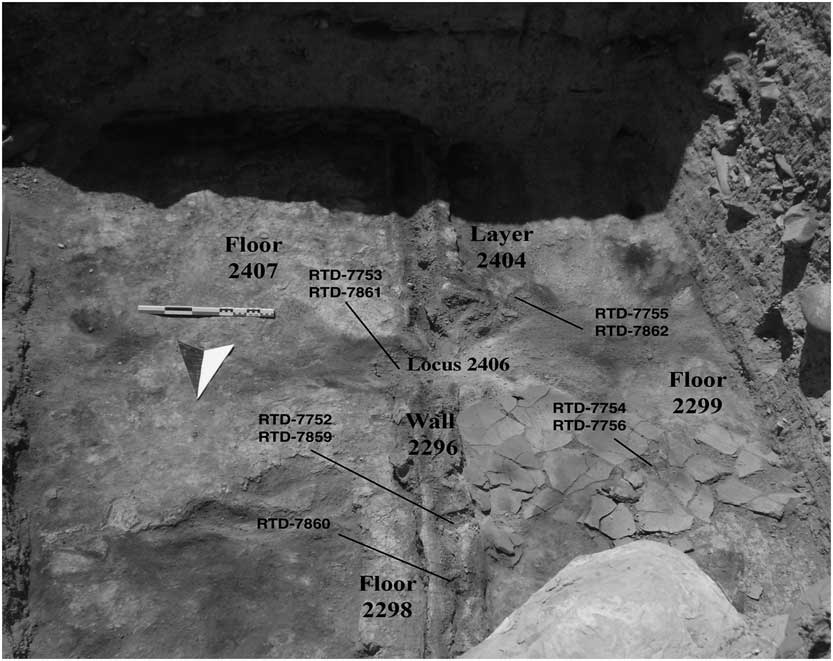
The third KA occupation phase yielded the remains of structures with rectilinear walls (Figure 4). In particular, the excavations led to the identification of two walls (loci 2296 and 2401) built using the wattle-and-daub technique. A series of well-preserved small wooden posts set at a regular distance within their structure was observed. A further, larger post-hole (locus 2406) was detected in between the two walls. East of the walls, two floors made of compacted whitish clay were distinguished: the first (locus 2407) represented the original floor of the space and the second (locus 2298) is likely a subsequent repair. West of the walls, a floor with similar features (locus 2299), leaning against wall 2296, was identified. The damaged state of the floor revealed another underlying burnt horizon (locus 2404), which represents the lowest level reached in the quadrant thus far.
Field B, quadrant 105.099c. View of the phase 3 KA occupation from the north with an indication of the location of related 14C samples (photo by the author, ©Georgian-Italian Shida-Kartli Archaeological Project).
KA Occupation, Phase *4Footnote 3
The lowest portion of the sequence in Field B was excavated in quadrant 105.099d. Remains representing the fourth and earliest KA occupation discovered in this part of the sounding were preserved under the ancient surface of the mound (2311), which was sealed by a thick layer of pebbles (loci 2302 and 2303) that yielded mixed pottery, mainly of LB date.
A large platform (loci 2312–2314) made of compacted brownish clay was attributed to this phase. Its top and sides were coated by a layer of whitish plaster showing successive repairs, whose surface was in turn overlain by a series of ashy deposits (loci 2309 and 2315). No evidence for the presence of architectural structures was found, except for a row of small post-holes on top of the surface of the latest platform (locus 2312), and a row of larger post-holes on top of the surface of the earliest platform (locus 2314). The base of the Field B sequence was reached in this quadrant: it was represented by a thin layer of small pebbles (locus 2318–2323) sitting on top of the natural soil, under platform 2314.
Material Culture Associated with the KA Occupation
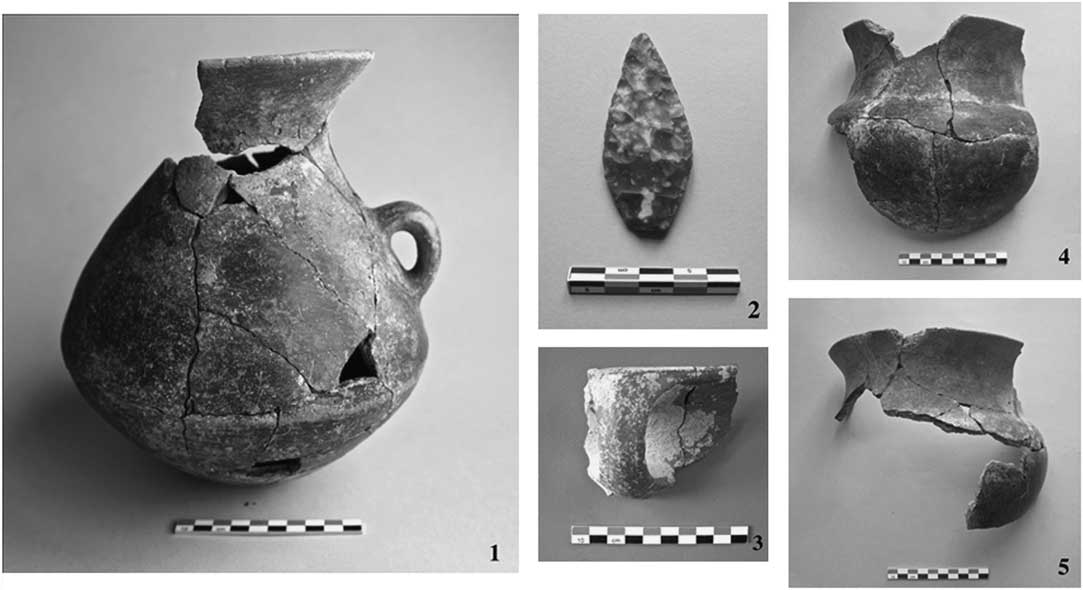
All the KA levels revealed in quadrant 105.099c yielded material and architectural features typical of the KA II phase. The first sherds of RBBW were recovered from loci 2221, 2222, and 2223 (phase 1). Ceramics from these contexts are highly fragmented; the most diagnostic element is represented by a KA handle from locus 2221 (Figure 5: 3). Sherds of RBBW were recovered from the contexts (loci 2253, 2266, 2281) overlying spaces 2287 and 2288. Unfortunately, no specific artifacts were found in association with occupation phase 2 (structures 2287 and 2288). However, given their stratigraphic position—in between two phases, 1 and 3, which are qualified by typical KA II materials—an attribution to the KA II phase is by extension applicable to phase 2.
(1) Complete RBBW vessel from locus 2290; (2) flint arrowhead from locus 2290; (3) KA handle from locus 2221; (4, 5) almost complete profiles of RBBW vessels from locus 2298 (©Georgian-Italian Shida Kartli Archaeological Project).
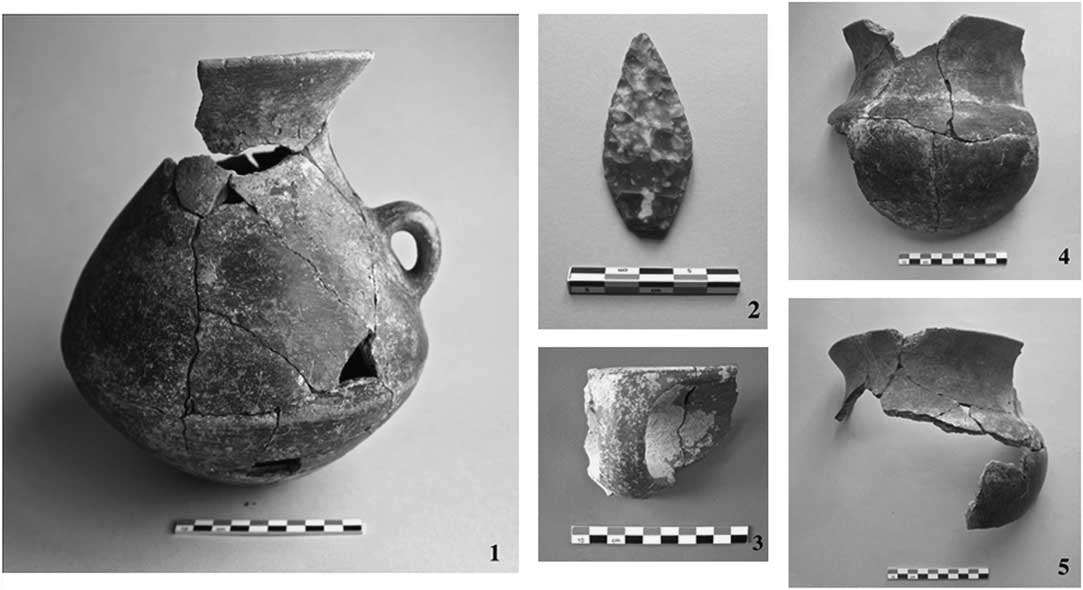
Underneath, the excavations of the debris belonging to layer 2290 revealed the presence of a complete in situ RBBW vessel (Figure 5: 1), which, however, could not be related to any architectural occupation. Numerous red flint implements and a typical KA spearhead were also recovered from locus 2290 (Figure 5: 2).
The most relevant items are those revealed during the excavations of occupation phase 3 (Figure 4), which is marked by well-defined architectural features. A structure could be recognized as delimited by rectilinear walls (2296 and 2401), built in a wattle-and-daub technique that has several parallels with KA II and KA III sites in the Shida Kartli region. In particular, the insertion of wooden posts at a regular distance inside the wall structure has specific equivalents at the site of Kvatskhelebi (Javakhishvili and Glonti Reference Javakhishvili and Glonti1962 in Palumbi Reference Palumbi2008; Sagona Reference Sagona1993; Rova Reference Rova2014). Floor 2298, associated with this structure, yielded almost complete profiles of in situ RBBW vessels (Figure 5: 4, 5), while a large KA jar was found collapsed on floor 2299. Finally, a typical RBBW lid was recovered in situ from layer 2308 in quadrant 105.099d, associated with occupation phase *4.
14C DATES FROM THE KA OCCUPATION AT ARADETIS ORGORA
In total, 17 14C dates are available for the KA occupation of Aradetis Orgora. The first 14C date (RTK-6134) was obtained on an undetermined charcoal collected from the exposed section on the western side of the mound, where KA in situ floors and materials were identified (Gagoshidze and Rova, in press Reference Gagoshidze and Rovab). Since the charcoal was gathered on the occasion of the preliminary visit of the site in 2009, it is not tied to a stratigraphically defined archaeological context and can thus only provide an indicative chronological term for what is, probably, the beginning of the KA occupation within the sequence of Field A (Gagoshidze and Rova, in press Reference Gagoshidze and Rovab).
The opening of the actual excavations allowed the completion of a more focused 14C sampling linked to a documented stratigraphic sequence. In particular, two dates were measured on undetermined charcoals collected from occupation phase 1, which was uncovered during the 2013 season in quadrant 105.099c. These were sampled from loci 2217 (RTD-7524) and 2222 (RTD-7525). During the 2014 season, 11 dates were obtained from occupation phase 3 and three dates were obtained from occupation phase *4.
Specific aspects of the sampling, treatment, and interpretation of the 14C results of the samples collected in 2014 are here presented in the form of a case study on 14C dating methods and their reliability with relevance to archaeological questions. A first-hand analysis was carried out by the first author in the framework of a Master’s thesis at Ca’ Foscari University of Venice (Passerini Reference Passerini2015). The work was undertaken at the Kimmel Center for Archaeological Science and the D-REAMS laboratory of the Weizmann Institute, involving aspects of the pretreatment process of materials selected for 14C analysis and the microscopic evaluation of their contexts of provenance. 14C dates that were obtained from KA levels sampled in 2009 and in 2013 are also reported (together with the 2014 results, see Table 2) and included in the chronological reading proposed for the KA occupation at the site.
Strategy for Collection of Samples for 14C Dating
The strategy followed during the field collection of materials for 14C dating consisted of several steps, according to the type of context. The steps encompassed the following:
-
1. Qualitative description of context and documentation in the field;
-
2. Collection and labeling of 14C samples in aluminum foil;
-
3. Collection of sediments associated to the 14C samples;
-
4. Collection of sediments, as control, around the archaeological features that provided the 14C sample.
The methodology followed in the laboratory was aimed at characterizing the context and the state of preservation of the 14C sample, and at assuring the quality of the 14C sample after chemical pretreatment for the final 14C determination. Such a methodology is based on the application of Fourier transform infrared analysis (FTIR), whose use, principles, and results are presented below. In addition, all charred remains were botanically identified in order to determine possible issues due to the “old wood” effect.
Samples and Their Archaeological Contexts
The samples for this study were collected from quadrants 105.099c and 105.099d, which revealed the only KA remains excavated so far at the site. In quadrant 105.099c, samples were hand-picked from occupation phase 3, comprising two burnt destruction horizons (the upper locus 2294 and the lower locus 2404). The remains in between were those of the floors associated with walls 2296, which yielded in situ KA II material. In quadrant 105.099d, samples related to occupation phase *4 were collected from the western section at the end of the excavations.
Locus 2294 corresponds to a burnt horizon and is characterized by reddish to yellowish and brownish colors compatible with the results of clay firing within a medium-scale firing temperature. Numerous inclusions of ash and charcoals could be observed, as well as fragments of fired daub that constitute the body of the layer. The latter probably derived from the collapse of the wattle-and-daub structures whose base was found beneath 2294. Layer 2294 is cut by installation 2295, consisting of a circular ring of very hard clay, which might belong to a later reoccupation of the area following the destruction event. Samples for 14C analysis included three pieces of charcoal (#27, #31, #61) collected directly from the layer and two (#58 and #59) selected from on-site dry sieving. Six samples of sediments (#23, #24, #25, #26, #30, #60) were collected from spots of different colors for FTIR analysis of the context.
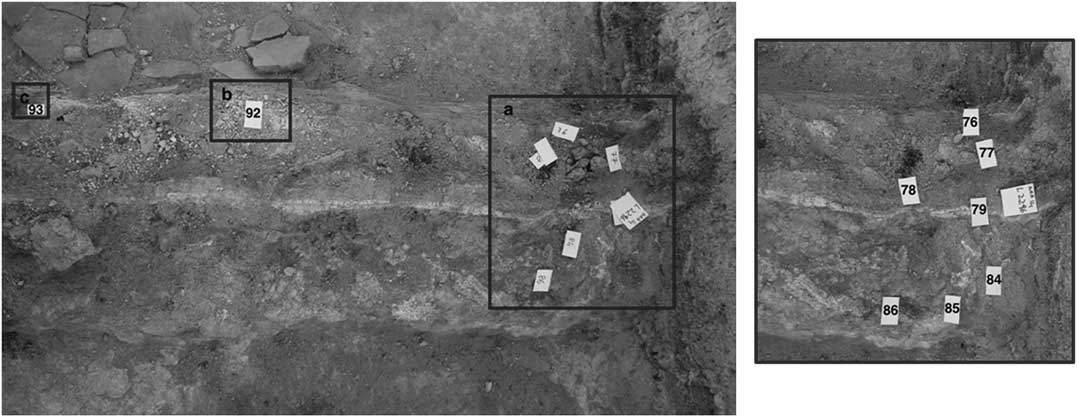
Locus 2296 (Figure 6) corresponds to a rectilinear wall structure built using the wattle-and-daub technique with insertions of wooden posts at a regular distance. The preserved status of the wall seems to be compatible with exposure to a medium-scale firing event. Samples for 14C dating were collected from two posts, whose tree-ring structure was still distinguishable. This allowed a selective sampling on different groups of rings, which were separated into external (#73a, #74a, #74b), middle (#73b, #74c), and central (#73c, #74d) sections. A further charcoal (#86) was collected from the surface of the wall. Four samples of the construction material (#76, #77, #78, #79) and four from the deposits along the external side of the wall (#84, #85, #92, #93) were collected for FTIR analysis.
Field B, quadrant 105.099c. Detail of the sampling of wall 2296 (©Georgian-Italian Shida Kartli Archaeological Project).
Locus 2299 corresponds to a plastered floor leaning on wall 2296. Remains of a very large smashed KA jar were found in situ sitting on top of the floor. Three samples were collected for 14C analysis. A sample of seeds (#72) was collected from the surface of 2299, but its relation to the context is not secure and its provenance might be intrusive, deriving either from material falling from the section, or from the mound’s surface. Two charcoals (#116, #118) were collected from under the KA vessel.
Locus 2401 corresponds to the second rectilinear wall built using the wattle-and-daub technique. Like 2296, the wall presented insertions of wooden posts whose structure, however, was much less preserved than in the previous case. Four samples of the construction material (#87, #88, #89, #90) were selected for FTIR analysis.
Locus 2404 corresponds to a burnt horizon and is the lowest layer as yet uncovered in quadrant 105.099c. The layer is only visible in areas where 2299, which covers it, is damaged. It is made of soft material of reddish and yellowish color, also related to a firing event. A single charcoal (#117) was collected for 14C dating.
Locus 2406 corresponds to the post-hole located in-between walls 2296 and 2401. The three-ring structure of the wooden post allowed a selective sampling of external (#75a), middle (#75b), and central rings (#75c).
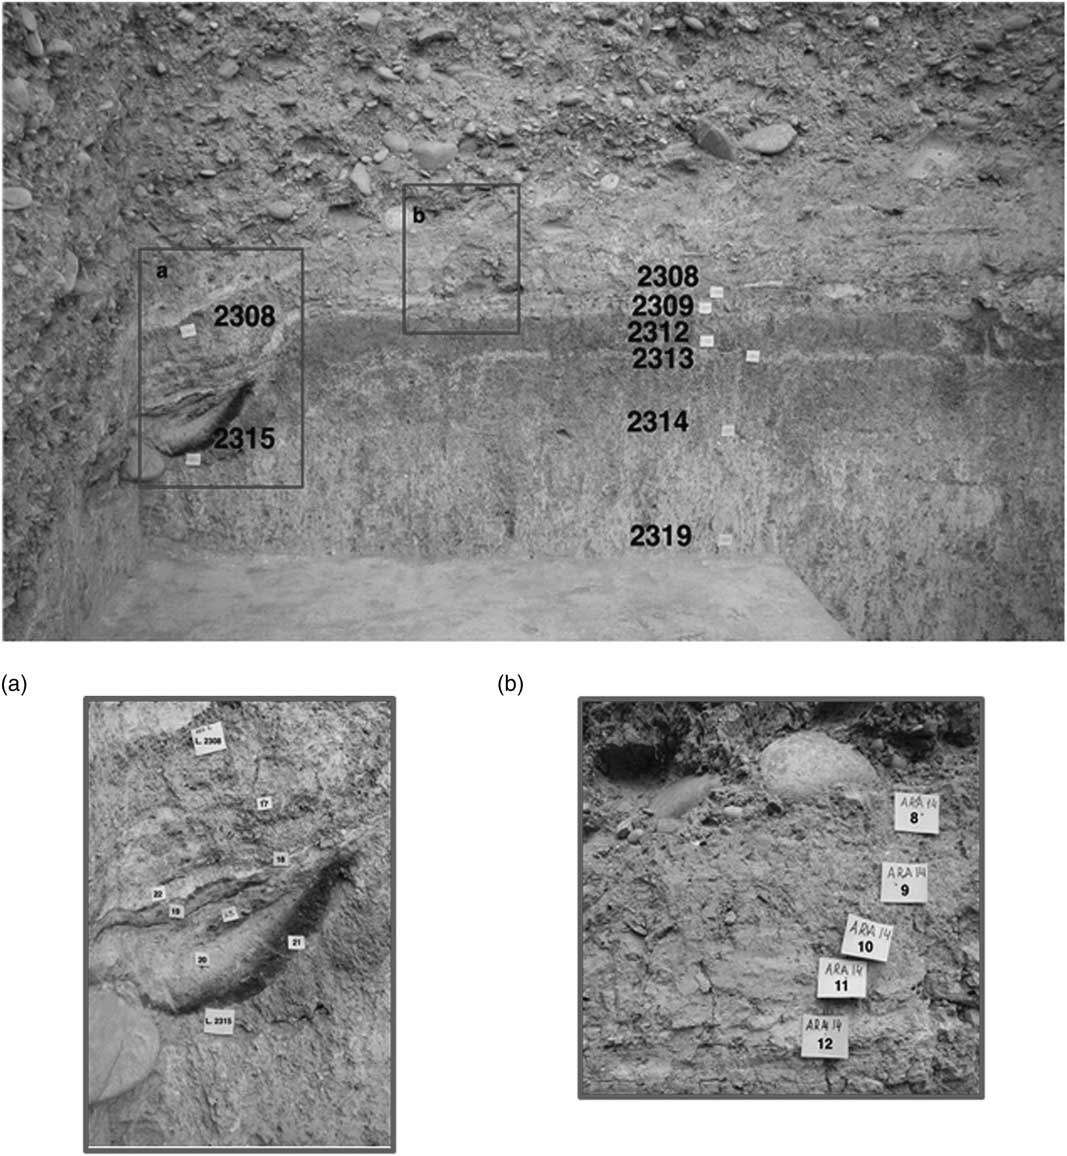
Locus 2308 (Figure 7) corresponds to a layer composed by a series of thin ash deposits on top of platform 2312. The ashes display different nuances of whitish, grayish, yellowish, and black color. Four samples of sediments (#8, #9, #10, #11) were collected from this locus for FTIR analysis. A single charcoal (#17) of short-lived species (Pomoideae undet.) was collected for 14C dating.
Field B, quadrant 105.099d. Detail of sampling of loci 2308 and 2315 from the western section.
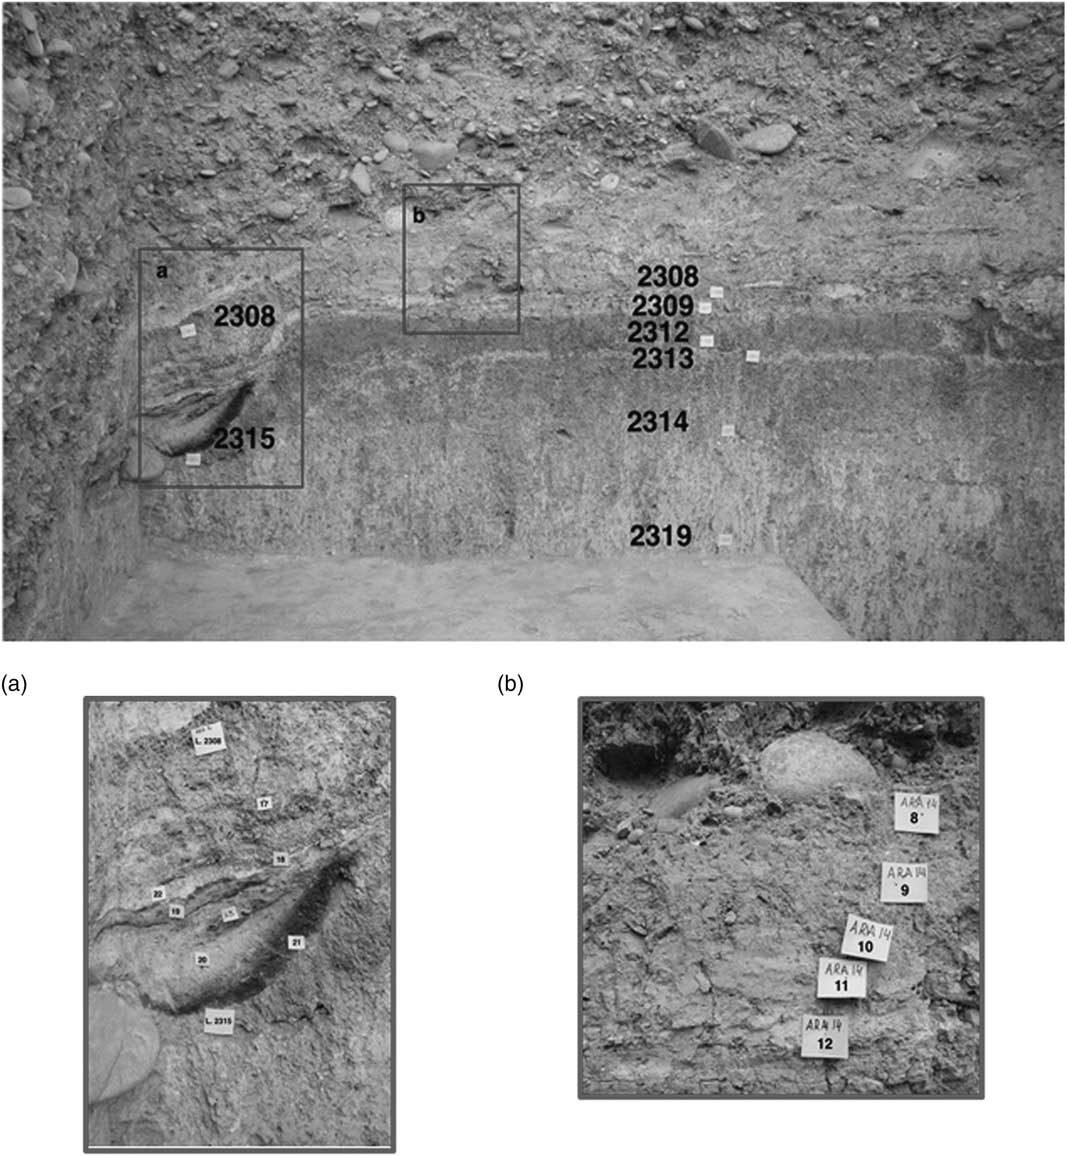
Locus 2315 (Figure 7) corresponds to a sequence of supposed ash layers of different colors spanning from grayish to brownish, yellowish, and black. Its uppermost deposit corresponds to the bottom of locus 2308, while its lower part leans to the side of the earliest version of platform 2312 and is covered by the plaster of its latest version. Five samples of sediments (#19a, #19b, #20, #21, #22) were collected for FTIR analysis. Seeds (#18 Triticum aestivum/durum) were collected from the section for 14C dating.
MATERIALS AND METHODS
Botanical Identification
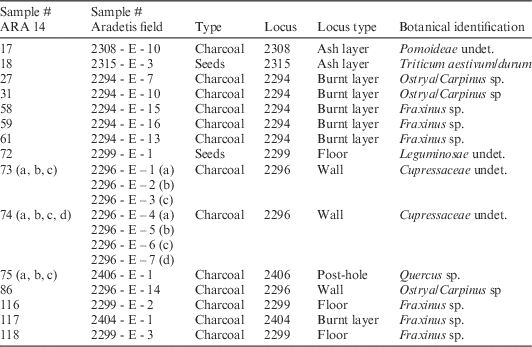
The samples were botanically identified by Dr Valentina Caracuta (Max Planck-Weizmann Center for Integrative Archaeology and Anthropology, Weizmann Institute of Science) by using a metallographic microscope (Nikon Eclipse LV150N, 100-500X magnification). The identification of charcoals took place after microscopic observations of their transversal, tangential, and radial sections. The correlation between diagnostic features observed and species was performed following Schweingrüber (Reference Schweingrüber1990) and by reference to the collection of the 14C laboratory D-REAMS. In total, seven species were identified (Table 1). The identification of botanical species served as an additional criterion of selection for 14C dating due to the distinction between long-lived and short-lived species.
Botanical identification of samples collected for 14C dating from quadrants 105.099c and 105.099d.
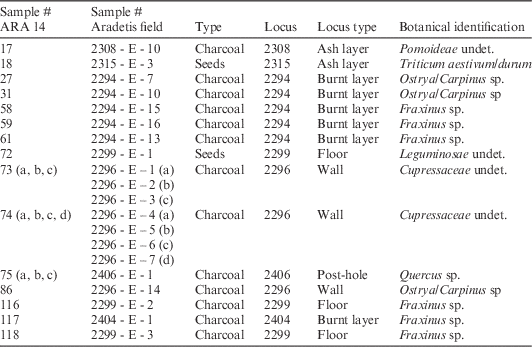
Unfortunately, all the samples—except for #17, #18, and #72—derive from four long-lived species (Ostrya/Carpinus, Fraxinus, Cupressaceae, Quercus), thus making the selection more challenging with regards to the impact of old-wood effect. From locus 2294, two samples of charcoal (#31 and #61), one for each species represented in the context (Ostrya/Carpinus and Fraxinus), were selected. From locus 2299, two charcoals of Fraxinus species (#116 and #118) sealed by the KA jar found in situ were chosen over short-lived seeds (Leguminosae undet.), due to the insecure provenance of the latter. From locus 2296, charcoal from the external tree rings of the posts (#73a and #74a, Cupressaceae undet.) was preferred. The same choice was made for locus 2406 (#75a, Quercus sp.). Both samples from 2308 (#17, Pomoideae undet.) and 2315 (Triticum aestivum/durum), from short-lived species, were selected.
Fourier Transform Infrared Analysis
FTIR analysis was performed for two specific purposes. The first consisted in the prescreening of charcoals and seeds in order to check their preservation and the actual absorbance of organics/minerals within the sample (Yizhaq et al. Reference Yizhaq, Mintz, Cohen, Khalaily, Weiner and Boaretto2005). The same method was then applied after the pretreatment in order to verify the absence of clay in the residual material that should have been eliminated following the pretreatment protocol (Yizhaq et al. Reference Yizhaq, Mintz, Cohen, Khalaily, Weiner and Boaretto2005). All steps were essential to prove the efficiency of the 14C pretreatment procedure, whose main goal is to isolate the original material preserving original 14C atoms and to eliminate intrusive 14C atoms that might have resulted from the interaction of the sample with the environment at large (Boaretto Reference Boaretto2007, Reference Boaretto2009).
Secondly, FTIR was used for the analysis and description of the archaeological context from which samples were collected, in order to obtain information on the microenvironment in which the samples were found. The results helped to corroborate the macroscopic interpretation that was given to the archaeological context thanks to the acquisition of microscopic information on the composition of the context. This operation aims at identifying a “dating assemblage,” which is composed by components that are the result of a unique depositional process (Boaretto Reference Boaretto2015). For instance, charred seeds and charcoals from a context that is rich in burnt phytoliths, ash, and heated clay can be regarded as the product of an in situ burning event, thus providing a date that is directly related to that stratigraphic event (Boaretto Reference Boaretto2015).
In both applications, a few milligrams of the sample were homogenized and powdered in an agate mortar and pestle. Approximately 0.2 mg of ground material were left in the mortar and mixed with ~40 mg of KBr (FTIR-grade) before being pressed into a 7-mm pellet. The pellet was made using a manual hydraulic press (Specac). Infrared spectra were collected in the laboratory using a Nicolet 380 (Thermo) at 4 cm–1 resolution.
The results of FTIR analysis are provided as a spectral signature that is diagnostic of each organic or inorganic compound. In the graph, each absorption peak reflects a local network of atoms, with the major functional groups in the region 4000–300 cm–1. The identification of the compounds has been done by comparison with the database of spectra of the Kimmel Center for Archaeological Science. The results of the FTIR analyses will be presented alongside the 14C dating results.
Radiocarbon Dating: Preparation and Analysis
The samples were collected by hand from squares 105.099c and 105.099d (Field B). Only two samples (#17 and #18) were collected a posteriori from the section. All the samples were subjected to a prescreening stage by using FTIR in order to verify the actual organic concentration in the samples and the gradient of clay contamination coming from the sediments of provenance. Subsequently, the acid-alkaline-acid (AAA) protocol was performed on both charcoals and seeds in order to remove clay contamination (Yizhaq et al. Reference Yizhaq, Mintz, Cohen, Khalaily, Weiner and Boaretto2005; Rebollo et al. Reference Rebollo, Cohen-Ofri, Popovitz-Biro, Bar-Yosef, Meignen, Goldberg, Weiner and Boaretto2008).
The AAA protocol consists of a standardized series of steps. Normally, eight samples were treated at the same time. Initially, between 100 and 200 mg of material were weighed and homogenized. In a glass centrifuge, 5 mL of 1N HCl were added to the sample material and left for 1 hr. After total dissolution of the carbonate fraction, the sample was centrifuged (3000 rpm for 3 min) and rinsed with nanopure deuterium-depleted water (DDW) three times until pH=6 was reached. To extract humic substances, 3 mL of 0.1N NaOH for 30 min was added. The centrifuge tube was covered with aluminum foil in order to reduce the intrusion of modern CO2. Samples were then centrifuged at 3000 rpm for 7–10 min. The quantity of humic substances was then checked and described according to a color criterion measured with values between +5 (very dark) and +1 (transparent). If the color was still too dark after one treatment, another NaOH cycle was applied for 30 min. On the whole, three times NaOH is in general sufficient to remove the humic substances. Once a value of +1 or +2 (humic substances presence) was obtained, samples were washed and centrifuged with nanopure water until pH=7 was reached.
After water removal, 3 mL of 1N HCl were added in order to remove possible modern CO2 contamination that occurred during the NaOH treatment. The samples were then positioned in a water cup/bath heated to 80°C and left there for 1 hr. Finally, samples were centrifuged and rinsed until pH=6 or 7 was again reached. The last stage consisted in placing the samples loosely covered with aluminum foil in a 105°C oven overnight. Once dried, the efficiency (Eff%) of the materials was calculated by comparing their final and initial weight.
The AAA pretreatment was followed by the oxidation at 900°C and graphitization process. The oxidation of the sample material to CO2 comprises combustion inside vacuum-sealed quartz tubes with 200 mg of CuO at 900°C for 3 hr. The CO2 is then transferred into a quartz tube with 1 mg of cobalt as catalyst. At 700°C with continuous removal of water formed during the process by a Peltieri cooling system, the reduction of CO2 into graphite takes place in about 18 hr. The amount of CO2 obtained gives the percentage of carbon (C%) in the pretreated sample material. The samples were then pressed at 180 psi into aluminum cathodes. The final measurement of 14C concentration was performed by accelerator mass spectrometry (AMS) at the Dangoor Research Accelerator Mass Spectrometer. 14C dates are reported in 14C yr BP (before present=1950) in accordance with the established international convention (Stuiver and Polach Reference Stuiver and Polach1977). All the dates were calibrated using OxCal v 4.2.4 (Bronk Ramsey and Lee Reference Bronk Ramsey and Lee2013) and the IntCal13 atmospheric curve (Reimer et al. Reference Reimer, Bard, Bayliss, Beck, Blackwell, Bronk Ramsey, Buck, Cheng, Edwards, Friedrich, Grootes, Guilderson, Haflidason, Hajdas, Hatté, Heaton, Hoffman, Hogg, Hughen, Kaiser, Kromer, Manning, Niu, Reimer, Richards, Scott, Southon, Staff, Turney and van der Plicht2013).
RESULTS
Archaeological Contexts
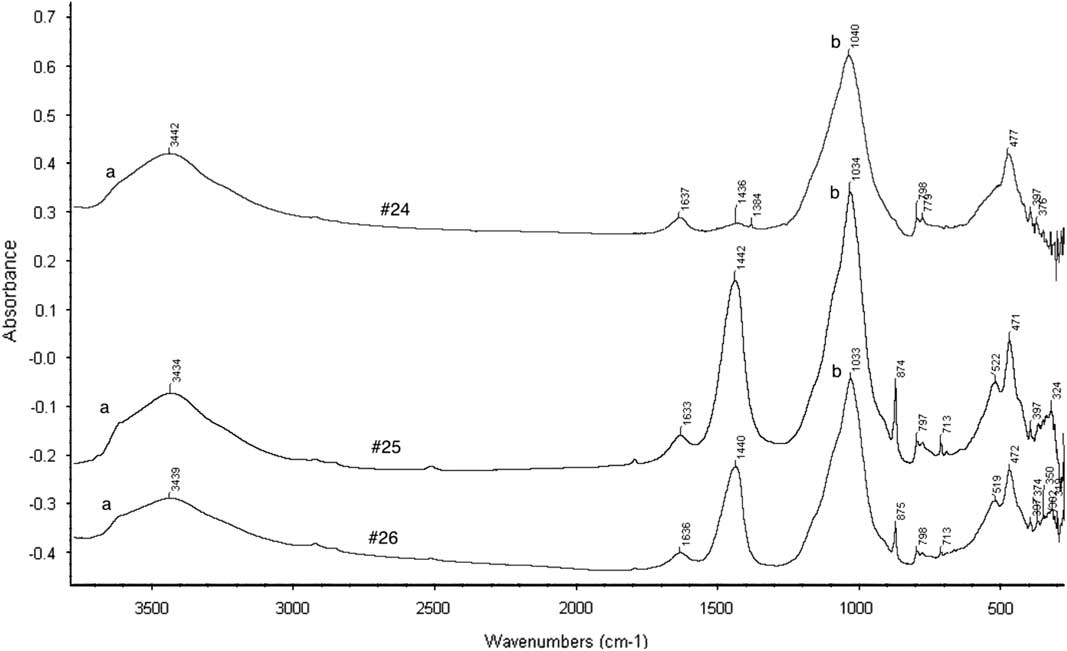
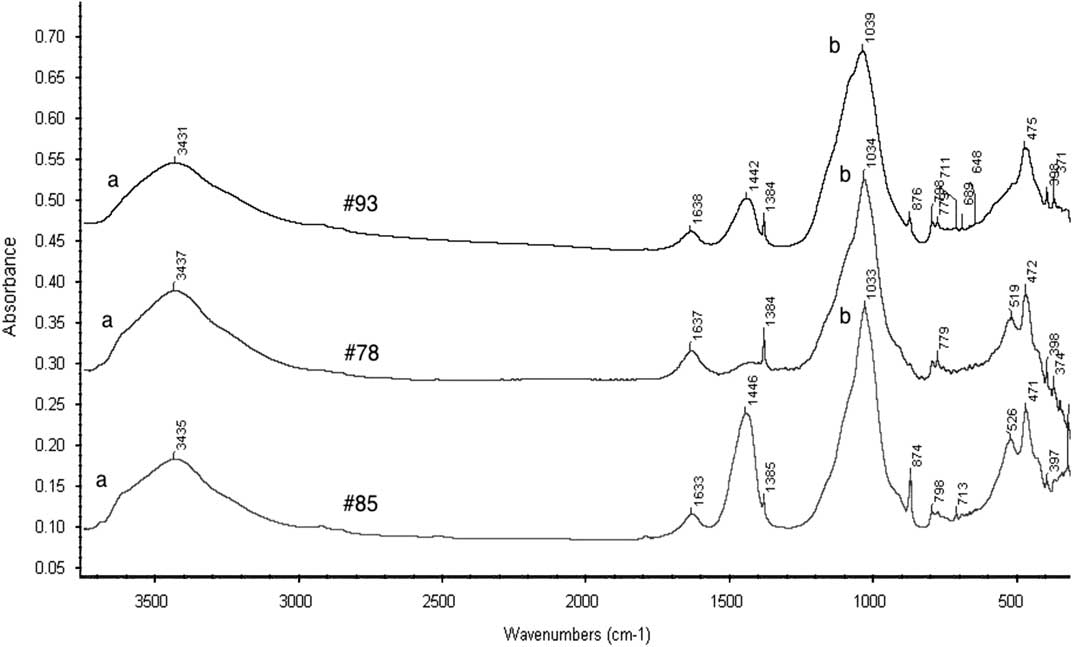
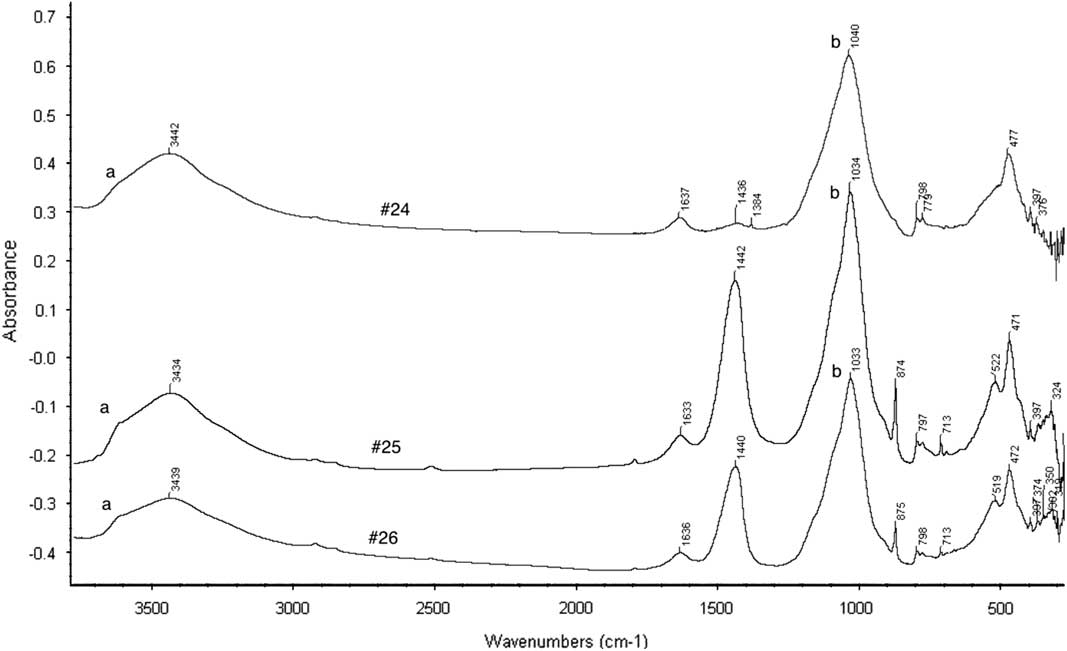
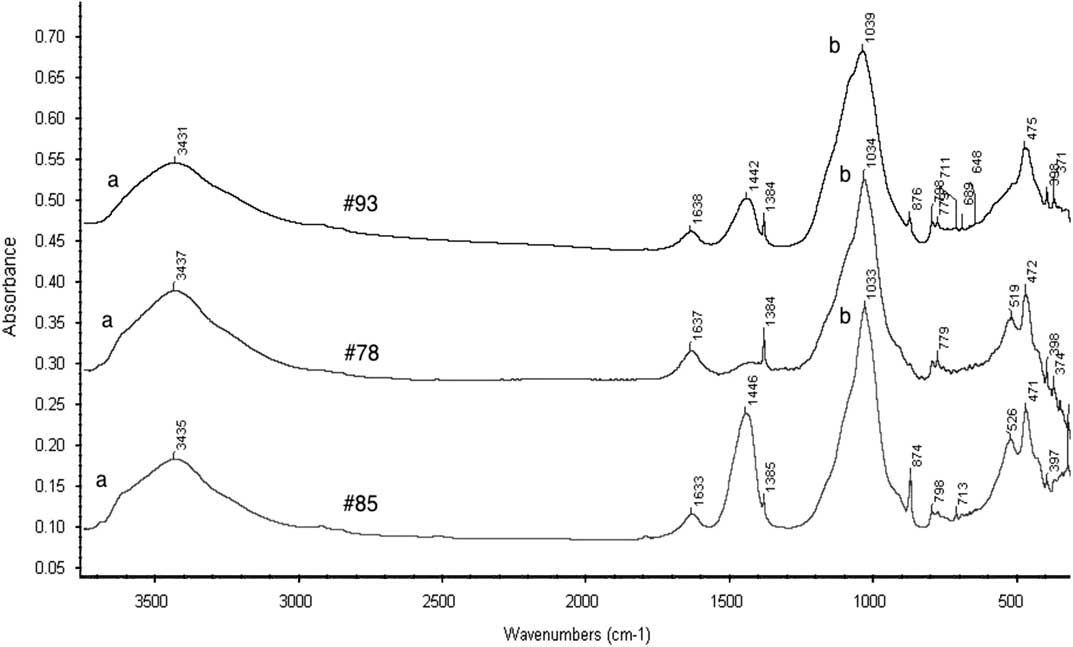
FTIR analysis on the sediments collected from quadrants 105.099c and 105.099d corroborated the macroscopic evaluation of the archaeological situation. As for occupation phase 3, sediments collected from loci 2294, 2296, and 2401 confirmed the occurrence of a small-scale firing event that possibly relates to the destruction of the wattle-and-daub structures found under thick burnt deposits (2294) and to the presence of charcoal. The spectra of samples #24 and #26 collected from locus 2294 (Figure 8) indicate that the clay was exposed to firing temperatures between approximately 400 and 700°C. This can be observed through changes involving the main natural peaks of the clay compounds (Berna et al. Reference Berna, Behar, Shahack-Gross, Berg, Boaretto, Gilboa, Sharon, Shalev, Shilstein, Yahalom-Mack, Zorn and Weiner2007). The spectra of the sediments collected from locus 2296 (Figure 9) and locus 2401 confirmed that the building material has been altered by the exposure to firing temperatures (#93) between 500 and 700°C, while the samples collected from the external side of the wall (#78, 85) consist of unaltered clay and calcite.
FTIR spectra of sediments collected from locus 2294. Sample #24 is compatible with exposure to a temperature between 500 and 700°C: absorption bands of structural water [peaks at 3695 and 3620 cm–1, indicated by (a)] disappear around 400–500°C; absorption bands of clay at 915 and 520 cm–1 disappear between 500 and 700°C; the distinctive peak of clay compounds (b) shifts from 1032 to higher wavenumbers (here 1040 cm–1) after 500°C. Sample #26 is compatible with exposure to a temperature around 400°C. Sample #25 consists of unaltered clay and calcite (peaks at 1442, 874, 713 cm–1).
FTIR spectra of sediments collected from locus 2296. Samples #93 is compatible with exposure to a temperature between 500 and 700°C: absorption bands of OH [peaks at 3695 and 3620 cm–1, indicated by (a)] disappear around 400°C; absorption bands of clay at 915 and 520 cm–1 disappear between 500 and 700°C; the distinctive peak of clay compounds (b) starts shifting after 500°C. Sample #78 consists of unaltered clay, sample #85 consists of unaltered clay and calcite (peaks at 1446, 874, 713 cm–1).
The microscopic analysis of locus 2294 confirms that the sediments derived from an in situ firing activity, as proven by the presence of altered clay (#24, #26). Charcoals collected from this layer are then the probable product of the same activity and chronologically related to the same event. Furthermore, the analysis on loci 2296 and 2401 confirms the exposure of such features to the same average temperatures, as part of a collective firing event that lead to the destruction of the structures. In conclusion, the 14C samples from 2294, 2401, and 2296 are not only related stratigraphically, but can also be associated as having been subjected to the same destruction event.
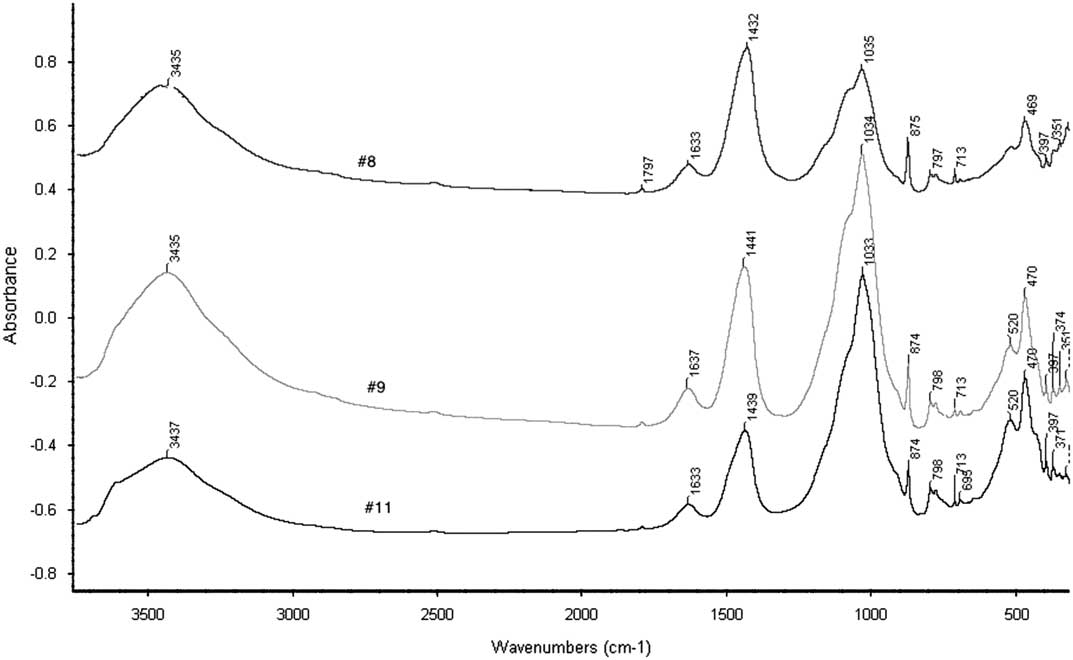
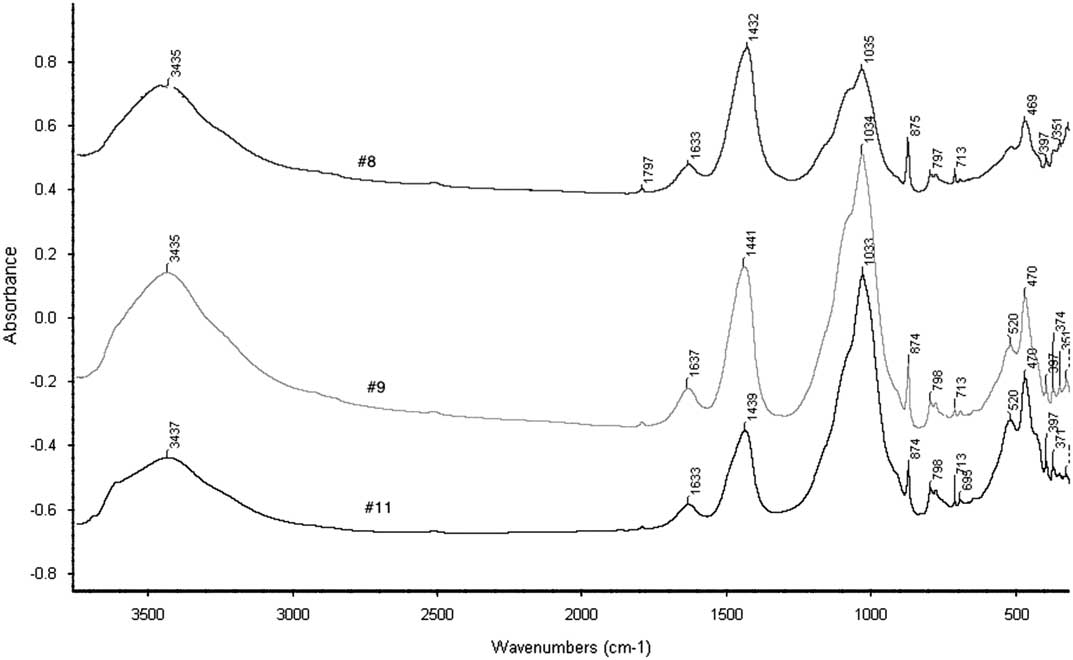
The spectra of sediments collected from locus 2308 (Figure 10) show that the samples mainly consist of unaltered or slightly altered clay and calcite. Sample #8 is richer in calcite (peaks at 1432, 875, 713 cm–1), with a lower presence of slightly altered clay exposed to a temperature around 300–400°C. Sample #9 and #11 are mostly composed of unaltered clay (with the presence of still detectable peaks of structural water and of the peak at 520 cm–1) and calcite. Additional observation with polarized microscopy of sample #11 revealed the presence of phytoliths. Overall, locus 2308 is made of calcite belonging to the general geological composition of the site. The presence of phytoliths suggests the occurrence of anthropic activities associated to this context, but further micromorphological studies are needed in order to better specify its characteristics.
FTIR spectra of sediments collected from locus 2308. Sample #8 is richer in calcite (peaks 1432, 875, 713 cm–1), while clay is present in lower quantities and is compatible with exposure to a temperature around 300–400°C (absence of peaks of OH at 3695 and 3620 cm–1). Samples #9 and #11 are richer in clay (see major absorbance of main peak at 1034 cm–1) and less rich in calcite. The clay is unaltered (presence of peak at 520 cm–1 and still detectable peaks of structural water).
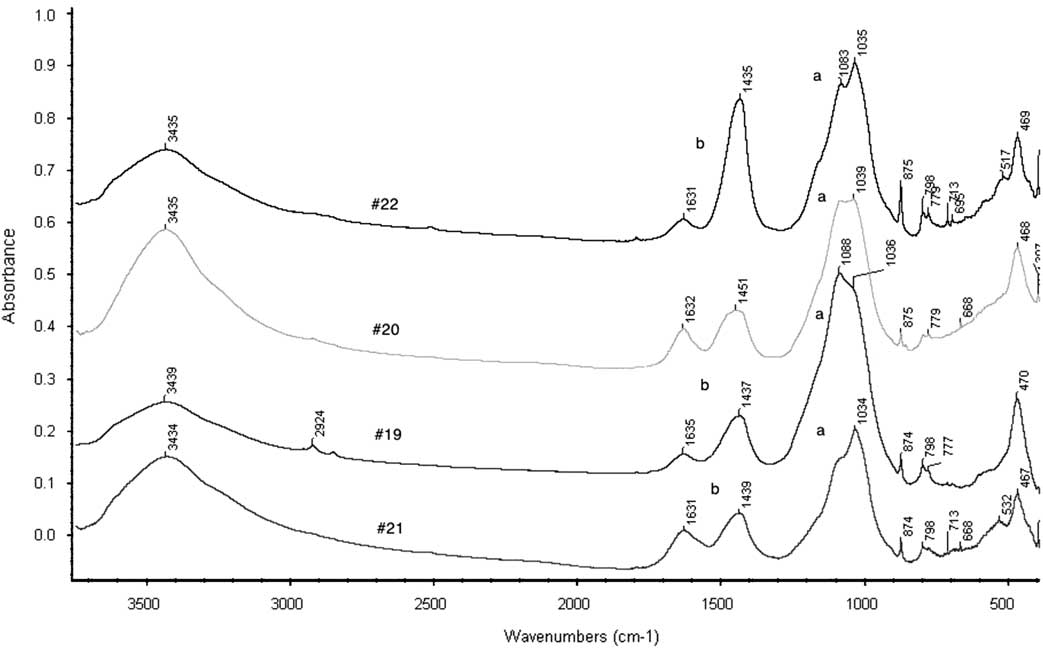
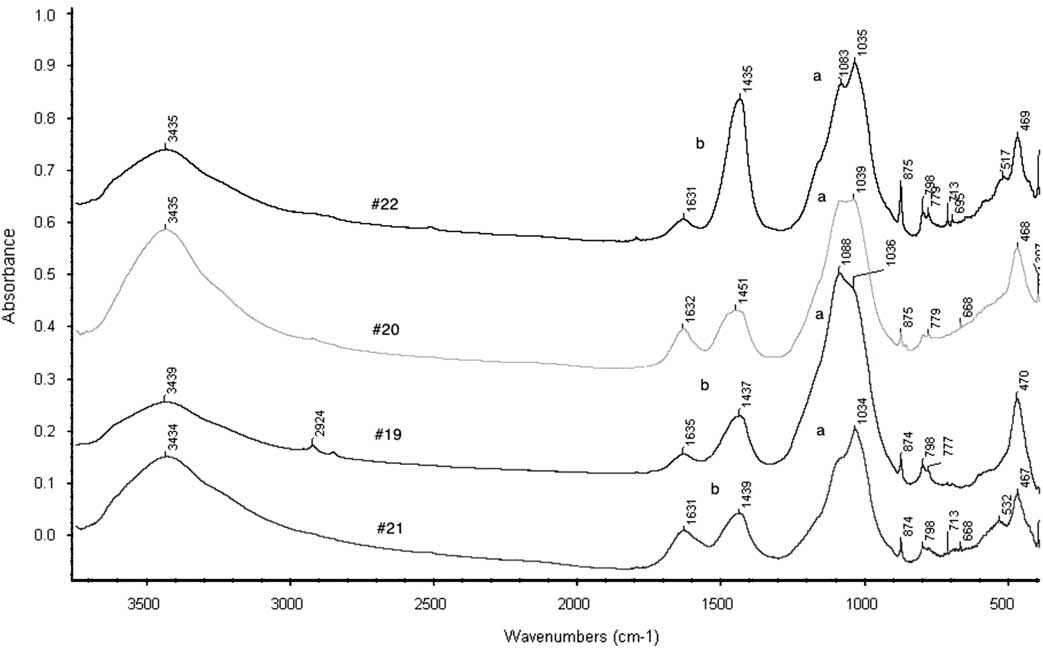
Results of the analysis of sediments collected from locus 2315 (Figure 11) show the major presence of altered clay (#19, #20, #21) and of calcite deposits (#22). Sample #20 has the characteristics of clay exposed to a temperature around 700–800°C, while samples #19 and #21 are less altered (peaks of structural water are still detectable in sample #19, while the clay peak at 520 cm–1 is still present in sample #21). Sample #22 is mainly composed of calcite (peaks at 1435, 875, 713 cm–1). Quartz is also present in all of the samples (peak at 1083 cm–1). The alteration of these sediments confirms that the 14C sample that was collected from this context (#18) is also associated with an in situ firing event. Pseudormorph calcitic remains were not detected in the collected sediments.
FTIR spectra of sediments collected from locus 2315. The samples are compatible with exposure to a temperature around 500°C. The absorption band of clay compounds at 915 and 535 cm–1 are absent, the main peak at 1032 cm–1 (a) shows initial shifting (transforming clay, 1035 cm–1) from the natural absorption value. Peaks of mineral calcite are visible at 874 and 713 cm–1 (b and c); charcoal (1630 and 1435 cm–1) is also present.
Radiocarbon Dates
A total of 14 14C dates (Table 2) were obtained from the samples collected in 2014 in quadrants 105.099c and 105.099d. An assessment of their reliability and accuracy is here provided on the basis of the knowledge on the pretreatment process that possibly affected the samples. The optimal status of the samples after the AAA treatment and the accuracy of the associated 14C measurements have been evaluated on the basis of both the carbon percentage (C%) after pretreatment and the FTIR spectrum obtained from the samples at the end of the procedure.
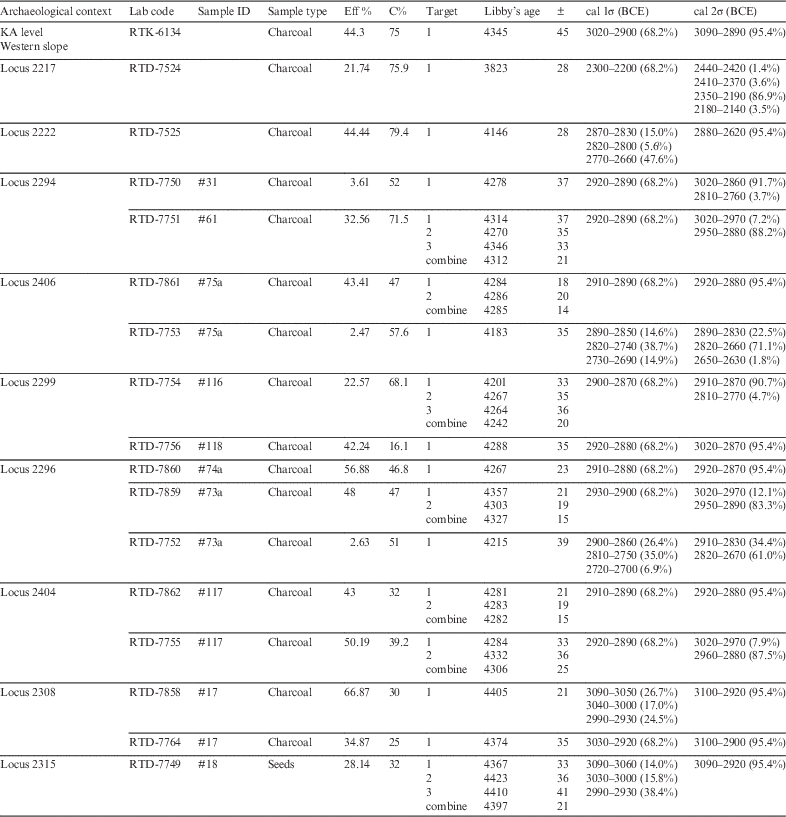
14C results obtained from the site of Aradetis Orgora, squares 105.099c and 105.099d, with lab number, sample ID, sample type, archaeological context, efficiency value, carbon percentage, 14C age in yr BP, and calibrated ranges at 1σ and 2σ rounded at the nearest 10 yr. Dates are ordered by archaeological context according to stratigraphy. For samples that provided more than one target, calibrated ranges were calculated in reference to the combined 14C date.

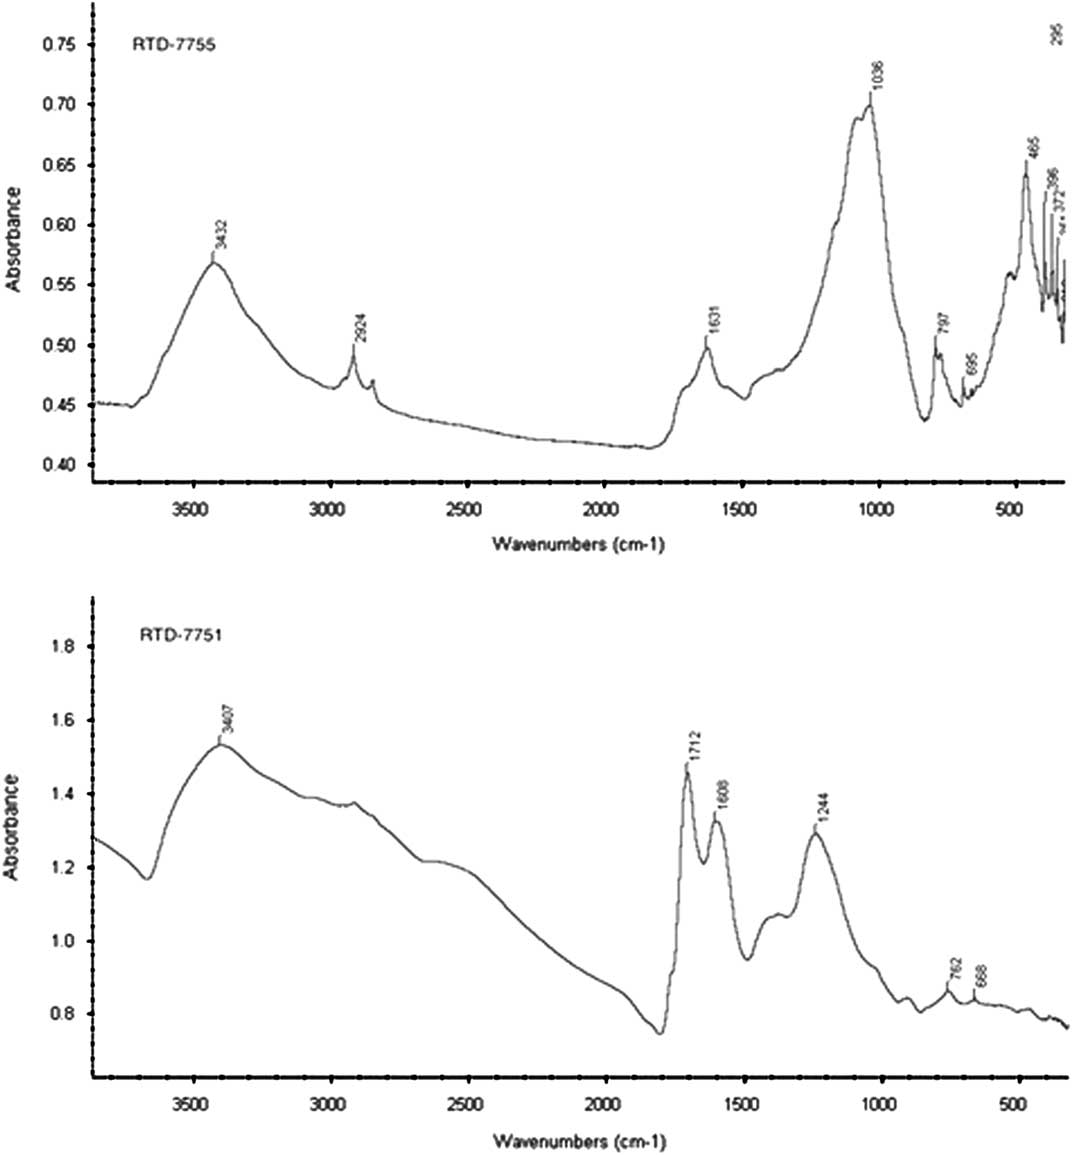
Out of the first group of nine samples (7749, 7750, 7751, 7753, 7754, 7755, 7756, 7764), four samples (RTD-7749, RTD-7755, RTD-7756, RTD-7764) yielded a C% much below the minimum threshold (50% carbon) representative of charred material. The FTIR of these samples (Figure 12) indeed show the combination of the COOH and COO- groups characteristic of charcoal and a large presence of clay minerals. These samples should have been excluded from further processing and 14C measurement. It was decided to proceed anyhow and date them in order to test the effect of clay minerals and their associated carbon on the age of the sample in comparison to clay-free samples. Two samples (RTD-7752, RTD-7753) yielded C% values between 50 and 60%, but in association to a very low efficiency (Eff%) value. As a consequence, a second group of samples (RTD-7858 to RTD-7862) was selected for another pretreatment to provide a second, more reliable measurement of the materials on which the treatment failed the first time. A second cycle could not be performed on RTD-7749 due to the paucity of available material. This second bench of samples also included RTD-7860, which was selected as a comparison term for RTD-7752, since it belongs to the same archaeological context.
Example of unsuccessful (RTD-7755) and successful (RTD-7751) AAA treatment. RTD-7755 shows major absorption peaks of clay minerals (1034 cm–1).

The second group of samples (RTD-7858 to RTD-7862) yielded a C% value <50%, but in association with a larger chemical percent efficiency value. In addition, FTIR spectra (Figure 12) confirmed the absence of clay components, thus assuring the actual derivation of the C% from the charcoal, and not from intrusive C derived from sediments. For these reasons, the measurements of samples RTD-7859 and RTD-7861 (repetition of RTD-7752 and RTD-7753), despite a C% lower than that obtained from the initial treatment process, are considered more accurate and better reliable.
In conclusion, six (RTD-7749, RTD-7752, RTD-7753, RTD-7755, RTD-7756, RTD-7764) out of 14 dates have been rejected due to the presence of clay after pretreatment in the material as detected by FTIR analysis.
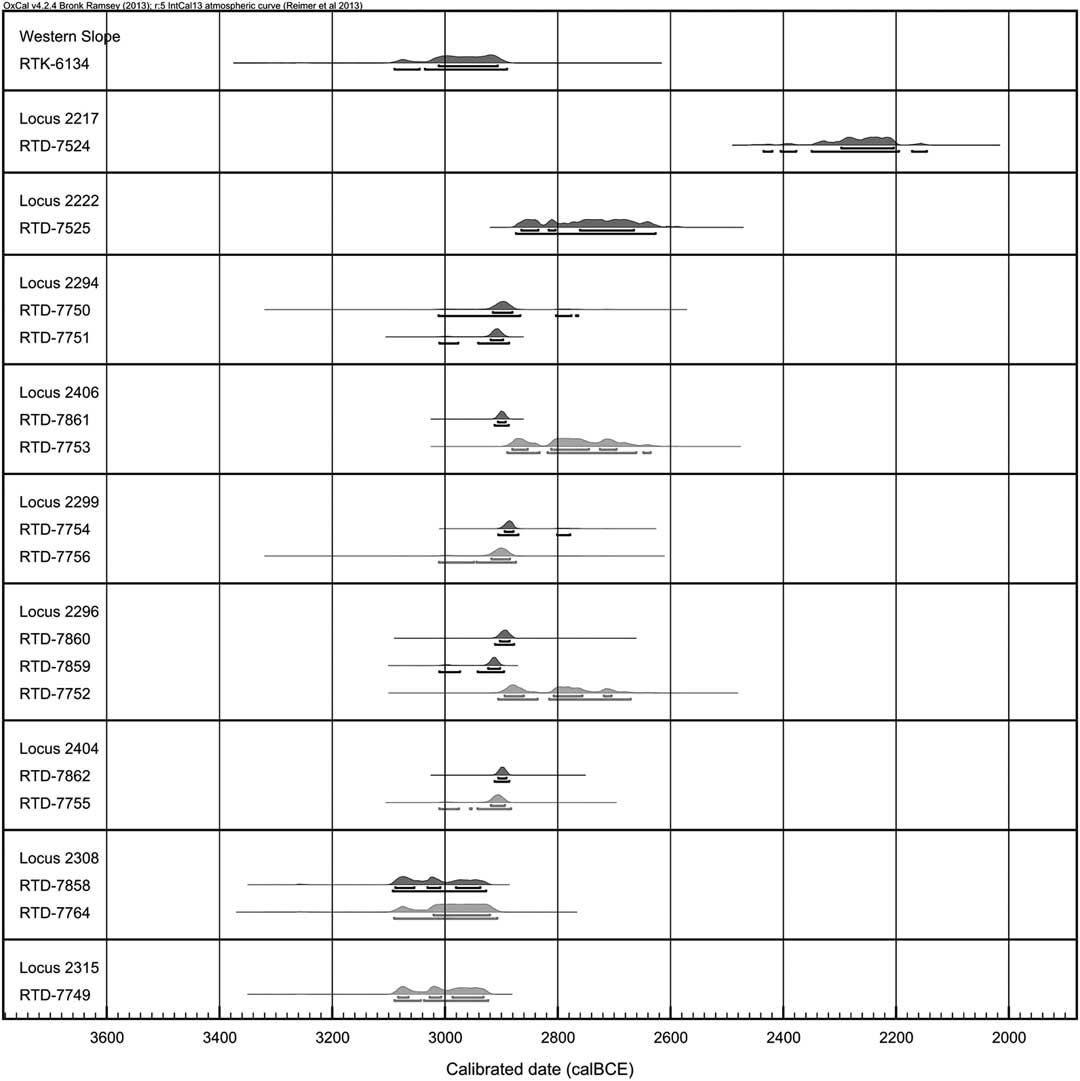
Calibrated ranges of the 14C dates obtained from the 2009, 2013, and 2014 seasons are shown in a simple multiplot (Figure 13): the dates are divided by locus and ordered according to their stratigraphic order from oldest to youngest; measurements that were considered unreliable due to treatment issues are also displayed for comparison. Overall, the observations of the unmodeled calibrated ranges already provide an informative picture on the chronology of the Kura-Araxes occupation of the site. The occupation levels uncovered in quadrant 105.099d are confirmed to be older than those revealed in quadrant 105.099c. The date obtained from locus 2308 (RTD-7858, 3090–2930 cal BCE at 1σ) was measured on a charcoal from short-lived species (Pomoideae undet.) of in situ deposition (see FTIR results), thus providing an accurate terminus ante quem for the use of the KA platforms.
Calibrated 14C dates from the site of Aradetis Orgora. The dates are divided by archaeological context and ordered according to stratigraphy, except for RTK-6134, obtained from the western mound’s section and therefore stratigraphically unrelated. Distribution ranges are shown at 1σ (upper bracket) and 2σ (lower bracket). Dates considered unreliable due to the presence of clay are shown in red in the online version.
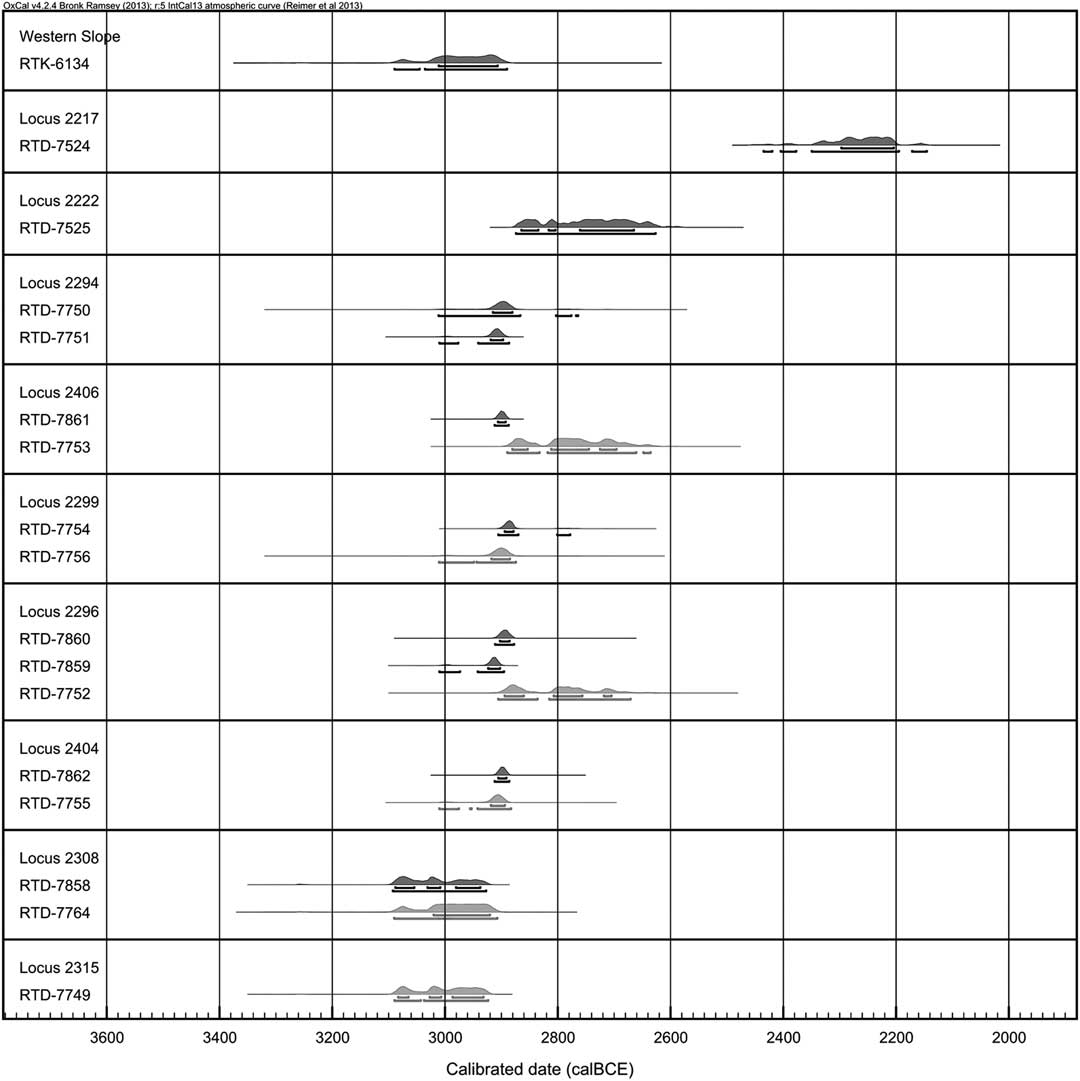
The 14C dates obtained from occupation phase 3 cover a very short period of time, corresponding to the use of the structure identified by the wattle-and-daub walls (2401 and 2296), its associated floor (2299), and a central post-hole (2406), and enclosed between two burnt horizons (2294 and 2404). The stratigraphic representation of their related calibrated terms (Figure 13) shows slight “discrepancies” with regards to their stratigraphic relation: dates obtained from locus 2294 (RTD-7750, RTD-7751), which covered the remains of the structures, result slightly older than those obtained from floor 2299 (RTD-7754), wall 2296 (RTD-7860), and layer 2404 (RTD-7862). However, it is logical to state that 2294 is the probable product of the destruction of the wattle-and-daub structures, thus bearing equal significance for the dating of their use alongside the other dates.
In addition, since most of the calibrated dates fall around the same range (overall between 2920 and 2870 cal BCE at 1σ), in a very short timespan, the building of a sequence between such contexts is inapplicable. On a last note, due to the incomplete status of the excavations, which stopped after the uncovering of layer 2404, the stratigraphic relation of the latter with walls 2401 and 2296 remains unclarified. The oldest measurement was obtained from wall 2296 (RTD-7859, 2930–2900 cal BCE at 1σ), but due to the old-wood effect influencing the sample this is not sufficient to understand its relation to layer 2404. Overall, it seems reasonable to consider the dated contexts as part of a unique dwelling horizon and consequently to evaluate their associate dates as dating terms for the same occupation phase.
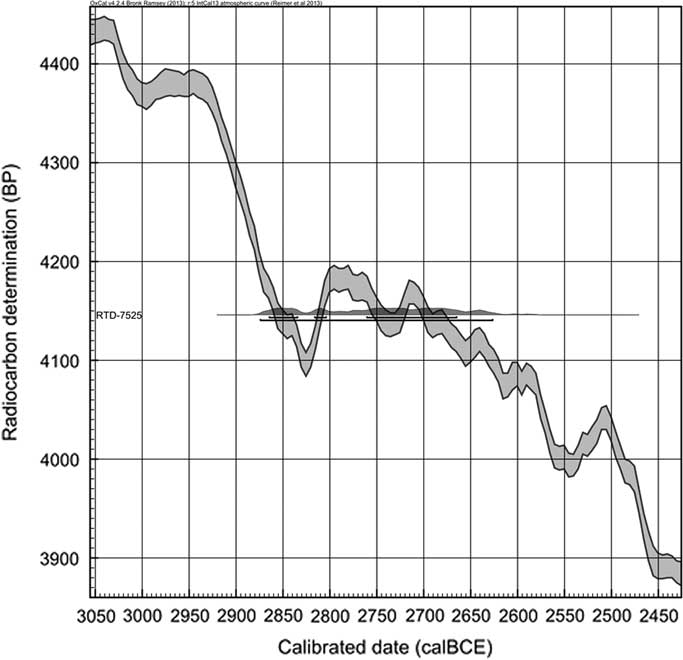
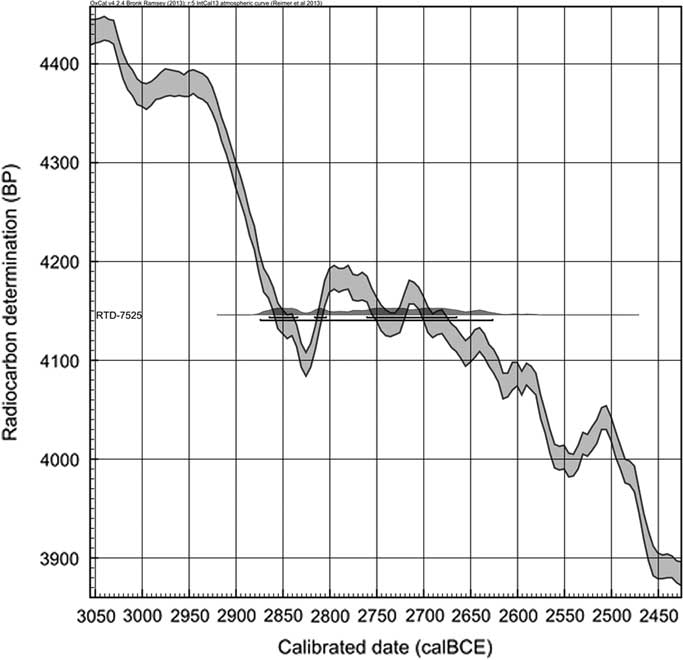
No samples are available for occupation phase 2. However, a single date (RTD-7525) was obtained from locus 2222, belonging to occupation phase 1, which yielded the first remains—although highly compressed—of KA architectural features. Unfortunately, its calibrated range falls on a very “wiggly” area of the calibration curve (Figure 15), thus expanding its distribution span and making the chronological assessment of this horizon problematic. Despite this, the date from 2222 can be addressed as a terminus ante quem for the occupation levels that precede it stratigraphically, which include, among others, the horizon represented by spaces 2287 and 2288. Since the round structures are enclosed between the horizon sealed by 2294 and that topped by 2222, an indicative “indirect” chronological span can be obtained on the basis of their related 14C dates.
A single date was also obtained from locus 2217 (RTD-7525). The attribution of this context to a KA occupation is, however, rather questionable. Very few sherds of the RBBW type were recovered from layer 2219, which covered layer 2217, but these are unlikely to represent an in situ deposition. The closeness of these contexts to the ancient surface of the mound (2215) and the disruptions caused by the insertion of LB structures, which cut through these layers, speak for likely rather disturbed contexts. The presence of KA sherds may as well be derived from reterracing following the destruction of the previous KA occupation. Therefore, the associated KA materials are possibly the result of secondary deposition. Provided that the date obtained from layer 2217 (2300–2200 cal BCE at 1σ) actually refers to this event, the material qualification of this locus is insufficient to designate its association to a specific chronocultural phase.
Finally, the date obtained from the western slope (RTK-6134) after the preliminary visit of the site in 2009 should also be addressed. Since the sample was collected from the exposed western slope of the mound, it is not possible to correlate it to a specific archaeological context, although it was found on a burnt surface near KA materials. The calibrated range provided a span between 3020 and 2900 cal BCE at 1σ, thus roughly suggesting a contemporaneity with the earliest levels uncovered in Field B. However, at the moment no clear correlation with an occupation horizon can be made. In the absence of more detailed information, this date can be regarded as an indication and a comparison term with results from possible future excavations in Field A.
BAYESIAN ANALYSIS
After evaluation of the previous and new 14C results, a series of dates was selected according to reliability criteria in order to perform a Bayesian analysis on the KA occupation of the site. For Field B, out of the 14 newly obtained 14C dates from the 2014 season, six were rejected due to the issues related to their treatment history, as explained in the previous sections. Date RTD-7724, measured in 2013, has not been included due to the elusiveness of the chronocultural affiliation and the possible contamination of its context of provenance (2217). The date obtained from the 2009 preliminary exploration has also not been considered in the analysis due to the absence of an exact stratigraphic relation to either of the sequences uncovered in the two excavation fields. As a whole, the model here proposed only refers to the occupation revealed by the excavation conducted in Field B, where an actual succession of KA occupation levels is known.
Modeling Parameters
The process of building a Bayesian model for a single site requires that 14C dates should be ordered according to their stratigraphic relation and distinguished in “groups” with regards to different occupation horizons. Within each occupation group, dates from contexts of known stratigraphic order should be organized as a sequence, and those of unknown order as a phase. In a sequence, 14C dates should be ordered according to their stratigraphic position, regardless of their 14C age. Conversely, within a phase, dates are considered uniformly as bearing the same weight for the dating of the same event and can thus be ordered according to their 14C age—from the oldest to the youngest—without biasing the results.
The KA sequence uncovered in Field B comprises four occupation levels. The lowest level (occupation phase *4) is represented by locus 2308, excavated in quadrant 105.099d, and representing the earliest KA occupation as yet attested at the site. It lies on top of platform 2315, where a KA jug of RBBW production was recovered during the 2014 season.
The following level (occupation phase 3) is represented by the earliest occupation uncovered in quadrant 105.099c, and constituted by a series of loci with known stratigraphic relations: these correspond to the lowest uncovered burnt horizon (locus 2404), wattle-and-daub walls (loci 2401 and 2296), a floor with an in situ fragmented KA vessel (locus 2299), a post-hole (locus 2406), and the earliest burnt horizon (locus 2294). Despite their known stratigraphic relation to each other, following both the archaeological interpretation and the microscopic study of the selected contexts—which supports the occurrence of a unique burning event of uniform temperature—these loci have been uniformly organized within a phase. The latter is normally applied to 14C dates of unknown order. However, given the association of the dated contexts to the occupation of the same building and to the same destruction event, their associated dates have been organized as a phase as bearing the same weight for the dating of a single occupation level.
The latest occupation of the KA sequence (occupation phase 1) is represented by a single date obtained from layer 2222, excavated during the 2013 season. The meaning of the chronological evaluation with regards to this date have already been outlined in the previous section, with particular emphasis on the problematic wide “wiggly” span of its calibrated distribution.
Overall, the occupation levels have been modeled as a sequence of phases. The three occupations have been ordered according to their stratigraphic position. 14C dates within occupation phase 3 have been ordered from the oldest to the youngest on the basis of their 14C age: since all dates bear the same relevance for the dating of the occupation, their order according to 14C age is not considered to bias the posterior distribution.
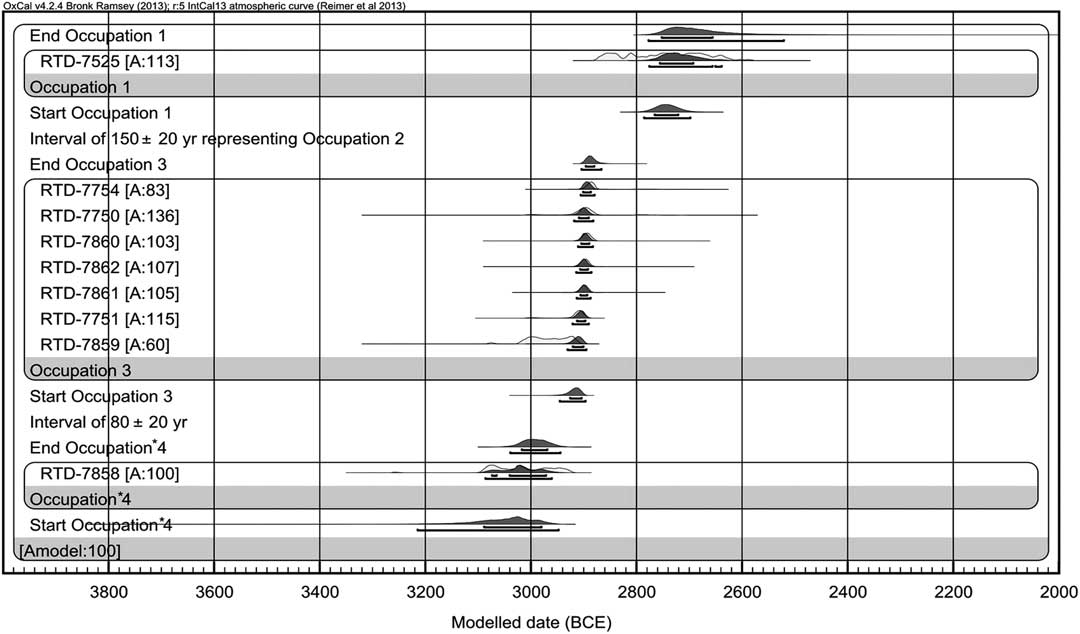
In particular, two models are here proposed for the KA sequence of Field B. In the first model, since the dates do not cover all the levels as yet excavated—see, for example, the lack of 14C dates for occupation phase 2 or for the levels potentially lying between quadrant 105.099c and 105.099d—a simple sequential boundary was applied between the phases, thus constraining the start date of each group to come after the end date of the previous group, with the possibility of chronological gaps. In the second model, the value of the gaps between occupations phases *4 and 3—as yet unexcavated—and between occupations phases 3 and 1—due to the absence of 14C dates—was estimated with the insertion of intervals.
Output
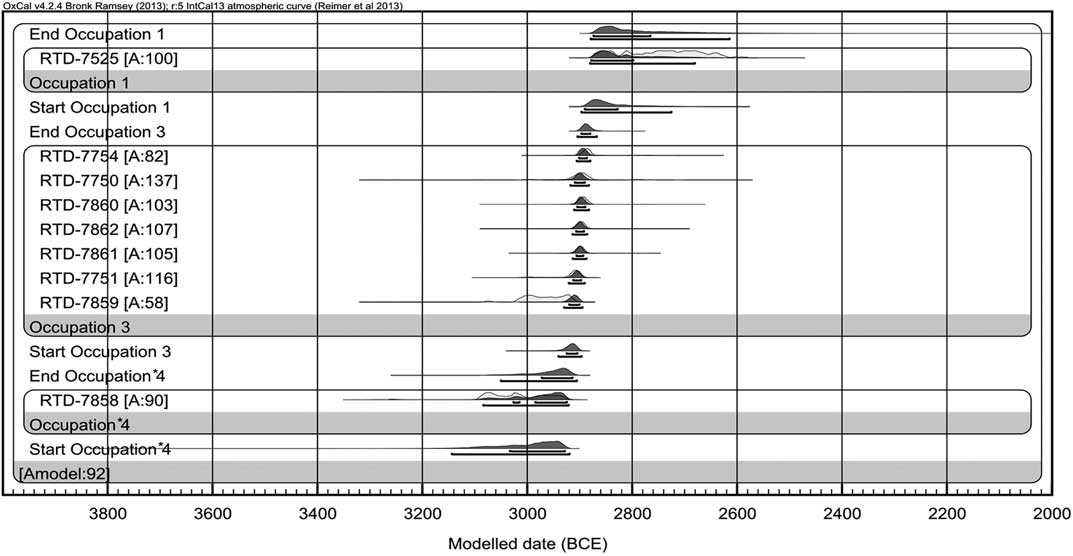
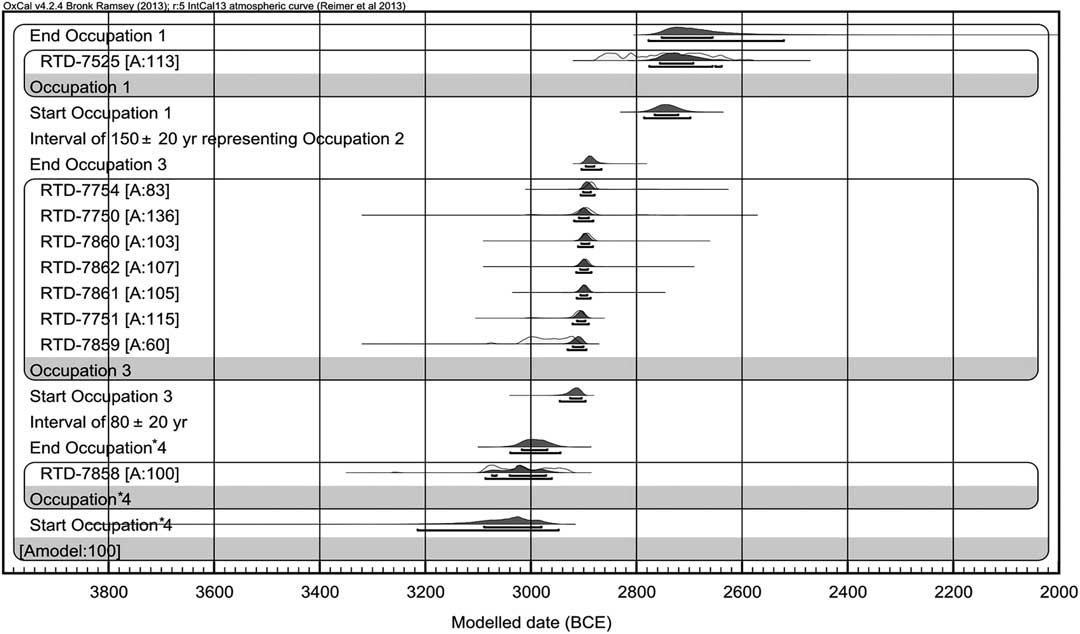
The two models were obtained with the use of the latest version of OxCal v 4.2.4 (Bronk Ramsey and Lee Reference Bronk Ramsey and Lee2013) and all the dates have been calibrated by using the IntCal13 atmospheric curve (Reimer et al. Reference Reimer, Bard, Bayliss, Beck, Blackwell, Bronk Ramsey, Buck, Cheng, Edwards, Friedrich, Grootes, Guilderson, Haflidason, Hajdas, Hatté, Heaton, Hoffman, Hogg, Hughen, Kaiser, Kromer, Manning, Niu, Reimer, Richards, Scott, Southon, Staff, Turney and van der Plicht2013). Calibrated results have been rounded to the nearest 10 yr. The results of the models are shown as multiplots (Figures 14 and 16). Each date is listed under its associated lab code and followed by the indication of the agreement index provided as [A:xxx]. The general agreement of the model is provided in the top left part of the multiplot and indicated as [Amodel:xxx]. The light gray represents the unmodeled calibrated range, while the dark gray represents the modeled calibrated range as selected to meet the modeling parameters. Both models were built on a total of 10 dates, all referring to KA contexts that were excavated and sampled in Field B and characterized by typical materials of the KA II phase.
The simple model (Figure 14) has an agreement of 92. Date RTD-7859 is given an agreement of 58, slightly below the normally accepted threshold for a positive agreement, set at 60. However, considering the controlled circumstances of sampling and treatment of its related sample, the outlying nature of the date should be rather explained in light of the issues regarding its distribution on the calibration curve. The most probable distribution overlaps with date RTD-7860—from the same context—around 2900 cal BCE, while the older distribution on the curve represents only the 12% of the likelihood. Furthermore, the rejection of the date by the modeling parameters is tied to the nature of modeling itself and, particularly, to the constraints imposed by a sequential analysis, which tends to provide a narrow as possible sequence. Given the span of the preceding date RTD-7858, there are no additional analytical parameters to include RTD-7859 at a higher agreement. For all these reasons, date RTD-7859 is not considered an outlier and has been maintained in the model.
“Simple” model of the Kura-Araxes occupation levels at Aradetis Orgora
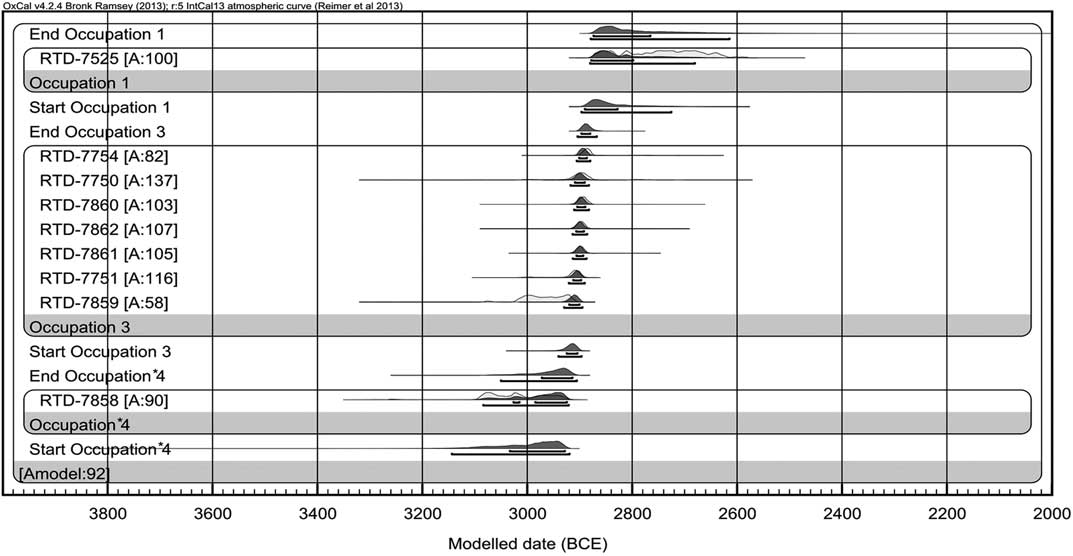
The range for occupation phase *4 is modeled on the single date available for this occupation (RTD-7858). Therefore, it cannot be assumed as representative for the whole sequence uncovered in quadrant 105.099d; rather it should be regarded as a terminus post quem for later occupations. According to the model, the ending date for occupation phase *4—or, rather, the event represented by the single date—is between 2980–2910 BCE. Occupation phase 3 started between 2930–2900 BCE and ended between 2900–2880 BCE, thus defining a short duration of ~20 yr. Occupation phase 1, also modeled on a single 14C date, started between 2900–2810 BCE and ended by 2880–2760 BCE. It has already been noticed that the latter falls on a very “wiggly” area of the calibration curve (Figure 15), thus providing quite a wide distribution span. Following this observation, the modeled and unmodeled ending boundary of this date should be regarded consequently and, within the model, the date should rather be used as a terminus ante quem for the previous occupation phase.
Distribution of RTD-7525 on the calibration curve
The interval model (Figure 16) provided slightly different results. The best fitting interval span was determined by progressively extending the time length of the gap and by monitoring the overall agreement index, following the method tested in the study of Asscher et al. (Reference Asscher, Lehmann, Rosen, Weiner and Boaretto2015). The best agreement index [A:100] was obtained at a time interval of 80±20 yr between occupation phases *4 and 3, and 150±20 yr between occupation phases 3 and 1. The insertion of an interval of 80±20 yr in the first case raised the agreement value of RTD-7859 from 58 to 60, which was the maximum value reachable, thus confirming the calibration issue already discussed. A comparison with the ranges obtained from the simple model shows that the insertion of an interval between occupation phases *4 and 3 shifted the end of occupation phase *4 by ~40–50 yr, which is set between 3020–2960 BCE. The start of occupation phase 3 remains unchanged between 2930 and 2900 BCE. Conversely, the insertion of an interval between occupation phases 3 and 1 left the end of phase 3 unchanged between 2900–2880 BCE, but shifted the start of phase 1 by ~110–130 yr, setting it between 2770 and 2720 BCE. Such changes are related to the nature of the distribution range of dates RTD-7858 and RTD-7525, which are wider than those of occupation phase 3 and, therefore, more liable to be manipulated by the introduction of additional model parameters.
“Interval” model of the Kura-Araxes occupation levels at Aradetis Orgora
DISCUSSION
In total, 17 14C dates have been obtained for the KA occupation at the site of Aradetis Orgora. A specific vertical-dating strategy could be applied on the samples collected in 2014, for which a complete report regarding each step of the study—from field sampling to final measurement and interpretation—is accessible.
The application of FTIR methodology to check samples before and after lab treatment allowed to recognize, in some cases, the presence of clay mineral bearing organic material and contaminating the carbon signal of the charcoal. When possible, a second AAA cycle was performed on the same samples, by choosing larger quantities of materials for the operation. Despite the final low C% value (<50%) after the second AAA cycle, the FTIR spectra confirmed the absence of clay contaminants from the samples. A comparison between the 14C dates that were obtained from the two AAA treatments showed a discrepancy between the 14C ages measured on the same sample at different stages of contaminants removal. The association of C% values with good FTIR spectra has served as a criterion for the selection of 14C dates for further chronological analysis.
FTIR was also performed on sediments belonging to archaeological contexts from which 14C samples were collected. The results confirmed the macroscopic assessment of the contexts and allowed to correlate 14C samples to specific events. The analysis was particularly useful for the study of occupation phase 3, which yielded the majority of charcoals. FTIR results showed that contexts 2296, 2294, and 2299, altogether defining the architectural horizon of occupation phase 3, were altered due to a small-scale firing event. Charcoals collected from these contexts are likely derived from the same firing event. This observation served as a further parameter for the organization of 14C dates within Bayesian models.
Bayesian analysis on the stratigraphy was performed only by using reliable 14C dates, based both on analytical and archaeological reasons. Out of 17 dates related to the KA occupation at the site, six (RTD-7749, RTD-7752, RTD-7753, RTD-7755, RTD-7756, RTD-7764) were rejected due to analytical reasons, while two dates (RTD-7724, RTD-6134) were excluded due to issues related to the nature of their associated archaeological contexts. Therefore, the two models were built on a total of nine 14C dates, of which seven refer to occupation phase 3, which thus constitutes the most extensively dated KA horizon at the site. The total duration of the KA II occupation in Field B has been estimated with two Bayesian models. The first (“simple”) model exemplifies the stratigraphic situation with a sequential boundary imposed between phases (= occupations). The second (“interval”) model completes the sequence with the insertion of artificial gaps, supplying for the absence of 14C dates from occupation phase 2 and from the unexcavated levels (possibly) present between occupation phases 3 and *4. Following the results of Bayesian analysis (Table 3), the excavated KA II levels at Aradetis Orgora can be assigned to a period between 3040–2920 and 2900–2810 cal BC according to the simple model, or to a period between 3090–2980 and 2770–2720 cal BC according to the interval model. Comparisons between the two models showed that the estimated length of occupation phase 3 remains unchanged, while the chronological limits of occupation phases 1 and *4 shifted alongside the insertion of artificial intervals. This is a consequence of the availability of 14C dates for occupation phase 3, whose range of duration is more consistent as based on a higher number of 14C dates.
Due to the paucity of 14C dates for the later KA phases, as well as the presence in quadrant 105.099c of still uncovered layers between those belonging to occupation phase 3 and those, excavated in quadrant 105.099d, attributed to occupation phase *4, the results of both models are limited by the number of dates for such levels. In the absence of more parameters, the insertion of analytically simulated intervals in the second model, although still providing a likely scenario that is plausible at least on the basis of pure Bayesian modeling, has to be taken into account by means of its speculative nature.
In spite of these problems, the sequence is sufficiently clear and informative for a general understanding of the chronological limits of the KA II phase at the site. The features discovered in quadrant 105.099d were in use in the period around 3090–2930 cal BCE, thus designating an earlier KA occupation in Field B. The phase 3 occupation in quadrant 105.099c is clearly assignable to the period between 2930–2900 BCE and 2900–2880 BCE, thus designating a very short occupation of ~20 yr. Regarding the latest KA levels, possible conclusions derived from the single date RTD-7525 should take into account the problematically wide span of its calibrated distribution, which covers a period as low as the 28th century BCE, and rather consider it as an ante quem indication for the previous levels.
CONCLUSIONS
The strategy applied to the samples collected in 2014 from the KA II levels at Aradetis Orgora allowed to obtain a first group of reliable 14C determinations, through the application of a thorough microscopic approach. A first solid Bayesian analysis based on site stratigraphy estimated the length of the occupation of the KA II phase in Field B between the end of the 31st and the 29th century BC. However, occupation phase 3 stands as the best dated KA horizon, while further excavations are needed for the extension of the 14C record for the KA culture at the site. Nonetheless, the results here presented contribute towards the definition of a scientific-based chronology of the Kura-Araxes culture in the Shida Kartli region of Georgia.
Synthesis of the results of the “simple” and “interval” models. Modeled calibrated ranges are reported as Cal BCE at 1σ and rounded at the nearest 10 yr.

ACKNOWLEDGMENTS
The authors are grateful to Prof David Lordkipanidze (General Director, Georgian National Museum) and Dr Zurab Makharadze (Director of Archaeological Center, GNM) for the permission to undertake archaeological excavations at Aradetis Orgora, and to Prof Iulon Gagoshidze, co-director of the Georgian-Italian Shida Kartli Archaeological project, for his constant support to our activities. We also wish to thank Dr Valentina Caracuta for her contribution with regards to the botanical identification of samples and Eugenia Mintz for her assistance during laboratory treatment. Many thanks are due to the members of the Georgian-Italian Shida Kartli Archaeological Project for sharing precious information and pictures of the main materials yielded by the excavations of Aradetis Orgora. The excavation seasons at Aradetis Orgora and the analysis of the collected samples were funded by the following institutions: Italian Ministry of Education (PRIN 2009 project), Italian Ministry of Foreign Affairs, Ca’ Foscari University, and private sponsors. Research leading to the completion of this article was made possible through a grant by the Israeli Ministry of Foreign Affairs (November 2014–May 2015), which allowed the first author to spend a 7-month period at the Weizmann Institute of Science in order to complete her MA thesis (Passerini Reference Passerini2015). This research was funded by the Max Planck-Weizmann Center for Integrative Archaeology and Anthropology “Timing of Cultural Changes,” The Exilarch Foundation for the Dangoor Research Accelerator Mass Spectrometer.