Introduction
Treatment for psychiatric disorders is predicated on the identification of discrete psychiatric outcomes. Yet, such outcomes say little about the mechanisms that might govern behavioral and physiological functioning underlying the disorders. A greater understanding of such clinical characteristics and their prognostic value would improve diagnostic precision, help tailor treatment choice, and enhance risk detection and treatment outcome monitoring. A promising avenue to this end is digital phenotyping, the direct, moment-to-moment, objective measurement of clinical characteristics using digital data sources (Huckvale, Venkatesh, & Christensen, Reference Huckvale, Venkatesh and Christensen2019).
Visual and vocal characteristics represent a compelling direction in digital phenotyping as signs and symptoms of diverse central nervous system (CNS) disorders have known behavioral signatures, such as vigilance, arousal, fatigue, agitation, psychomotor retardation, flat affect, inattention, compulsive repetition, and negative affective biases, to name a few (American Psychiatric Association, 2013). Advances in both deep learning and computational power now allow for rapid and accurate measurement of myriad markers that have already demonstrated robust effects in clinical populations. For example, facial expressions of emotion, which have demonstrated effects in multiple clinical populations (Cohn et al., Reference Cohn, Kruez, Matthews, Yang, Nguyen, Padilla and De la Torre2009; Ekman & Friesen, Reference Ekman and Friesen1978; Ekman, Matsumoto, & Friesen, Reference Ekman, Matsumoto, Friesen, E and EL1997; Gaebel & Wölwer, Reference Gaebel and Wölwer1992; Gehricke & Shapiro, Reference Gehricke and Shapiro2000; Girard, Cohn, Mahoor, Mavadati, & Rosenwald, Reference Girard, Cohn, Mahoor, Mavadati and Rosenwald2013; Renneberg, Heyn, Gebhard, & Bachmann, Reference Renneberg, Heyn, Gebhard and Bachmann2005) can be coded using computer vision (CV) based open-source software (Amos, Ludwiczuk, & Satyanarayanan, Reference Amos, Ludwiczuk and Satyanarayanan2016; Baltrusaitis, Zadeh, Lim, & Morency, Reference Baltrusaitis, Zadeh, Lim and Morency2018; Bradski & Kaehler, Reference Bradski and Kaehler2008) and utilized in real-time to measure clinical functioning (Bao & Ma, Reference Bao and Ma2014; Cohn et al., Reference Cohn, Kruez, Matthews, Yang, Nguyen, Padilla and De la Torre2009; Gaebel & Wölwer, Reference Gaebel and Wölwer1992; Girard et al., Reference Girard, Cohn, Mahoor, Mavadati and Rosenwald2013; Wang, Reference Wang2016; Xing & Luo, Reference Xing and Luo2016; Zhong, Chen, & Liu, Reference Zhong, Chen and Liu2014). Further, measurements of facial emotion intensity provide a direct index for flat affect, fatigue, and pain (Ekman, Freisen, & Ancoli, Reference Ekman, Freisen and Ancoli1980; Kohler et al., Reference Kohler, Martin, Milonova, Wang, Verma, Brensinger and Gur2008; Simon, Craig, Gosselin, Belin, & Rainville, Reference Simon, Craig, Gosselin, Belin and Rainville2008). Similarly, pitch, tone, rate of speech, and valence of language, all of which are quantifiable based on either prosaic or natural language models, index motor, mood, and cognitive functioning (Bernard & Mittal, Reference Bernard and Mittal2015; Cannizzaro et al., Reference Cannizzaro, Harel, Reilly, Chappell and Snyder2004; Cohn et al., Reference Cohn, Kruez, Matthews, Yang, Nguyen, Padilla and De la Torre2009; Eichstaedt et al., Reference Eichstaedt, Smith, Merchant, Ungar, Crutchley, Preoţiuc-Pietro and Schwartz2018; France, Shiavi, Silverman, Silverman, & Wilkes, Reference France, Shiavi, Silverman, Silverman and Wilkes2000; He, Veldkamp, & de Vries, Reference He, Veldkamp and de Vries2012; Kleim, Horn, Kraehenmann, Mehl, & Ehlers, Reference Kleim, Horn, Kraehenmann, Mehl and Ehlers2018; Leff & Abberton, Reference Leff and Abberton1981; Lu et al., Reference Lu, Frauendorfer, Rabbi, Mast, Chittaranjan, Campbell and Choudhury2012; Marmar et al., Reference Marmar, Brown, Qian, Laska, Siegel, Li and Smith2019; Pestian, Nasrallah, Matykiewicz, Bennett, & Leenaars, Reference Pestian, Nasrallah, Matykiewicz, Bennett and Leenaars2010; Quatieri & Malyska, Reference Quatieri and Malyska2012; Sobin & Sackeim, Reference Sobin and Sackeim1997; van den Broek, van der Sluis, & Dijkstra, Reference van den Broek, van der Sluis, Dijkstra, J, M and M2010; Yang, Fairbairn, & Cohn, Reference Yang, Fairbairn and Cohn2013). Previous studies were able to link digital biomarker with well-known symptoms of posttraumatic stress disorder (PTSD) and major depressive disorder (MDD) that can be measured via facial markers such as decreased flexibility of emotion expression in PTSD (Rodin et al., Reference Rodin, Bonanno, Rahman, Kouri, Bryant, Marmar and Brown2017), decreased positive affect and higher anger expression (Blechert, Michael, & Wilhelm, Reference Blechert, Michael and Wilhelm2013; Kirsch & Brunnhuber, Reference Kirsch and Brunnhuber2007) and higher facial affect intensity in PTSD (McTeague et al., Reference McTeague, Lang, Laplante, Cuthbert, Shumen and Bradley2010) as well as decreased facial expressivity in patients with MDD (Davies et al., Reference Davies, Wolz, Leppanen, Fernandez-Aranda, Schmidt and Tchanturia2016; Gaebel & Wölwer, Reference Gaebel and Wölwer1992; Girard et al., Reference Girard, Cohn, Mahoor, Mavadati and Rosenwald2013; Renneberg et al., Reference Renneberg, Heyn, Gebhard and Bachmann2005; Sloan, Strauss, Quirk, & Sajatovic, Reference Sloan, Strauss, Quirk and Sajatovic1997). In addition, voice markers including volume, fundamental frequency, jitter, shimmer, and harmonics-to-noise ratio have been associated with PTSD (Scherer, Stratou, Gratch, & Morency, Reference Scherer, Stratou, Gratch and Morency2013; Xu et al., Reference Xu, Mei, Zhang, Gao, Judkins, Cannizzaro and Li2012) and MDD (Asgari, Shafran, & Sheeber, Reference Asgari, Shafran and Sheeber2014; Breznitz, Reference Breznitz1992; Cummins, Sethu, Epps, Schnieder, & Krajewski, Reference Cummins, Sethu, Epps, Schnieder and Krajewski2015b; Hönig, Batliner, Nöth, Schnieder, & Krajewski, Reference Hönig, Batliner, Nöth, Schnieder and Krajewski2014; Kiss, Tulics, Sztahó, Esposito, & Vicsi, Reference Kiss, Tulics, Sztahó, Esposito, Vicsi and A2016; Nilsonne, Sundberg, Ternström, & Askenfelt, Reference Nilsonne, Sundberg, Ternström and Askenfelt1988; Ozdas, Shiavi, Silverman, Silverman, & Wilkes, Reference Ozdas, Shiavi, Silverman, Silverman and Wilkes2004; Porritt, Zinser, Bachorowski, & Kaplan, Reference Porritt, Zinser, Bachorowski and Kaplan2014; Quatieri & Malyska, Reference Quatieri and Malyska2012; Scherer et al., Reference Scherer, Stratou, Gratch and Morency2013). Previous studies also identified relevant markers of speech content. For instance, the speech rate was negatively correlated with both PTSD and depression symptom severity (Scherer, Lucas, Gratch, Rizzo, & Morency, Reference Scherer, Lucas, Gratch, Rizzo and Morency2015) and narrative coherence in PTSD (He, Veldkamp, Glas, & de Vries, Reference He, Veldkamp, Glas and de Vries2017). Also, unique patterns of speech content were identified as indicators of MDD such as the rate of speech, lexical diversity, pauses between words and the sentiment of speech content (Alghowinem et al., Reference Alghowinem, Goecke, Wagner, Epps, Breakspear and Parker2013; Calvo, Milne, Hussain, & Christensen, Reference Calvo, Milne, Hussain and Christensen2017; Cummins, Epps, Breakspear, & Goecke, Reference Cummins, Epps, Breakspear and Goecke2011; Cummins et al., Reference Cummins, Scherer, Krajewski, Schnieder, Epps and Quatieri2015a; Marge, Banerjee, & Rudnicky, Reference Marge, Banerjee and Rudnicky2010; McNally, Otto, & Hornig, Reference McNally, Otto and Hornig2001; Mowery, Smith, Cheney, Bryan, & Conway, Reference Mowery, Smith, Cheney, Bryan and Conway2016; Nilsonne, Reference Nilsonne1988, Reference Nilsonne1987; Sturim, Torres-Carrasquillo, Quatieri, Malyska, & McCree, Reference Sturim, Torres-Carrasquillo, Quatieri, Malyska and McCree2011). Digital biomarkers of movement in PTSD revealed an association with suppressed motor activity to neutral stimuli (Litz, Orsillo, Kaloupek, & Weathers, Reference Litz, Orsillo, Kaloupek and Weathers2000) and heightened arousal (Blechert et al., Reference Blechert, Michael and Wilhelm2013) and increased eye blink (McTeague et al., Reference McTeague, Lang, Laplante, Cuthbert, Shumen and Bradley2010) and increased fixation on trauma-related stimuli (Felmingham, Rennie, Manor, & Bryant, Reference Felmingham, Rennie, Manor and Bryant2011). Digital biomarkers of movement in MDD have also been examined (Anis, Zakia, Mohamed, & Jeffrey, Reference Anis, Zakia, Mohamed and Jeffrey2018; Bhatia, Goecke, Hammal, & Cohn, Reference Bhatia, Goecke, Hammal and Cohn2019; Dibeklioğlu, Hammal, & Cohn, Reference Dibeklioğlu, Hammal and Cohn2017; Shah, Sidorov, & Marshall, Reference Shah, Sidorov and Marshall2017), such as psychomotor retardation (Syed, Sidorov, & Marshall, Reference Syed, Sidorov and Marshall2017).
Deep learning is an emerging tool to bridge the gap between empirical findings and explanatory theories of psychology and cognitive neuroscience (Hasson, Nastase, & Goldstein, Reference Hasson, Nastase and Goldstein2020). While simple correlational analyses are limited to discern informative associations from spurious effects (Meehl, Reference Meehl1990), deep neural networks are impressively successful in learning to mimic human cognitive processes such as face recognition in a data-driven way (LeCun, Bengio, & Hinton, Reference LeCun, Bengio and Hinton2015). Based on higher-order representations of multivariate dependencies, deep learning can achieve near-perfect accuracy in face recognition (>99.7%) (Grother, Ngan, & Hanaoka, Reference Grother, Ngan and Hanaoka2020) without making theoretical assumptions that explain how humans perform such tasks (Hasson et al., Reference Hasson, Nastase and Goldstein2020). Moreover, existing theories of emotion processing in PTSD such as the early Bio-Informational Processing Theory (Lang, Reference Lang1979) can provide theoretical motivation for Digital Phenotyping based on deep learning without the reverse being true. Informed by existing theories, deep learning can attempt to emulate sensory imagery and text comprehension that link and activate conceptual networks that are directly coupled with overt behavioral expression. However, the aim of applying deep learning is not to accurately model such theories but, more modestly, to find stable probabilistic patterns in a data-driven way (Valiant, Reference Valiant1984). With the focus on prediction rather than explanation (Shmueli, Reference Shmueli2010), existing theories of PTSD, such as the Emotional Processing Theory (Foa, Huppert, & Cahill, Reference Foa, Huppert and Cahill2006) are still highly valuable and informative for the selection of candidate predictors, but the successful predictive model will be theoretically agnostic and neither corroborate nor disprove any particular explanatory theory. Emotional Processing Theory is particularly informative for Digital Phenotyping as it explains how the brain dynamically integrates multidimensional information resulting in rich context-dependent emotional, cognitive, and behavioral reactions. Deep learning allows integrating multiple empirical associations, including subtle ones, into a computational framework. The study of face, voice, and speech content as indicators of human psychology and psychopathology such as PTSD has a long tradition. As one of the first and most well-known examples, Charles Darwin postulated that biologically ‘hard-wired’ facial expressions of emotions (Darwin, Reference Darwin1872/1965) signal and convey important information about the emotional and mental states of a person (Ekman, Reference Ekman2006). Decades of neuropsychological research showed that emotional expression and valence contain predictive probabilistic information of diverse forms of psychopathology (Gaebel & Wölwer, Reference Gaebel and Wölwer1992; Gehricke & Shapiro, Reference Gehricke and Shapiro2000; Renneberg et al., Reference Renneberg, Heyn, Gebhard and Bachmann2005). Speech and voice are additional channels conveying probabilistic information about mental health (Cannizzaro et al., Reference Cannizzaro, Harel, Reilly, Chappell and Snyder2004; Cohn et al., Reference Cohn, Kruez, Matthews, Yang, Nguyen, Padilla and De la Torre2009; France et al., Reference France, Shiavi, Silverman, Silverman and Wilkes2000; Leff & Abberton, Reference Leff and Abberton1981). Physical movements represent a further behavioral output that can be used to characterize clinical functioning across a spectrum from psychomotor retardation to agitation (Bernard & Mittal, Reference Bernard and Mittal2015; Sobin & Sackeim, Reference Sobin and Sackeim1997). However, dimensions of facial expressivity, speech, and movement are most likely not univocal categorical indicators of mutually exclusive disorders, but rather vary and overlap across clinical presentations making these dimensions transdiagnostic indicators of clinical functioning more generally.
A shift in focus away from psychiatric diagnostic classifications, that are known to be heterogeneous and lack a biological basis (Galatzer-Levy & Bryant, Reference Galatzer-Levy and Bryant2013), to directly observable dimensions of behavior and physiology, may improve diagnosis and treatment based on the underlying neurobiological functioning (Insel, Reference Insel2014). For example, motor functioning is both affected across a wide variety of psychiatric disorders (e.g. psychomotor retardation in schizophrenia and depression, agitation in anxiety disorders, and tremor in Parkinson's disease and essential tremor) and has known treatment targets (e.g. dopaminergic pathways; motor cortex activity). The direct and frequent measurement of motor deficits can facilitate the modulation of motor functioning across diverse disorders using known treatment options.
In the current study, we examined if the direct digital measurement of facial features and their intensity, head movement and eye movement, prosaic and natural language features can accurately identify clinical functioning in a population at heightened risk for MDD and PTSD. Core features of PTSD and depression include variability in arousal, mood, and vigilance (American Psychiatric Association, 2013). Further, patients with PTSD and MDD have demonstrated individual differences compared to healthy controls in the expression of facial features of emotion, prosaic vocal features, and speech content (Cannizzaro et al., Reference Cannizzaro, Harel, Reilly, Chappell and Snyder2004; Cohn et al., Reference Cohn, Kruez, Matthews, Yang, Nguyen, Padilla and De la Torre2009; Gaebel & Wölwer, Reference Gaebel and Wölwer1992; Gehricke & Shapiro, Reference Gehricke and Shapiro2000; He et al., Reference He, Veldkamp and de Vries2012; Kleim et al., Reference Kleim, Horn, Kraehenmann, Mehl and Ehlers2018; Marmar et al., Reference Marmar, Brown, Qian, Laska, Siegel, Li and Smith2019; Quatieri & Malyska, Reference Quatieri and Malyska2012; Renneberg et al., Reference Renneberg, Heyn, Gebhard and Bachmann2005; van den Broek et al., Reference van den Broek, van der Sluis, Dijkstra, J, M and M2010; Yang et al., Reference Yang, Fairbairn and Cohn2013).
We capitalized on recent developments in deep learning (Goodfellow, Bengio, Courville, & Bengio, Reference Goodfellow, Bengio, Courville and Bengio2016) that have facilitated groundbreaking advances in affect detection, movement modeling, and speech/language analysis (Baltrusaitis et al., Reference Baltrusaitis, Zadeh, Lim and Morency2018; Cannizzaro et al., Reference Cannizzaro, Harel, Reilly, Chappell and Snyder2004; Cohn et al., Reference Cohn, Kruez, Matthews, Yang, Nguyen, Padilla and De la Torre2009; Gaebel & Wölwer, Reference Gaebel and Wölwer1992; He et al., Reference He, Veldkamp and de Vries2012; Kleim et al., Reference Kleim, Horn, Kraehenmann, Mehl and Ehlers2018; Pestian et al., Reference Pestian, Nasrallah, Matykiewicz, Bennett and Leenaars2010; Quatieri & Malyska, Reference Quatieri and Malyska2012; van den Broek et al., Reference van den Broek, van der Sluis, Dijkstra, J, M and M2010; Yang et al., Reference Yang, Fairbairn and Cohn2013). Convolutional Neural Networks and Deep Neural Networks can be utilized to identify face, voice, language, and movement characteristics from audio and video data (Amos et al., Reference Amos, Ludwiczuk and Satyanarayanan2016; Baltrusaitis et al., Reference Baltrusaitis, Zadeh, Lim and Morency2018; Jadoul, Thompson, & de Boer, Reference Jadoul, Thompson and de Boer2018) and can be utilized to integrate features to build and validate a predictive model. Intuitively, this modeling approach matches human clinical decision making where multiple aspects of the patient's presentation are integrated to identify risk.
Our aim was to use CV and neural networks to label facial landmark features of emotions as well as landmark features for voice prosody and to identify prognostic features of speech content using natural language processing (NLP) and to use them as labels for the classification of mental wellbeing. We hypothesized that deep learning would uncover unique probabilistic information on the integration of those information channels (multimodal fusion) that would yield discriminatory accuracy for the prediction of posttraumatic stress and MDD status (‘proof-of-concept’). Such models can facilitate a more robust, accurate, ecologically valid, and ultimately automated and scalable method of risk identification based on unstructured data sources. Remote assessment of these models has particular relevance in the context of trauma exposure, as such events are ubiquitous, can occur rapidly and unexpectedly, and can affect individuals who are remote from appropriate clinical services (Carmi, Schultebraucks, & Galatzer-Levy, Reference Carmi, Schultebraucks, Galatzer-Levy, Vermetten, Frankova, Carmi, Chaban and Zohar2020).
Methods
Participants
Trauma survivors who were admitted to the emergency department (ED) of a Level-1 Trauma Center after experiencing a DSM-5 criterion A trauma were enrolled into a prospective longitudinal study cohort (n = 221) from 2012 to 2017 at Bellevue Hospital Center, New York City, NY (Schultebraucks et al., Reference Schultebraucks, Shalev and Michopoulos2020). To be included in the study, participants had to be between 18 and 70 years of age and fluent in English, Spanish, or Mandarin. In addition, only participants who did not have an ongoing traumatic exposure such as domestic violence, no evidence of homicidal or suicidal behavior, and who were no prisoners were included in the study. Exclusion criteria included present or past psychotic symptoms, open head injury, coma, or evidence of traumatic brain injury [Glasgow Coma Scale score <13 (Teasdale et al., Reference Teasdale, Maas, Lecky, Manley, Stocchetti and Murray2014)] or no reliable access to electronic mail or telephone. All procedures were reviewed, approved, and monitored by the NYU Institutional Review Board.
Procedure
Two primary outcomes were used in this analysis: (a) provisional PTSD diagnosis and (b) provisional depression diagnosis (yes/no) at 1 month following ED admission. PTSD status was evaluated using the PTSD Checklist for DSM-5 (PCL-5) (Weathers et al., Reference Weathers, Litz, Keane, Palmieri, Marx and Schnurr2013). Depression severity was evaluated using the Center for Epidemiologic Studies of Depression Scale (CES-D) (Eaton, Smith, Ybarra, Muntaner, & Tien, Reference Eaton, Smith, Ybarra, Muntaner, Tien and E2004). A PCL-5 total score ⩾33 and CES-D score ⩾23 was defined as the cut-off for screening positive for a provisional diagnosis of PTSD (Weathers et al., Reference Weathers, Litz, Keane, Palmieri, Marx and Schnurr2013) and provisional depression diagnosis (Henry, Grant, & Cropsey, Reference Henry, Grant and Cropsey2018). We used the qualifier ‘provisional diagnosis’ according to DSM-5: ‘when there is a strong presumption that the full criteria will ultimately be met for a disorder but not enough information is available to make a firm diagnosis’ (American Psychiatric Association, 2013). The PCL-5 shows a ‘good diagnostic utility for predicting a CAPS-5 PTSD diagnosis’ and ‘good structural validity, and sensitivity to clinical change comparable to that of a structured interview’ (Weathers, Reference Weathers2017). In the population of trauma survivors, studies found that ‘CAPS-5 and PCL-5 total scores correlated strongly (r = 0.94)’ (Geier, Hunt, Nelson, Brasel, & de Roon-Cassini, Reference Geier, Hunt, Nelson, Brasel and de Roon-Cassini2019). Both measures have good reliability, convergent, concurrent, discriminant, and structural validity (Weathers, Reference Weathers2017).
Candidate predictors were extracted from a brief qualitative interview that was conducted along with other procedures under laboratory conditions at Bellevue Hospital 1 month following hospital discharge. Patients were asked to respond however they saw fit to the following five questions within a 3 min predetermined time limit for each question: (1) Tell me about your life before the event that brought you to the hospital; (2) Tell me about the event that brought you to the hospital; (3) Tell me about your hospital experience; (4) Tell me about your life since leaving the hospital; (5) What are your expectations about life in the future. Interviewers only asked brief pre-determined follow-up questions when patients stopped responding such as ‘tell me more about that’. Interviews were audio and video recorded with a high-resolution camera mounted behind the interviewer's shoulder to provide a face-on view of the research subject.
Statistical analysis
Initial unsupervised video data processing
Images: For initial processing, each frame was extracted and then broken down to 3 × m × n matrices of m columns and n rows where three matrices represent red, blue, green spectrum extracted from the image using OpenCV (Bradski & Kaehler, Reference Bradski and Kaehler2008) in Python. Each value in each m×n matrix represents a pixel value from light to dark on the corresponding color spectrum.
Data labeling: visual and auditory markers of arousal and mood
Facial features of arousal and mood: Facial expressions of emotion were coded based on visible facial movements. Facial features corresponding to action units (AUs) identified by the Facial Action Coding System (FACS) (Ekman & Friesen, Reference Ekman and Friesen1978) were labeled from raw MP4 video files using the OpenFace package in python (Amos et al., Reference Amos, Ludwiczuk and Satyanarayanan2016), which has a confidence score that is more than 75% for face detection. The extracted raw features were used to compute a Facial Expressivity Score for each emotion (Happiness, Sadness, Anger, Disgust, Surprise, Fear, Contempt), and Peak Expressivity (1, 3, 6, 9, 12, 15 s windows). We also analyzed normalized emotions according to the Emotional Facial Action Coding System (EMFACS), Facial Expressivity Index, and Expressivity Peak Count.
Voice prosody features of arousal: For verbal analysis, PRAAT Software python library Parsel-mouth (Jadoul et al., Reference Jadoul, Thompson and de Boer2018) was used. We analyzed the following parameters: Audio Expressivity Index, Audio Intensity (dB), Fundamental Frequency, Harmonic Noise Ratio, Glottal to Noise Excitation Ratio, Voice Frame Score, Formant Frequency Variability, Intensity Variability, Pitch Variability, Normalized Amplitude Quotient.
Speech content features of arousal and mood: Speech content was extracted with NLP using Receptiviti which uses the LIWC 2015 dictionary (Pennebaker, Boyd, Jordan, & Blackburn, Reference Pennebaker, Boyd, Jordan and Blackburn2015). Extracting features include, for instance, summary language variables, linguistic dimensions, psychological, social, cognitive, perceptual, and biological processes. We further extracted content using DeepSpeech (Hannun et al., Reference Hannun, Case, Casper, Catanzaro, Diamos, Elsen and Coates2014), which is an open-source pre-trained neural network model to extract text from speech. This software identifies features like rate of speech, intent expressivity, emotion label, and word repetition.
Movement features: Movement variables were extracted from raw MP4 video files using the OpenFace package in python (Amos et al., Reference Amos, Ludwiczuk and Satyanarayanan2016; Baltrusaitis et al., Reference Baltrusaitis, Zadeh, Lim and Morency2018). We analyzed head movement, attentiveness, and pupil dilation rate.
For further information on the extracted features, please see online Supplementary Information.
Model development and model validation
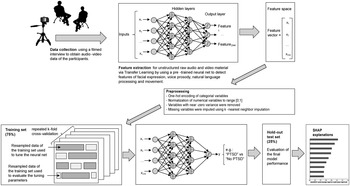
Data were preprocessed using R package caret (Breiman, Reference Breiman1996; Kuhn, Reference Kuhn2008; Kuhn & Johnson, Reference Kuhn and Johnson2013). Categorical variables were dummy coded to binary numerical values (‘one-hot encoding’) and numerical variables were normalized to the range of [0;1]. Variables with near-zero variance were removed. We had ⩽1% missing values. Those missing values were imputed using the k-nearest neighbor algorithm (knnImpute in caret) (Beretta & Santaniello, Reference Beretta and Santaniello2016).
To evaluate the model on data not used to select the model (Hastie, Tibshirani, & Friedman, Reference Hastie, Tibshirani and Friedman2009), we split the total sample into a training (75%) and test set (25%) (see online Supplementary Table S1). We used k-fold cross-validation with 10 folds in the training set to decrease the risk of overfitting (Stone, Reference Stone1974).
For outcome prediction of provisional PTSD and provisional depression caseness at 1 month, supervised classification used a deep neural network with two hidden layers with Rectified Linear Unit (‘relu’) activation (Hahnloser, Sarpeshkar, Mahowald, Douglas, & Seung, Reference Hahnloser, Sarpeshkar, Mahowald, Douglas and Seung2000) and 20 units and an output layer with ‘sigmoid’ binary classification using the Keras library in Python (Chollet, Reference Chollet2018). Optimal weights were determined using ‘adam’ optimization of binary cross-entropy as loss function (De Boer, Kroese, Mannor, & Rubinstein, Reference De Boer, Kroese, Mannor and Rubinstein2005) and precision as the evaluation metric for binary classification.
The pipeline of data analysis is visualized in Fig. 1.
The pipeline of data analysis.

To examine the stability of our results, we additionally used two times repeated nested cross-validation with a 10-fold inner loop and a 10-fold outer loop for prediction of provisional PTSD and depression diagnostic status at 1 month after ED admission.
Additionally, we predicted PTSD and MDD symptom severity using two deep neural networks with two hidden layers with ‘relu’ activation and 20 units and an output layer. Optimal weights were determined using ‘adadelta’ optimization of ‘mean squared error’ as the loss function and mean absolute error (MAE) as an evaluation metric.
Predictive importance ranking
We used Explainable Machine Learning using SHAP (SHapley Additive exPlanation) to identify those features that are mainly responsible for driving the individual outcome prediction. It is an additive feature attribution method that uses kernel functions and currently the gold standard to interpret deep neural networks (Lundberg & Lee, Reference Lundberg and Lee2017).
Results
We extracted 247 features in N = 81 trauma survivors (N = 34, 42.5% female; mean age 37.86 ± 13.99; N = 20, 25% were Hispanic) as shown in Table 1.
Sample characteristics

Predictive model performance
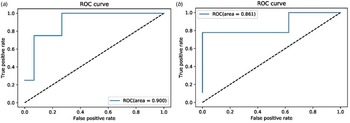
The neural networks achieved good predictive power in the internal test set for predicting the provisional diagnosis (see Fig. 2). The algorithm achieved high discriminatory accuracy to classify PTSD status (AUC = 0.9, weighted average precision = 0.83, weighted average recall = 0.84, weighted average f1-score = 0.83) and MDD status (AUC = 0.86, weighted average precision = 0.83, weighted average recall = 0.82, weighted average f1-score = 0.82) in the internal test set.
Receiver operating characteristic (ROC) curve of the internal test set for predicting (a) PCL-5 cut-off ⩾33 (AUC = 0.90) and (b) CES-D cut-off ⩾23 (AUC = 0.86).

The neural network for predicting PTSD symptom severity obtained a root-mean-squared-error (RMSE) of 10.31, MAE of 6.38, and R 2 = 0.60. For predicting MDD symptom severity, we attained an RMSE of 7.23, MAE of 5.58, and R 2 = 0.62.
Using the classifier obtained using a nested cross-validation approach, we achieved an AUC = 0.88 (weighted average precision = 0.89, weighted average recall = 0.87, weighted average f1-score = 0.87) for predicting MDD status and an AUC = 0.9 (weighted average precision = 0.9, weighted average recall = 0.89, weighted average f1-score = 0.9) for predicting PTSD.
Ranking the features for predictive value
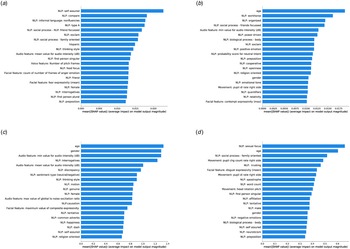
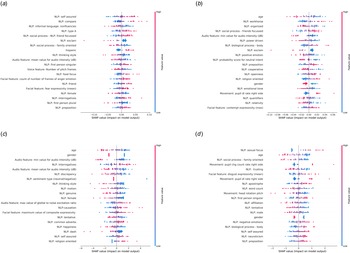
Figures 3 and 4 display the variable importance using SHAP feature ranking. All four domains (face, voice, speech content, and movement) were ranked highly among the 20 most important predictors. The most important predictors for predicting PTSD and MDD status were NLP features, but also features of voice prosody such as audio intensity (PTSD and MDD status), pitch (PTSD status), facial features of emotion (PTSD and MDD status), and movement features, such as pupil dilation rate (MDD status). The most important predictor for PTSD was NPL LIWC ‘self-assured’ followed by NLP LIWC ‘compare’ with the other predictors with similar variable importance (see Fig. 3a). The most important predictor for MDD status was age, followed by NLP LIWC ‘workhorse’ and NLP LIWC ‘organized’ with similar variable importance ranking for the following predictors (see Fig. 3b). We found similar predictive features when predicting PTSD and depression symptom severity at 1 month after ED admission (see Fig. 3c and d). A description of the definition of each feature shown in the variable importance ranking (Figs 3 and 4) can be found in online Supplementary Table S2.
SHAP (SHapley Additive exPlanations) variable importance (Lundberg & Lee, Reference Lundberg and Lee2017) of the Neural Network for the internal test set for predicting (a) PCL-5 cut-off ⩾33, (b) CES-D cut-off ⩾23, (c) PCL-5 symptom severity, and (d) CES-D symptom severity. The mean absolute SHAP value per feature is presented in the bar plot with larger bar plots displaying higher importance of the feature in discriminating between the ‘provisional PTSD diagnosis’ and ‘no PTSD’/‘provisional depression diagnosis’ and ‘no depression’. The variable importance based on SHAP values is calculated by evaluating the model performance with and without each feature included in the model in every possible order.

SHAP (Lundberg & Lee, Reference Lundberg and Lee2017) summary dot plot of the Neural Network for the internal test set for predicting (a) PCL-5 cut-off ⩾33 and (b) CES-D cut-off ⩾23, (c) PCL-5 symptom severity and (d) CES-D symptom severity. The higher the SHAP value of a feature, the higher the log odds of the ‘provisional PTSD diagnosis’/‘provisional depression diagnosis’. On the y-axis, the features are sorted by their general feature importance (see Fig. 4). The dots represent, for each variable value of each participant in the sample, how the variable value influences the attribution of the participant to one of the two outcome classes. Dots that are on the left side shift the classification of participants to the class ‘no PTSD/no MDD’, whereas dots on the right side of the x-axis shift the classification of participants to the class ‘PTSD/MDD’. The color represents the range of the feature values from low (blue) to high (red). For instance, the lower the score for the feature ‘positive emotion’ (NLP), the higher the odds for ‘provisional depression diagnosis’ (Fig. 4b).

Discussion
We utilized CV and NLP, and audio analysis to measure features associated with mood and arousal during free and continuous speech. In keeping with our underlying hypothesis that the integration of multiple sources of information will provide a stronger prediction than one source independently (Schultebraucks & Galatzer-Levy, Reference Schultebraucks and Galatzer-Levy2019), we utilized a deep learning neural network approach. By analogy, a clinician interviewing a patient will integrate visual, auditory, and linguistic information to assess a patient. Experienced clinicians will process many more channels of information, can make use of context-dependent prior clinical experience, and will be able to form an empathetic therapeutic alliance. Although no algorithm is able to capture this level of skilled clinical expertise, there are common and much more fundamental clues of overt behavior that can be objectively encoded using digital methods and the development of such tools can further support clinicians by providing objective access to behavioral clues that are otherwise automatically processed by humans and often not perceived with deliberate attention. The encoding of such objective information about overt behavioral clues of visual, auditory, and linguistic information can be formalized and deployed in a reproducible manner using neural network architecture that encodes high dimensional representations of the relationship between multiple features (i.e. face, movement, speech, and language). The features that we found to be most important for the classification of provisional PTSD and MDD corroborated pre-existing findings reported in the current literature. We extended those findings to demonstrate that integrated features from different modalities, i.e. face, voice prosody, speech content, and movement, all contribute uniquely to the classification and prediction of both MDD and PTSD.
A significant body of research has identified facial, vocal, and motor movement markers of neuro-psychiatric functioning (Bernard & Mittal, Reference Bernard and Mittal2015; Cannizzaro et al., Reference Cannizzaro, Harel, Reilly, Chappell and Snyder2004; Cohn et al., Reference Cohn, Kruez, Matthews, Yang, Nguyen, Padilla and De la Torre2009; Eichstaedt et al., Reference Eichstaedt, Smith, Merchant, Ungar, Crutchley, Preoţiuc-Pietro and Schwartz2018; Gaebel & Wölwer, Reference Gaebel and Wölwer1992; Gehricke & Shapiro, Reference Gehricke and Shapiro2000; He et al., Reference He, Veldkamp and de Vries2012; Kleim et al., Reference Kleim, Horn, Kraehenmann, Mehl and Ehlers2018; Lu et al., Reference Lu, Frauendorfer, Rabbi, Mast, Chittaranjan, Campbell and Choudhury2012; Pestian et al., Reference Pestian, Nasrallah, Matykiewicz, Bennett and Leenaars2010; Quatieri & Malyska, Reference Quatieri and Malyska2012; Renneberg et al., Reference Renneberg, Heyn, Gebhard and Bachmann2005; Sobin & Sackeim, Reference Sobin and Sackeim1997; van den Broek et al., Reference van den Broek, van der Sluis, Dijkstra, J, M and M2010; Yang et al., Reference Yang, Fairbairn and Cohn2013). These characteristics relate to core symptomatology across diverse disorder including posttraumatic stress and depression as well as resilience (Cannizzaro et al., Reference Cannizzaro, Harel, Reilly, Chappell and Snyder2004; Cohn et al., Reference Cohn, Kruez, Matthews, Yang, Nguyen, Padilla and De la Torre2009; France et al., Reference France, Shiavi, Silverman, Silverman and Wilkes2000; Gaebel & Wölwer, Reference Gaebel and Wölwer1992; Gehricke & Shapiro, Reference Gehricke and Shapiro2000; He et al., Reference He, Veldkamp and de Vries2012; Kleim et al., Reference Kleim, Horn, Kraehenmann, Mehl and Ehlers2018; Leff & Abberton, Reference Leff and Abberton1981; Pestian et al., Reference Pestian, Nasrallah, Matykiewicz, Bennett and Leenaars2010; Quatieri & Malyska, Reference Quatieri and Malyska2012; Renneberg et al., Reference Renneberg, Heyn, Gebhard and Bachmann2005; van den Broek et al., Reference van den Broek, van der Sluis, Dijkstra, J, M and M2010; Yang et al., Reference Yang, Fairbairn and Cohn2013). In addition to informing psychopathology, these markers also provide information about CNS mechanisms that may affect clinical functioning and identify treatable targets for intervention. Visual and auditory markers have long been associated with mood and arousal, which in turn, represent core features of posttraumatic stress pathology including PTSD and depression (Otte et al., Reference Otte, Gold, Penninx, Pariante, Etkin, Fava and Schatzberg2016; Shalev, Liberzon, & Marmar, Reference Shalev, Liberzon and Marmar2017).
Our classification algorithm, based on participants' free discussion of their trauma experience, identified many of the features previously found to be predictive. For example, consistent with the literature, we observed that higher fear-expressivity and anger-expressivity were important for the classification of PTSD while higher contempt-expressivity was predictive of MDD (Ekman & Friesen, Reference Ekman and Friesen1978; Ekman et al., Reference Ekman, Matsumoto, Friesen, E and EL1997). Similarly, consistent with the literature, we found that the increased use of first-person singular pronouns provided probabilistic information in classifying PTSD (Kleim et al., Reference Kleim, Horn, Kraehenmann, Mehl and Ehlers2018) and that reduced frequency of positive words predicted depression (Pennebaker, Mehl, & Niederhoffer, Reference Pennebaker, Mehl and Niederhoffer2003; Rude, Gortner, & Pennebaker, Reference Rude, Gortner and Pennebaker2004) while lowered audio intensity and reduced pitches per frame was relevant to the classification of PTSD (Marmar et al., Reference Marmar, Brown, Qian, Laska, Siegel, Li and Smith2019). This concordance with existing literature provides important validation of the probabilistic information used by our classification algorithm.
Extracting features from unstructured video data sources offers several important advantages. Beginning with the introduction of the research diagnostic criteria (Spitzer, Endicott, & Robins, Reference Spitzer, Endicott and Robins1978), which aimed to align clinical research and practice around objective criteria, visual and auditory signs were either measured through expert rating or through introspective self-report. While this created standardization, it was limited by the need for a rigid structure to assess symptoms, challenges of inter-rater reliability, subjective error in assessment, and significant assessment time burden. Our results successfully demonstrate ‘proof-of-concept’ by showing that clinical features measured without a rigid assessment structure yield discriminatory accuracy to classify provisional PTSD or MDD diagnostic status. The results are based on clinical signs captured from free exchanges with a para-professional. Further, multiple signs can be assessed simultaneously, reducing the assessment burden. The use of algorithms to code clinical signs also obviates issues of inter-rater reliability as the algorithm performs identically each time. The use of algorithms rather than rating scales provides a real number metric rather than a ranking of severity. The use of real numbers, by definition, increases the sensitivity of the metric. Finally, the use of audio and video data sources is scalable as it can be integrated into cellphones and web-based telemedicine applications. This can greatly increase the reach of assessment of clinical functioning.
There are also some limitations to note. Most importantly, the sample size will caution against the direct generalization to other samples without replication. Future studies might benefit from incorporating additional contextual information and feedback from experienced clinicians into the analysis. Our approach successfully combined multiple information channels such as facial emotion expression with NLP sentiment analysis based on word frequencies. This already provides contextual information across different modalities since facial expression complement characteristics of speech and audio modalities. However, with the benefits of larger samples, it will be useful to go beyond word frequencies by identifying predictive features of sentence-level meaning units and to directly test for cross-modal interactions of facial expressions and verbal expressions of emotion. While the current algorithm internally accounts for possible non-linear dependence between modalities in a data-driven way, the current approach is limited by not explicitly testing potential interactions between features and modalities. The variable importance ranking highlights the features that were, on average, most important to discriminate between ‘PTSD’ or ‘MDD’ and ‘no PTSD’ or ‘no MDD’ respectively. However, since the classification is only achieved by the combination of all variables together, the interpretation of univariate associations is limited and should not be interpreted causally. Larger samples are required to corroborate our results and also to directly test for interactions between facial and verbal modalities that provide an important opportunity to incorporate the rich clinical expertise of experienced clinicians. Moreover, the current study was focused on the classification of ‘PTSD’ v. ‘no PTSD’ and ‘MDD’ v. ‘no MDD’ while it would also be clinically relevant to discriminate between ‘PTSD’ and ‘MDD’ which remains an important desideratum for further studies. Another limitation is the reliance on pre-trained models for feature extraction. While we used state-of-the-art methods, there are known limitations and risk of bias that need to be pointed out with regard to facial expression recognition (Buolamwini & Gebru, Reference Buolamwini and Gebru2018; Klare, Burge, Klontz, Bruegge, & Jain, Reference Klare, Burge, Klontz, Bruegge and Jain2012) and NLP (Caliskan, Bryson, & Narayanan, Reference Caliskan, Bryson and Narayanan2017).
The next step is to further gauge the predictive performance of the digital biomarkers in larger samples and, most importantly, in diverse and heterogeneous patient populations. To go beyond ‘proof-of-concept’, rigorous testing in a large confirmatory study design is warranted for extensive clinical validation (Mathews et al., Reference Mathews, McShea, Hanley, Ravitz, Labrique and Cohen2019).
Conclusion
This study presented an approach that robustly and accurately predicted mental well-being in trauma survivors using an automated, scalable and ecologically valid method. Our proof-of-concept analysis requires further development and validation in independent samples. Nonetheless, the results demonstrated that construct-valid features such as facial affect, movement, speech content, and prosody can be captured in minimally structured contexts to accurately quantify clinical functioning. These results hold significant implications for how deep learning-based methods can automate and scale clinical assessment. Our results also suggest implications for the fields' ability to put a clinical focus on discrete behavioral and physiological dimensions as metrics of risk and treatment response consistent with the research domain criteria approach (Cuthbert & Insel, Reference Cuthbert and Insel2013; Insel, Reference Insel2014; Insel et al., Reference Insel, Cuthbert, Garvey, Heinssen, Pine, Quinn and Wang2010). The emphasis on directly observable behavior and physiology shifts the attention away from a narrow focus on psychiatric diagnostic classifications that are known to be heterogeneous and lack a biological basis (Galatzer-Levy & Bryant, Reference Galatzer-Levy and Bryant2013). Remote assessment based on digital markers is, for instance, important in the context of trauma exposure in inaccessible areas after natural catastrophes or unsafe terrain such as warzone or areas of humanitarian crises, which often affect individuals who are distant from appropriate clinical services (Carmi et al., Reference Carmi, Schultebraucks, Galatzer-Levy, Vermetten, Frankova, Carmi, Chaban and Zohar2020). There is a high potential for the future use of remote assessment using digital biomarkers in these circumstances and the here presented proof-of-principle demonstration of digital biomarkers for PTSD and MDD warrants further investigation in larger samples and diverse clinical contexts. Ultimately, digital biomarkers bear great promise to improve current telemedicine services to provide digital diagnostic screening at scale.
Supplementary material
The supplementary material for this article can be found at https://doi.org/10.1017/S0033291720002718.
Financial support
K.S. was supported by the German Research Foundation (SCHU 3259/1-1). The study was also supported by K01MH102415 (I.R.G.-L.).
Conflict of interest
I.R.G.-L. and V.Y. receive salary from AiCure. I.R.G.-L. and V.Y. have no stocks. All other authors declare no potential conflict of interest that is relevant to this article.
Ethical standards
The authors assert that all procedures contributing to this work comply with the ethical standards of the relevant national and institutional committees on human experimentation and with the Helsinki Declaration of 1975, as revised in 2013.