I. INTRODUCTION
Additive manufacturing (AM) or 3D printing is the technology of building three-dimensional objects layer-by-layer using computer-aided designs (CAD). Reference Kruth, Leu and Nakagawa1 It is capable of fabricating complex three-dimensional objects, which cannot be produced using conventional manufacturing techniques. It consists of several classes of processes, including extrusion, powder bed fusion, vat photopolymerization, and importantly, material jetting (MJ), based on ink jet techniques. Reference Kruth, Leu and Nakagawa1–Reference He, Wildman, Tuck, Christie and Edmonson8 This latter process is significant, since it is one of the most promising routes to AM based multi-material (MFAM) production. Both extrusion and MJ methods have been used to develop MFAM, with extrusion showing interesting developments in terms of biological material scaffolds in tissue engineering Reference Domingos, Intranuovo, Russo, De Santis, Gloria, Ambrosio, Ciurana and Bartolo9,Reference Patrício, Domingos, Gloria, D’Amora, Coelho and Bártolo10 amongst other applications. The fundamental difference between extrusion and MJ is the mode of delivery, where extrusion is capable of delivering relatively highly loaded or higher molecular weight materials but at lower resolution than MJ. Should MFAM be realized, it will lead to the production of new multifunctional products, including those in the electronics, bio-printing, and pharmaceutical industries. One mode of ink jet printing is reactive ink jet (RIJ). RIJ involves the deposition of one or more liquid raw materials onto the same location, after which a chemical interaction is activated, producing a new material in situ to the manufacturing process. Reference Hart, Li, Sturgess, Wildman, Jones and Hayes11,Reference Fathi and Dickens12 One common method is to use materials that are able to crosslink under the application of ultra-violet (UV) light. Commercial machines are now available where the UV source is in line with the printing head, leading to the creation of material on a layer-by-layer basis. In this regard, there are similarities to stereolithography (SLA), which also relies on UV based solidification mechanisms. Reference Kulkarni and Manners13–Reference Melchels, Feijen and Grijpm16 This layer-by-layer synthesis approach however, whilst it has advantages in being able to readily access forms not achievable by traditional manufacturing methods, is not well understood, particularly in relation to the distribution of material properties, both temporally and spatially. Recently it has been shown that mechanical testing methods can be combined with finite element (FE) based solid mechanical models to create an inverse FE method (IFEM) for characterizing complex material properties. Reference Dao, Chollacoop, Van Vliet, Venkatesh and Suresh17–Reference Hamzah, Subit, Boruah, Forman, Crandall, Ito, Ejima, Kamiji and Yasuki22 This method is particularly useful when combined with nanoindentation as the test enables the spatial distribution of properties to be investigated whilst the IFEM enables access to material models not available in the standard forward analysis of nanoindentation data. Reference Clifford and Seah23–Reference Chen, Ashcroft, Wildman and Tuck28 This technique has been described previously by the authors in the analysis of 3D ink jet based printed objects to identify spatial variation in properties. Reference Chen, Ashcroft, Wildman and Tuck28 All methods and applications using the IFEM technique require selection of the right material constitutive model since without it, it is not possible to describe the mechanical behavior of the material in question. In Ref. Reference Chen, Ashcroft, Wildman and Tuck28, four different material constitutive models were used: linear viscoelastic (VE), nonlinear viscoelastic (NVE), viscoelastic–viscoplastic (VEVP), and nonlinear viscoelastic–viscoplastic (NVEVP). The work showed that the NVEVP material model offers the best approximation for the material used in that study. What was also evident from this work were the strong spatially varying properties in the printed materials and as a consequence, it was proposed that the time and spatial dependence of these materials should be examined.
In this paper, the IFEM based method will be used to investigate the time and spatially varying material properties of a 3D ink jet printed object. The methodology for preparing samples and their analysis will be presented first, followed by an analysis of the variation of mechanical properties, both with and without post-curing. Finally an assessment will be made of possible errors that can be introduced into the analysis by the presence of fixing agents and property gradients during the experimental testing.
II. EXPERIMENTAL STUDY
A. Samples preparation and nanoindentation
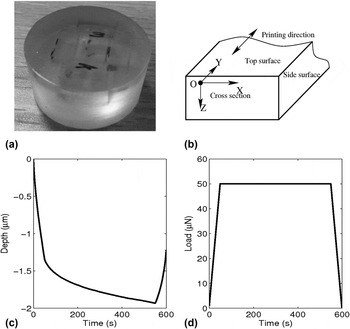
All materials within this work were printed using a Stratasys Objet Connex 260 3-D printer system. The ink used was VeroClear Fullcure 810 (Stratasys Ltd., Eden Prairie, Minnesota). This ink is available in the liquid state and then cured to form a solid through exposure to suitable UV light. To prepare samples, the inks were printed into 40 × 10 × 5 mm3 rectangular sections; the solid samples were then chopped into small cuboid pieces using a hand saw. Initial polishing was performed on each piece to remove a layer of material on each chopped surface, to avoid the possible detection of mechanical hardening caused by chopping. These small pieces were mounted on Epofix resin, using Epofix hardener as a crosslink agent, at a 15:2 volume ratio in a cylindrical sample mold kept at room temperature. The mounted sample was allowed to harden for at least 8 hours which was followed by grinding and polishing, to produce a mountable sample ready for nanoindentation. Figure 1(a) shows an example of one of these samples. It is a cylinder with both the diameter and height of around 30 mm, containing several VeroClear cuboid solids within the sample. Each surface was clearly marked to ensure the correct orientation was achieved and was observable under the microscope of the indentation machine [Fig. 1(a)].
(a) Image showing a sample prepared for nanoindentation testing. (b) Diagram demonstrating notations and the coordinate system used in this paper. (c) Typical depth versus time curve obtained from a nanoindentation test and (d) the applied load versus time curve.

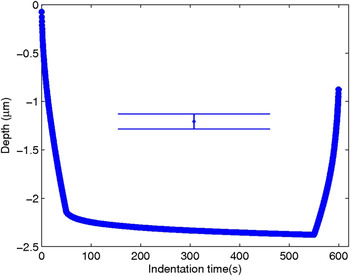
Nanoindentation tests were conducted on a NanoTest600 instrument (Micro Materials Limited, Wrexham, United Kingdom). The machine is housed in a polymethyl methacrylate (PMMA) enclosure to separate the instrument from environmental perturbations. In our study, the loading pattern was fixed and a typical depth versus time curve was obtained [Figs. 1(c) and 1(d)]. The loading time was set at 50 s, during which the indentation load linearly increased from zero to a maximum, after which the indentation load was maintained for 500 s to allow the material to creep. In the last 50 s, the indentation load was linearly decreased from maximum to zero, resulting in the recovery of elastic deformation. The aim of the IFEM is to extract the optimal local material property parameters from the depth–time curve under a given load for a specified material constitutive model.
B. Post-curing UV illumination conditions
To investigate any material property changes after production, nanoindentation tests with post-cured samples were also performed. To achieve this, the samples were exposed to a UV light source in a test chamber. A Q-Sun UV oven xenon test chamber (Q-Lab Corp., Westlake, Ohio) was used for this purpose, which allowed the exposure of the sample with UV light at a wave length of 340 nm at a prescribed level of 0.68 W/m2 and temperature of 50 °C. The prepared VeroClear cuboids were exposed to UV light between 2.5 min and 40 h. Control experiments were performed on samples sealed in the aluminum foil. The samples and their controls were mounted with epofix resin at room temperature to form nanoindentation samples ready for sanding and polishing. When not under testing, samples were stored within an air-conditioned environment, wrapped with dry tissue paper, and covered with the aluminum foil to avoid further UV exposure.
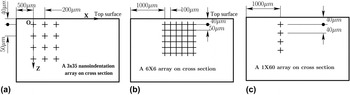
Figure 2 shows the schematic experimental protocols used in indentation tests for samples without post-curing [Figs. 2(a) and 2(b)] and for samples with post-curing [Fig. 2(c)]. The maximum indentation load was given by two values, first at 50 mN for the samples with UV post-curing up to and equal to 60 min, and at 75 mN for post-curing greater than 60 min, to allow maximal indentation depth at the same level for all samples, and thus keeping the signal to noise ratio and surface roughness effects at the same level for all samples.
Typical schematic protocols applied during nanoindentation. Diagram (a) shows the indentation protocol of a 3 × 35 array used to map the material property z-depth dependence, (b) is the protocol for a 6 × 6 array of indentations used to check the x independence of the material property on a cross section and (c) illustrates the protocol of a 1 × 60 test array used to map the material property with z-depth for post-cured samples.

III. RESULTS
A series of experiments were performed to determine the x and z dependence of the material properties and the effect of additional UV curing post-deposition. Table I shows the experiments performed and the relevant properties and conditions.
Details of indentation arrays on sample cross sections for experiments performed without and with post-curing.

A. Material property variation following 3D printing
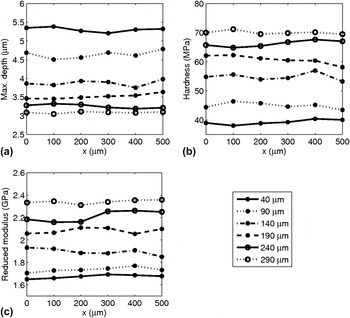
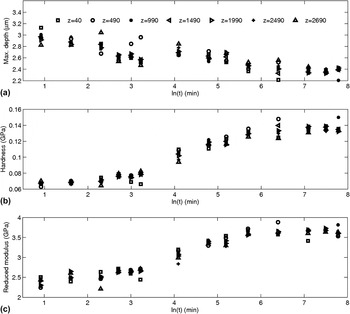
The dependence of material properties on the x- and z-position was first examined by conducting a 6 × 6 indentation array test on a sample cross section [Fig. 2(b)] mapping along both the x and z directions. Figure 3 shows the maximum indentation depth, hardness, and reduced modulus for various x locations and z-depths. It can be seen that in the x direction, the properties were broadly constant but that there is a large variation in all properties as a function of depth. The legend in the figure shows the distance of indentation location to the top surface of the sample and it can be seen that closer to the top surface, the maximum indentation depth increases and both the hardness and reduced modulus decrease. This indicates that a greater degree of cure has been experienced by the material at a larger depth from the top surface, which is explored in more detail below.
Results of nanoindentation performed on the cross section of a sample in the x direction. Diagrams (a), (b), and (c) show the achieved maximum depth, hardness, and the corresponding reduced modulus, respectively. The legend shows the z-depth from the top surface for each indentation.

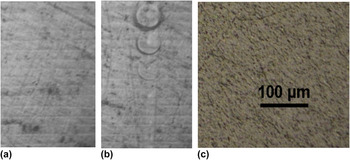
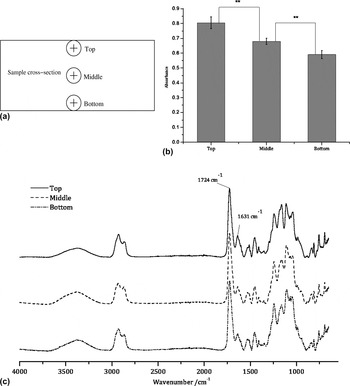
It is hypothesized that the observed z-depth dependency in the material properties is closely related to the material manufacturing procedure deployed in the MJ process. This is emphasized by the appearance of clear interfaces between layers as seen in the polished cross section in Fig. 4(a). Figure 4(b) shows the same surface after indentation and it can be seen that there are larger and more defined indents closer to the top surface of the sample, reinforcing the data in Fig. 3 and the observed trend that the layers nearer the top surface are softer. However, the layers are no longer visible after post-curing with UV light. The VeroClear ink was jetted layer-by-layer using the Objet260 Connex system. The modus operandi of the system is to print material which is then almost immediately exposed to UV light which initiates a crosslinking reaction in the polymer. Since VeroClear has a degree of transparency in the UV region used to initiate the crosslinking reaction, when a subsequent layer of material is printed, the initial layer of the material will be exposed to further UV irradiation albeit to a lesser extent due to absorption of some of the incident light by the second layer. It is thought, however, that this multiple pass of UV light will result in further cross-linking of previous layers resulting in a degree of cross-linking strongly dependent on z. To test this idea of depth dependent cross-linking, an experiment was performed to examine the degree of cross-linking using a Fourier transform near infrared (FTIR) spectrometer (PerkinElmer Inc., Waltham, Massachusetts). The degree of cross-linking at the top, middle, and bottom locations (0, 0.5, and 3 mm from the top surface, respectively) on a sample cross section was compared using a field of view of ∼1 mm2, which although not able to provide the quantitative analysis of the chemistry with the resolution over which depth changes are likely to occur, will indicate coarse changes in chemistry. Figure 5 shows the absorbance due to C=C bonds at the top, middle, and bottom locations [Fig. 5(a)] on the sample cross section, with the bottom region showing significantly lower absorbance, indicating a greater degree of crossl-inking in layers deposited earlier. This behavior can be captured in a simple, discrete model of absorption as follows.
Surface textures in sample sections prepared for nanoindentation (a) as removed from the 3D printer and sectioned, (b) with residual indentation marks, and (c) cross section condition with 5 min post-curing with UV light with an intensity of 0.68 W/m2.

(a) Measurement locations on a sample cross section. (b) Comparison of absorbance of C=C bond at 1631 cm−1 and different locations (mean ± standard deviation, n = 4, *P < 0.05, **P < 0.01, ***P < 0.001). (c) Spectrum examples scanned from different locations.

The initial concentration of a reactant (such as readily available photo-initiator available for interaction with a photon) is c 0, and the UV light intensity incident upon the uppermost layer is I 0. Following the illumination of the sample with UV light for a duration of Δt, a chemical reaction occurs and a concentration change in the current printing layer will result, giving Reference Sheats, Diamond and Smitht29
 $$\Delta {c_0} = - k{I_0}{c_0}\Delta t\quad ,$$
where k is a constant of proportionality that relates the change in concentration to the state of the illuminating light and the material condition, and Δc 0 is the change of concentration due to the first illuminating. Therefore, the concentration of reactant, c 1, immediately after the first pass, in layer 1, is given by
 $${c_1} = {c_0} + \Delta {c_0} = {c_0}\left( {1 - k{I_0}\Delta t} \right)\quad .$$
When another layer is deposited onto the already printed first layer, the UV light intensity incident on the first printed layer (now the bottom layer) is I 1 = αI 0 where α ≤ 1 as a result of absorption of the material when passing through the current printing layer, leading to a change in the concentration of
 $$\Delta {c_1} = - k{I_1}{c_1}\Delta t\quad ,$$
so that when the second deposition is finished, the concentration in the first printed layer becomes
 $${c_2} = {c_0}\left( {1 - k{I_0}{\alpha ^0}\Delta t} \right)\left( {1 - k{I_0}{\alpha ^1}\Delta t} \right)$$
where the superscripts reflect the changing conditions of each layer, leading to possible variation in absorption coefficients. Generally, when the nth layer printing is finished, the resultant concentration of the first printed layer is
 $${c_n} = {c_0}\left( {1 - k{I_0}{\alpha ^0}\Delta t} \right)\left( {1 - k{I_0}{\alpha ^1}\Delta t} \right) \ldots \left( {1 - k{I_0}{\alpha ^{n - 1}}\Delta t} \right)\quad .$$
In this work, it is assumed that the material interacts only weakly with the incident radiation, allowing us to simplify to one value of α for all layers of the material. Plotting Eq. (5) and comparing it with an exponentially decaying function showed good agreement, allowing further simplification and parameterization of the behavior with phenomenological constants. Mechanical properties are known to be linked to the degree of completion of the cross-linking process, Reference Liu and Huglin30 thus it is reasonable to characterize these using a similar form of equation. Therefore, it is assumed that all properties will show a depth dependency of the form
 $$R = {R_0}\left[ {1 - \exp \left( { - {Z \over {{Z_0}}}} \right)} \right] + {R_1}$$
where R is a material parameter, and R 0, z 0, and R 1 are material constants. These were determined by non-linear regression, as discussed in Sec. III B.
B. IFEM derived properties of 3D printed material
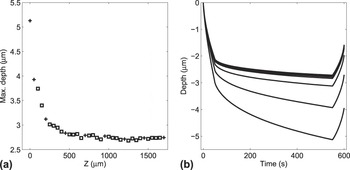
Since the x axis dependence of material properties has been shown to be insignificant, and there are clear dependencies in the z direction, from hereon the x dependence is neglected and all properties will be assumed to be z dependent only. To more fully map the z-depth dependence of material properties, indentations were conducted on the cross section of a sample with an array of 35 indentations in the z direction to investigate the depth dependence and 3 in the x-directions for averaging [see Figs. 1(b) and 2(a)]. The distance between adjacent rows was 50 μm, the separation between columns was 200 μm, and the distance from the first column to the closest side surface of the sample was 500 μm. The distance from the first indentation to the top surface for each column was around 40 μm. The schematic of the indentation protocol is given in Fig. 2(a). The decrease in the maximum depth of the indentations with respect to depth below the top surface from this array is shown in Fig. 6(a).
(a) The maximum depth achieved with 50 mN indentation load, and the indentations and locations that will be used in IFEM, marked by crosses. (b) and depth versus time curves used in IFEM. The curves correspond to the crosses in (a).

In Ref. Reference Chen, Ashcroft, Wildman and Tuck28, a number of constitutive models were explored for possible descriptions of a VeroClear 810 ink jet printed material. In this work, we selected a NVEVP based model, which was shown to perform as well or better than other choices. Using the IFEM technique developed in Ref. Reference Chen, Ashcroft, Wildman and Tuck28, the spatially varying constitutive properties of VeroClear 810 were determined. This method has benefits over those using direct nanoindentation parameters, since the parameters are intrinsic and can be utilized in any future predictive model based on the same constitutive relationships. Figure 6(b) shows the indentation depth–time curves at selected z-depths [indicated by the crosses in Fig. 6(a)] that were used to determine the material parameters using the IFEM described in Ref. Reference Chen, Ashcroft, Wildman and Tuck28.
The basis of the NVEVP model is a VE model, where the viscous stress tensor
 ${\boldsigma '_i}(t)$
related to g
i
is computed from
 $${\boldsigma '_i}\left( t \right) = {g_i}{G_0}\int_{\rm{0}}^{\rm{t}} {{\rm{exp}}\left( { - {{t - \tau } \over {{\tau _i}}}} \right)\dot \boldvarepsilon '\,{\rm{d}}\tau } \quad ,$$
where t is time, g i is the relative relaxation modulus and correspondingly, τ i is the relaxation time, G 0 is the instantaneous modulus, and ϵ′ is deviatoric strain tensors. If it is assumed that the strain rate does not change significantly (such as in the case of a nanoindentation test), then Eq. (7) can be simplified to
 $${\boldsigma '_i}\left( t \right) \approx {g_i}{G_0}\dot \boldvarepsilon '\int_0^t {\exp \left( { - {{t - \tau } \over {{\tau _i}}}} \right){\rm{d}}\tau } = {g_i}{G_0}\dot \boldvarepsilon '{\tau _i}\left[ {1 - \exp \left( { - {t \over {{\tau _i}}}} \right)} \right]\quad .$$
It can be seen from Eq. (8) that the product of g
i
and τ
i
approximately determines the amplitude of the viscous stress tensor
 ${\boldsigma '_i}\left( t \right)$
while τ
i
shows the effective time range of the change of
 ${\boldsigma '_i}\left( t \right)$
is approximately from 0 to τ
i
; after t > τ
i
,
 ${\boldsigma '_i}\left( t \right)$
is nearly constant. Thus it can be said that the greater the product of g
i
and τ
i
is, the more viscous the material is; the higher τ
i
is, the longer the change of viscous stress remains. In Ref. Reference Chen, Ashcroft, Wildman and Tuck28, this basic model was expanded to include non-linear terms β1, β2, and β3, and viscoplastic terms that represent the yield stress σh and the strain rate sensitivity parameter, η. Readers are referred to Ref. Reference Chen, Ashcroft, Wildman and Tuck28 for more detail on these relations.
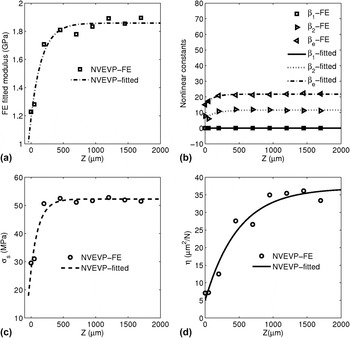
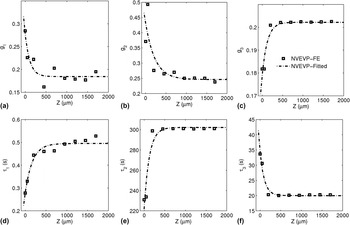
The depth dependent modulus determined by NVEVP based IFEM is shown in Fig. 7(a), in which the reference data were obtained from indentation tests with a 50 mN maximum load, as shown by Fig. 6(b). The relative relaxation moduli change and relaxation times over z are shown in Fig. 8, but it is seen that the relaxation times do not change significantly with z [Fig. 8(d)–8(f)]. The variation of the material property is, in this case, mainly represented by the change of instantaneous modulus and relative relaxation moduli, such as g 2 and g 3. Figure 8 illustrates that generally, exposure to UV radiation reduces the viscous component of stress [see Eq. (8)].
Typical material parameters of RIJ printed VeroClear achieved by IFEM: (a) Instantaneous modulus as a function of z, determined using the NVEVP material constitutive models, (b) nonlinear coefficients obtained by fitting the NVEVP model and subsequently Eq. (6), (c) initial yield stress, and (d) the viscoplastic parameter, η, as a function of z.

Typical viscoelastic relaxation parameters for the reactive ink-jetted VeroClear material extracted via a NVEVP constitutive model based IFEM method. Diagrams (a), (b), and (c) show the variation of relative relaxation moduli as a function of z and (d), (e), and (f) show the z dependency of the corresponding relaxation times. The curves represent the best fit of Eq. (6) to the spatially varying IFEM determined material properties.

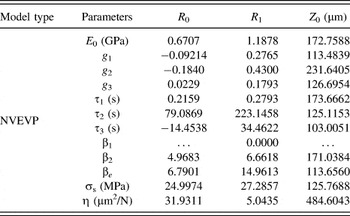
The material property parameters are fitted with the exponential function given by Eq. (6), by nonlinear regression, and are shown by curves in Figs. 7 and 8. The obtained material parameter results are shown in Table II.
Range of phenomenological z-dependent material parameters determined by best fitting of Eq. (6) to the spatially varying IFEM determined material properties.

C. Material property evaluation of samples with post-deposition curing
A preliminary experiment to observe the change that may arise with further UV exposure showed that the layer interfaces were no longer visible [Fig. 4(c)]. This suggests that post-curing can lead to the integration of the layers of material, most likely due to cross-linking between layers, creating covalent links, and homogenizing the material. In addition, it demonstrates that further curing over the whole depth of the material may occur, not just at the relatively low modulus upper surface.
Samples with additional UV curing time were indented with a 1 × 60 indent map [Fig. 2(c)]. The indentation array was located 1000 μm from its nearest side surface for each test. The distance of the first indentation to the top surface was around 40 μm, and the separation of the two indentations next to each other was 40 μm.
Figure 9 shows the experimentally determined material dependent parameters as a function of the time of exposure. It can be seen that as the duration of exposure lengthens, the modulus and hardness increase and correspondingly, the maximum depth of penetration for a given load decreases. This trend is observed for all z-positions. What is also observed is that, although the z-depth dependence is greatly reduced, even at large z-values the modulus and hardness increase, suggesting that curing during manufacture is not close to completion with respect to fully saturated cross-linking. This correlates with the observation that the interfaces at all depths are eliminated with further UV exposure on the cross section [Fig. 4(c)] and that the C=C absorption does not go to zero even at the bottom of the sample (Fig. 5).
Indentation test results for samples with increasing duration of UV exposure. (a) shows the maximum indentation depths for given loads (50 mN for aging ≤60 min & 75 mN for aging >60 min), (b) shows the variation of hardness, and (c) shows the variation of the reduced modulus under the same conditions.

Two loads were used for the indentations (Sec. II. B), 50 mN and 75 mN for aging durations of <60 min and >60 min, respectively. One consequence of this difference is that an accurate comparison of aging at short and long times in the context of indentation parameters is not reliable, since there are often load dependent effects that arise. Reference Milman, Golubenko and Dub31
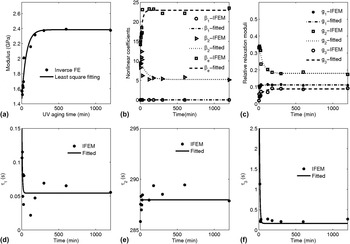
Further, the nanoindentation depth versus time curves over the range of z explored were averaged to obtain mean values of the IFEM derived material parameters (Fig. 10). These average parameters were then plotted as a function of the aging time to observe the dependence on the UV exposure duration. In a pattern similar to that observed in Figs. 7 and 8, the material properties tend to vary with aging time, plateauing toward an asymptotic behavior as the duration becomes long (Fig. 11).
Average of indentation depth–time curve with errorbar for a sample with 20 h post-curing and 75 mN indentation load, which is used as a reference data set in IFEM for the post-cured sample, where the insert shows the typical error in the curve.

(a) Instantaneous modulus of VeroClear with further UV curing, evaluated by IFEM with the NVEVP material constitutive model, Reference Milman, Golubenko and Dub31 (b) the corresponding nonlinear constants of β1, β2, and β e , (c) relative relaxation moduli, (d), (e), and (f) relaxation times of τ1, τ2, and τ3, respectively.

Illumination in the UV chamber raises the temperature to 50 °C. To see the effect of this temperature change, control samples were produced, wrapped in the aluminum foil, and placed in the UV test chamber alongside samples open to the UV light. No significant variation with duration of exposure to the heat in the chamber was found (figure not shown).
To better understand the observed time dependence of material properties, a phenomenological description of the z-averaged behavior was adopted. Since the probability of absorption per photo-initiator molecule is likely to be constant at the surface, it is reasonable to expect an exponential variation in availability of absorbers over time, and a consequent exponential change in material properties, such that
 $$\bar R = {\bar R_0}\left[ {1 - \exp \left( { - {t \over {{t_0}}}} \right)} \right] + {\bar R_1}\quad ,$$
where
 $\bar R$
is a material parameter determined by IFEM,
 ${\bar R_0}$
,
 ${\bar R_1}$
, and t
0 are regression constants, where t
0 is a parameter that represents the time it takes for a parameter to decay by e. This enables the material parameter variation to be simply characterized with time through t
0. The fitted parameters are shown in Table III. Reflecting the increase in modulus with time, Fig. 11(a) shows that the instantaneous modulus determined by IFEM increases with duration of aging. The nonlinear coefficients (β1, β2, and β
e
Reference Chen, Ashcroft, Wildman and Tuck28
) also respond to the additional UV illumination, indicating a change in the degree of non-linearity with curing.
Phenomenological constants reflecting the variation in material properties with aging, determined by fitting Eq. (9) to IFEM derived average parameters.

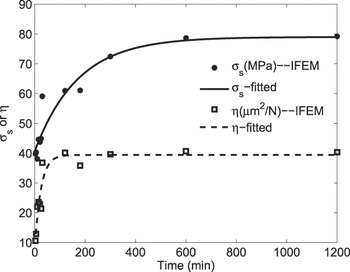
The changes in the viscous part of the material behavior can be observed from the relaxation moduli and their corresponding relaxation times. The relaxation time τ2 associated with g 2 is two orders of magnitude greater than τ1 and τ3, suggesting that g 1 and g 3 can be neglected in comparison to g 2 (Fig. 11). The reduction in g 2 with curing time indicates a tendency for the material to become less viscous with aging, and less susceptible to processes such as creep. The viscoplastic behavior of the material also varies with aging, with the yielding stress increasing with curing time (Fig. 12). Once again, this indicates a loss of plasticity with aging. However, the increase in viscoplastic parameter η (Fig. 12) also suggests that the material becomes more elastoplastic with curing.
The change in initial yield stress, σs, and viscoplastic parameter, η, with post-curing time.

D. Effects of material interfaces and material property gradients
One aspect that must be resolved before being able to attribute the near surface variation in observed properties to changes in the material behavior is an evaluation of whether performing tests near to the interface between the high modulus Epofix support resin and the VeroClear 810 resin, in addition to the presence of material property gradients, may skew the observed results. To address this question, a limited number of fully 3D numerical experiments were performed, which enabled an interface and gradients to be specified. This approach is vastly more computationally intensive than the axisymmetric domain and was only used to determine the degree of bias owing to interfacial and gradient effects.
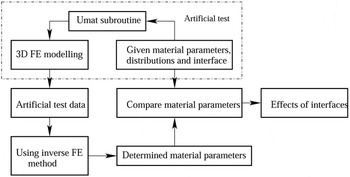
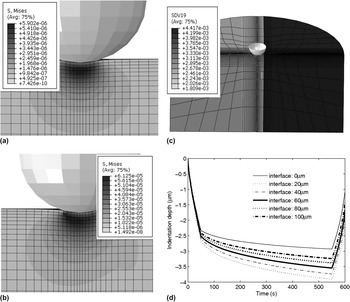
The 3D model was used to create an “experimental” result with materials of known properties. The test for the IFEM approach was then to use this load-depth information provided by the 3D model and to determine the variance in the determined material properties, the general methodology being shown in Fig. 13. A 3D material subroutine with a linear VE constitutive model was developed using material properties obtained from IFEM. The step change in material properties was implemented in the 3D FE model via a user developed 3D UMAT subroutine [Fig. 14(c)]. The similarity of the 3D result to an axisymmetric model is illustrated by Fig. 14, where as can be seen from Fig. 14(a), when the indentation center is 100 μm away from the interface, the stress distribution is almost axisymmetric and when the indentation center is 40 μm away from the interface, the stress distribution is slightly away from axisymmetric distribution [Fig. 14(b)]. Although the material property gradient, material interface, and a step change in property at the interface are involved in the model, the output of FE modeling is still close to be axisymmetric, depending on the distance of indentation location to the material interface.
Schematic diagram showing the process for determining the material properties under various conditions.

Diagram (a) shows the von Mizes stress distribution of an indentation with material interface 100 μm away from the indentation center, (b) illustrates the von Mizes stress distribution with material gradient and material interface 40 μm away from the indentation center, (c) demonstrates the corresponding distribution of instantaneous modulus, and (d) displays the depth versus time curve obtained by artificial tests for different material interface locations of 0, 20, 40, 60, 80, and 100 μm away from the indentation center, respectively.

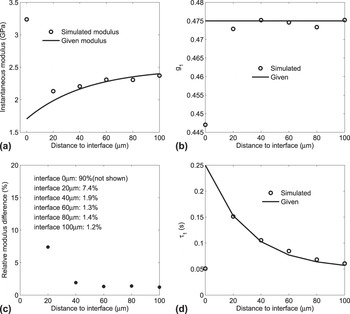
Figure 15 shows the percentage variation in key material properties as the numerical indentation experiment is moved toward the interface. For example, a distance of 0 μm would reflect a 3D FE model of an indentation exactly on the interface between the two materials, from which the axisymmetric IFEM based model would extract material data (which assumes a homogenous VeroClear 810 material distribution). It can be seen that there is a 5–10% error at 20 μm from the interface, beyond which the error increases as the interface is approached. This suggests that at distances greater than ∼20 μm, errors below 5% can be expected, and such discrepancies are significantly below the experimental variations observed near to the surface. Therefore the assumptions on which the IFEM model is based (axisymmetry, small gradients within) can be considered safe, and the influence of the stiffer material can be considered negligible for distances greater than 20 μm from the interface. Noting that this is only correct for these materials and test conditions.
The typical material property difference and error between the given value and the value evaluated by IFEM, by using the artificial test strategy, where (a) shows the instantaneous modulus difference, (b) demonstrates the variation of relative relaxation modulus of g 1, (c) illustrates the corresponding evaluation error, and (d) shows the first relative relaxation modulus difference.

IV. CONCLUSIONS
A 3D ink jet printed part was examined for spatial and temporal variations, with material parameters derived by using IFEM in combination with indentation, and then fitting phenomenological relations to obtain parametric dependencies. This showed a clear z dependence. This z dependence was reduced by further exposure to UV light, which acts to homogenize the material and eliminate the strong gradients in the material properties. The IFEM derived parameters and the phenomenological relations that empirically describe the variation in z and with aging, can be used to predict intra-part properties and how the behavior will evolve with exposure to aging conditions.
ACKNOWLEDGMENTS
The authors would like to acknowledge the support of University of Nottingham and of the Engineering and Physical Research Council for funding under grant EP/I033335/2, the EPSRC Center for Innovative Manufacturing in Additive Manufacturing.