Implications
This work increases the knowledge about the effects of growth path on beef quality. By comparing performance and quality traits from beef produced according to distinct production systems, the results can be used by cattle producers in further decisions regarding how beef should be produced in Mediterranean regions.
Introduction
In order to reinforce sustainable agriculture in the Mediterranean areas, it is important to study alternative strategies to the conventional cattle production based on feeding high-energy concentrates provided ad libitum in feedlot, from weaning until slaughter at 15 to 18 months of age. An alternative to these intensive programmes is the traditional system where calves born in summer are weaned at the beginning of spring and spend all this season on pasture. The cattle are then maintained on low-quality pasture, supplemented with hay until the beginning of the following spring in order to ensure at least the maintenance of live weight. This discontinuous growth (DG) production system allows farmers to take advantage of the bull’s compensatory growth during the second spring when the pasture is abundant and finish the cattle on concentrates for 2 to 3 months before slaughter at 24 months of age. Compensatory growth is the animal’s ability to exhibit, after feed restriction, greater growth rates than control animals of the same chronological age (Hornick et al., Reference Hornick, Van Eenaeme, Clinquart, Diez and Istasse1998). The incorporation of compensatory growth into a cattle management strategy could increase financial returns to cattle producers from enhanced meat quality. However, the positive effects of compensatory growth could be limited by a number of factors. These include the severity and duration of feed restriction, the age at which nutritional restriction occurred, the duration of the compensatory response and the nutritional plan on which animals are re-fed (Coleman and Evans, Reference Coleman and Evans1986; Carstens et al., Reference Carstens, Johnson, Ellenberger and Tatum1991). The traditional or discontinuous production system is less expensive and contributes to the environmental sustainability and biodiversity in Mediterranean areas. However, some beef producers are reluctant to use this system mainly because in order to obtain commercially acceptable carcasses, the animals have to be slaughtered about 6 months later than those produced in intensive systems.
Among beef-eating quality attributes, tenderness is one of the most important beef quality attributes and is influenced by several factors including muscle fibre type profile, sarcomere length, pH, intra-muscular fat (IMF), rate of tenderization (Shackelford et al., Reference Shackelford, Wheeler and Koohmaraie1997; Gil et al., Reference Gil, Serra, Gispert, Àngels Oliver, Sañudo, Panea, Olleta, Campo, Oliván, Osoro, Garcı́a-Cachán, Cruz-Sagredo, Izquierdo, Espejo, Martı́n and Piedrafita2001) and total amount and chemical composition of collagen (Chriki et al., Reference Chriki, Gardner, Jurie, Picard, Micol, Brun, Journaux and Hocquette2012). Nutritional status before slaughter can influence collagen content and its solubility and consequently meat tenderness (Thénard et al., Reference Thénard, Dumont, Grosse, Trommenschlager, Fiorelli and Roux2006). Several studies investigated the effects of growth path and rate on carcass characteristics or meat quality in cattle (Jones et al., Reference Jones, Starkey, Calkins and Crouse1990; Hornick et al., Reference Hornick, Van Eenaeme, Clinquart, Diez and Istasse1998), but they were restricted to evaluation of the Longissimus muscle, regardless that compensatory growth effects on carcass and meat characteristics may be muscle-dependent (Hansen et al., Reference Hansen, Spears, Lloyd and Whisnant2006b). Consequently, results obtained in past studies cannot be extrapolated to the rest of the carcass.
Thus, the aim of the present investigation was to evaluate the effects of production system (continuous growth (CG) v. discontinuous growth (DG)) differences on carcass characteristics and meat quality in eight major muscles from bulls produced in the Mediterranean areas.
Material and methods
Animals and meat samples
A total of 40 purebred Alentejana male calves (9.0±0.46 (mean±s.d.) months of age, 239.0±45 kg live weight) were randomly allocated to four adjacent pens (two pens per experimental group) and were allocated to two distinct feeding regimes. In the CG production system, animals were fed ad libitum with concentrates plus hay throughout the trial and were slaughtered at 18 months of age. In the DG production system, animals were fed ad libitum only hay from 9 to 15 months of age, the cattle were then fed the same diet provided to the CG group (concentrates plus hay) from 15 to 24 months of age. The pens (area about 1000 m2) and the feed bunks (35 m long) were large in order to reduce the animal’s interactions and limitation to feed and to simulate the traditional systems where the bulls graze freely.
The animals were individually weighed every 14 days during the experimental period and were slaughtered at 18 (CG) or 24 (DG) months of age. The weight data are presented in Figure 1 according to time periods.
Average daily gain (ADG) of bulls produced according to continuous growth (CG) and discontinuous growth (DG) systems during different time periods (mean±s.e.). a–c: Different letters differ significantly (P<0.05).

After being stunned with a captive bolt, the cattle were dressed with carcasses suspended by the Achilles tendon. Dressing percentage was calculated as follows: weight of cold carcass/empty BW×100. The carcasses were split along the spine and the kidney knob and channel fat (KKCF) from both sides were removed and weighed. Subsequently, carcass fatness was assessed using a 15-point scale (1 for very limited fat cover to 15 for very extensive fat cover) based on subcutaneous fat deposition as described by Boer et al. (Reference Boer, Dumont, Pomeroy and Weniger1974). After 24 h of chilling at 6°C, the carcasses were then stored at 4°C until 7 days postmortem (cold carcass). The muscle pH and temperature of the longissimus thoracis (Lt) muscle (12th dorsal vertebrae) were assessed at 45 min, 3 h and 24 h postmortem to control chilling rate and pH decline in order to prevent carcasses with the risk for cold shortening (pH above 6.0 at 10 to 12°C and pH24 above 5.8) being included in the present study, as recently reviewed by Warner et al. (2014).
After ageing, carcasses were jointed and two 2.5-cm-thick steaks were taken from the mid-point of the following muscles: supraspinatus (Ss), triceps brachii (Tb), semitendinosus (St), biceps femoris (Bf), rectus femoris (quadriceps femoris (Qf)), gluteus medius (Gm), semimembranosus (Sm) and from the space between the 8th and 12th dorsal vertebrae in the Lt muscle. The steaks, collected from the right carcass side, were vacuum packed and frozen at −30°C for subsequent analysis. The left leg was dissected into bone, muscle, subcutaneous fat and IMF. This joint has been suggested to be representative of the overall bovine carcass composition in the Alentejana breed (Simões and Mendes, Reference Simões and Mendes2003).
Shear force measurements
After thawing for 24 h at 4°C, steaks were grilled to an internal temperature of 70°C (Lufft C120, Munchen, Germany) and 8 to 10 cores parallel to the direction of the muscle fibres were taken from each steak. Shear force, expressed in kg, was measured in a texturometer (TA-tx2i Texture Analyser; Stable Micro Systems, Surrey, UK) equipped with a Warner–Bratzler shear device (WBSF), and data were collected using a specific software (Texture Expert Exceed; Stable Micro Systems, Surrey, UK).
IMF
The IMF was determined using fresh samples from the eight muscles by hydrolysis with 4 M HCl followed by Soxhlet extraction, for 6 h, with petroleum ether (Association of Official Analytical Chemists, 2000).
Myofibril fragmentation index (MFI)
The MFI was determined using frozen samples obtained 7 days postmortem according to the method described by Culler et al. (Reference Culler, Smith and Cross1978).
Total and soluble collagen
Total collagen (TC) from the eight muscles was estimated from the hydroxyproline content of 4 g of minced muscle as described by the International Standard-ISO 3496 (1994).
Heat-soluble collagen (SC) content was determined according to a procedure adapted from (Hill, Reference Hill1966). Duplicate samples (4 g) were homogenized (IKA T-25 Ultra-Turrax, Staufen, Germany) for 30 s and heated at 78°C for 70 min in 0.25 strength Ringer’s solution. After centrifugation, the supernatant was hydrolysed and total collagen content was determined. Insoluble collagen (IC) was determined by calculating the difference between total collagen and heat-soluble collagen. Collagen was expressed as mg/g of live weight fresh muscle.
Meat colour
At seven days postmortem, the lean meat colour of the eight muscles was measured using a Minolta CR-300 chromameter (Konica Minolta, Tokyo, Japan) in the lightness (L*), redness (a*) and yellowness (b*) system, 1 h after air exposure to allow blooming.
Statistical analysis
Meat and carcass traits were analysed using the Proc Mixed procedure of SAS software, version 9.2 (SAS Institute, Cary, NC, USA), considering the animal as the experimental unit. The model included the fixed effect of production system (CG v. DG). Differences between groups were examined for statistical significance at P<0.05 using the PDIFF option. All data were reported as mean±standard error. Average daily gains (ADGs) for each experimental time period were evaluated and are presented in Figure 1, using the STATISTICA software (StatSoft Inc., 2004, Tulsa, OK, USA). Pearson’s correlation coefficients were calculated using the STATISTICA software in order to elucidate possible associations between meat and carcass traits, after Bonferroni correction.
Results
Daily gain and carcass traits
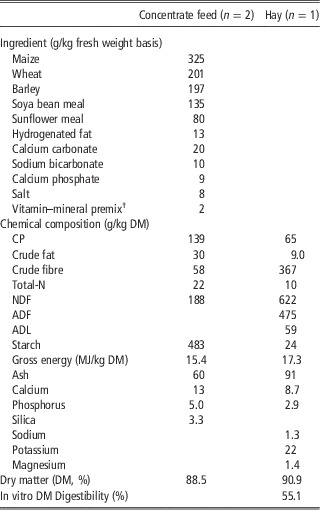
The ingredients and chemical composition of the experimental diets are presented in Table 1.
Ingredients and chemical composition of experimental diets

n=number of diet samples.
† Vitamin–mineral premix contained per kg: 5000 IU vitamin A, 1000 IU vitamin D3, 20 IU vitamin E, 0.16 mg citric acid, 9.5 mg Fe, 110.6 mg Zn, 52.5 mg Mn, 0.3 mg Mo, 0.53 mg Co, 0.11 mg Se, 6.75 mg I, 25.0 mg BHT and 0.16 mg ethoxyquin.
Regarding Figure 1, the ADG between the beginning of the trial (9 months of age) and 15 months of age was more than 1.5 kg/day greater (P<0.0001) in CG than in DG animals. Conversely, in the period between 15 and 18 months of age, the ADG was almost 0.5 kg greater (P=0.0004) in DG than in CG bovines. ADGs for DG bulls were ~1.3 and 1.1 kg/day from 18 to 21 months of age and from 21 to 24 months of age, respectively.
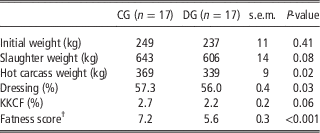
The initial weight was similar between production systems (P=0.41). On average, the CG bulls had about 37 kg heavier (P=0.08) slaughter weights than DG animals (Table 2). Compared with DG bulls, the CG bovines had 25 kg heavier hot carcass (HCW) (P=0.023), 1.2% greater dressing (P=0.001), 0.5% of KKCF (P=0.06) and a 1.6 greater fatness score.
Carcass traits for bulls produced according to continuous (CG) and discontinuous growth (DG) systems

KKCF=kidney knob and channel fat.
† The fatness score was evaluated using a scale ranging from 1 (very low fat cover) to 15 (very high fat cover).
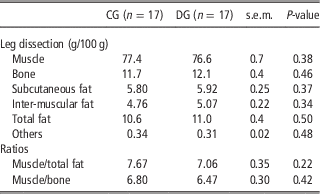
The production system had no effect (P>0.05) neither on the leg joint dissection tissues nor on the muscle/total fat and muscle/bone ratios (Table 3).
Leg joint dissection variables for bulls produced according to continuous (CG) and discontinuous growth (DG) production systems

Total fat=subcutaneous+inter-muscular fat.
Others=lymphatic ganglia, large blood vessels and nerves, tendons and joint capsules.
Meat quality traits
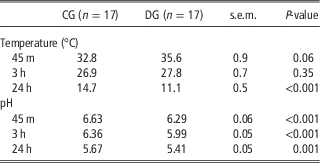
The Lt temperature was 2.8°C higher in DG than in CG animals at 45 min (P=0.061), similar at 3 h and 3.6°C higher in CG than in DG animals at 24 h (P<0.001) (Table 4). Longissimus muscle pH values were consistently greater during all three measurements in CG compared with DG carcasses (P<0.01).
Longissimus thoracis muscle temperature and pH values of bulls produced according to continuous (CG) and discontinuous growth (DG) production systems

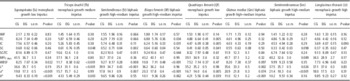
Meat traits of the Ss, Tb, St, Bf, Qf, Gm, Sm and Lt muscles are presented in Table 5. The effect of production system on meat traits greatly depended on the muscle considered. The production system had no noticeable influence (P>0.06) neither on IMF content nor on MFI7 days values across muscles. In contrast, the total (TC) and insoluble (IC) collagen contents were greater in Qf (P<0.01) and lower in Bf (P<0.05) in DG and CG systems, respectively. The DG group had greater SC level in Tb (P=0.041), St (P=0.0023) and Qf (P=0.041) muscles than the CG bulls. As a consequence, the SC/TC was greater in St (P=0.011) and Bf (P=0.044) muscles in the DG group compared with their counterparts.
Meat quality traits for bulls produced according to continuous (CG) and discontinuous growth (DG) production systems

IMF=intra-muscular fat (g/100 g of fresh muscle); TC=total collagen (mg/g of fresh muscle); IC=insoluble collagen (mg/g of fresh muscle); SC=soluble collagen (mg/g of fresh muscle), MFI7 days =myofibril fragmentation index; WBSF=Warner–Bratzler shear force (kg); L*, a*, b*=colour parameters.
Muscle growth impetus according to (Berg and Butterfield, Reference Berg and Butterfield1976).
The WBSF values for Ss, Tb, St and Bf muscles were lower (P<0.03) for DG compared with CG bulls. There were no production system differences (P>0.09) in WBSF for Qf, Gm, Sm and Lt muscles.
The colour parameters were widely affected by the production system.
L* values were lower (P<0.03) in Tb, St, Gm and Sm muscles from DG bulls.
A similar trend was observed for the a* parameter, DG bulls had lower values (P<0.01) for the Ss, St, Bf, Qf and Sm muscles than bulls on the CG system. The b* value was higher (P<0.05) in DG bulls for Tb, Qf and Gm muscles compared with the CG system. Interestingly, the converse was observed for the Ss muscle with the higher value in the CG group (P=0.0004).
Correlations between carcass and meat traits
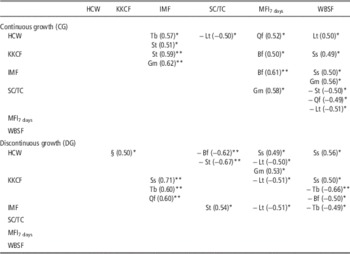
Correlations between carcass and meat traits are presented in Table 6. The muscles are presented whenever the correlation between carcass and meat traits was found significant (P<0.05) within muscles.
Pearson correlation coefficients between carcass and meat quality in bulls produced according to continuous (CG) and discontinuous growth (DG) production systems

HCW=hot carcass weight (kg); KKCF=kidney knob and channel fat (kg); IMF=intra-muscular fat (g/100 g of fresh muscle); IC=insoluble collagen (mg/g of fresh muscle); SC=soluble collagen (mg/g of fresh muscle); MFI7 days=myofibril fragmentation index; WBSF=Warner–Bratzler shear force (kg); Ss=supraspinatus; Tb=triceps brachii; St=semitendinosus; Bf=biceps femoris; Qf=quadriceps femoris; Gm=gluteus medius; Sm=semimembranosus (Sm); Lt=longissimus thoracis muscles.
Correlation values for each muscle are presented in brackets.
**significant at 1% (P<0.01), *significant at 5% (P<0.05), §: non-muscle dependent correlation.
For the CG production system, positive correlations were recorded between HCW and the following: IMF for Tb (r=0.57, P=0.03) and St (r=0.51, P=0.04); MFI7 days for Qf (r=0.52, P=0.04); and WBSF for Lt (r=0.50, P=0.04) muscles. In contrast, the HCW was negatively correlated with SC/TC for Lt (r=−0.50, P=0.04) muscle. Furthermore, the increase in KKCF was positively correlated with IMF in St (r=0.59, P=0.009) and Gm (0.62, P=0.007); MFI7 days for Bf (0.50, P=0.04); and WBSF for Ss (r=0.49, P=0.04) muscles. Moreover, positive correlations were found between IMF and MFI7 days for Bf (0.61, P=0.009); and WBSF for Ss (r=0.50, P=0.04); and Gm (r=0.56, P=0.02) muscle. The SC/TC ratio was positively correlated with MFI7 days for Gm muscle (r=0.58, P=0.01) and negatively correlated with WBSF for St (r=−0.50, P=0.04), Qf (r=−0.49, P=0.04) and Lt (r=−0.51, P=0.04).
Concerning the DG production system, a noticeable relationship was observed between the carcass traits HCW and KKCF (r=0.50, P=0.04). An increase in HCW was related to a lower SC/TC ratio in Bf (r=−0.62, P=0.008) and St (r=−0.67, P=0.004) muscles. Moreover, positive correlations between HCW and MFI7 days were recorded for Ss (r=0.49, P=0.04) and Gm (r=0.53, P=0.03) muscles. In contrast, a negative correlation was observed between HCW and MFI7 days in Lt (r=−0.50, P=0.04) muscle. A direct correlation was observed between HCW and WBSF in Ss (r=0.56, P=0.02) muscle. Furthermore, increasing KKCF proportions in Ss (r=0.71, P=0.002), Tb (r=0.60, P=0.006) and Qf (r=0.60, P=0.007) muscles were associated with greater levels of IMF proportion and lower MFI7 days in Lt (r=−0.51, P=0.04) muscle. Moreover, increasing the KKCF amount was associated with a greater WBSF in Ss (r=0.50, P=0.04) and with lower WBSF values in Tb (r=−0.66, P=0.004) and Bf (r=−0.50, P=0.04) muscles. In addition, the IMF level was positively correlated with SC/TC in St (r=0.54, P=0.03) and was negatively correlated with MFI7 days in Lt (r=−0.51, P=0.04) muscle. A negative correlation was observed between IMF and WBSF in Tb (r=−0.49, P=0.04) muscle.
Discussion
Carcass traits
Regarding carcass traits, at 18 months of age, the bulls of the CG production system had similar (P>0.05) slaughter weights compared with bulls of the DG system and slaughtered at 24 months of age. However, the carcasses from the latter group were lighter, which could be due to a lower dressing %.
The compensatory growth in beef cattle is characterized by high growth rates (Carstens et al., Reference Carstens, Johnson, Ellenberger and Tatum1991) due to improved efficiency in growth and fattening, as a result of an increased feed intake, an increased efficiency in the utilization of protein and energy and an adjustment in energy partitioning (Allingham et al., Reference Allingham, Harper and Hunter1998). Depending on restriction length and intensity, the reduction in the level of energy and protein intake generally leads to a decrease in growth rate with a more pronounced effect on fat deposition (Robelin and Geay, Reference Robelin and Geay1984).
Regarding the period of re-feeding (15 to 18 months of age), the daily gain was more than 0.45 kg greater in the DG group than in the CG group, reflecting the high restriction level used in the experiment. Indeed, under certain limits, the duration of the compensatory growth is proportional to the level of restriction (Coleman and Evans, Reference Coleman and Evans1986). The 15 to 18 months of age period in DG bulls was followed by a sharp decline in ADG, which could be explained by the completion of compensatory growth, and, therefore, an increase in fat deposition. This result is in line with the knowledge that compensatory growth is the highest when the period of growth restriction is relatively short (about 3 months in cattle) (Hornick et al., Reference Hornick, Van Eenaeme, Gérard, Dufrasne and Istasse2000).
In general, ad libitum-fed animals have greater dressing percentages than those fed the same diet on a restricted scale. Moreover, the content of the digestive tract differs widely between animals fed different diets (Béranger and Robelin, Reference Béranger and Robelin1978). Thus, significant modifications in the diet, when cattle change from concentrate feeding to roughage diets, which increases the weight of both the digestive tract and gut contents, could negatively influence dressing percentage (Kempester, Reference Kempester1992). When compared with CG bulls, the lower dressing proportion found in DG animals reveals that the finishing period (9 months) on ad libitum-fed concentrates provided to the DG group, in order to obtain an acceptable commercial carcass, could not have been sufficient to neutralize the effects of the hay-fed phase on the digestive system and some fat depots (including fat cover), which are known to determine dressing percentage (Kempester, Reference Kempester1992).
Tissues react differentially to feed restriction and some are more depleted than others (viscera>adipose tissue>muscle) (Hornick et al., Reference Hornick, Van Eenaeme, Gérard, Dufrasne and Istasse2000). Fatness score depends on subcutaneous fat deposition, which can be more easily depleted than other fat depots during periods of low energy input (Yambayamba et al., Reference Yambayamba, Price and Jones1996), as ocurred in DG bulls. During recovery, the gross efficiency of weight gain (weight gain/kg of feed intake) in DG is greater than in CG animals at the same BW, because the weight gain in the former is mainly due to less fat accumulation and more water and protein (Robelin and Tulloh, Reference Robelin and Tulloh1992). The divergent tissue composition and weight increases between continuous and compensatory growth animals could help explain the differences observed in KKCF and fatness score between CG and DG bulls. The DG had 1.6 points lower fatness score than CG bulls, but this difference probably could have only minor commercial implications. According to the European Union grid method (European Economic Community Regulations (EEC) no. 1208/81 and no. 2930/81), the value corresponds to fat class 2 in DG and 3 in CG carcasses. In contrast to carcass fatness score, the finishing period on concentrates was sufficient to reverse the negative effects of feed restriction on leg muscle, bone and fat contents, as no differences were observed on leg joint dissection between CG and DG bulls (Table 3). The leg joint dissection is a rough estimation of overall carcass tissue composition. However, due to its economic relevance, this finding should be considered by cattle producers when they choose the production system in Mediterranean areas.
Meat traits
Despite the lower temperature at 45 min (P=0.06), there was a slower decrease of meat temperature between 45 min and 24 h after slaughter in CG than in the DG group (data not shown), which may be explained by the greater proportion of carcass fat cover in CG bulls, preventing heat escape. A slower drop in temperature is expected to be associated with a quicker decrease in muscle pH, because higher meat temperature stimulates enzymatic activity and accelerates the rate of pH decline in muscles. Beef carcasses undergoing rapid pH fall while the loin muscle temperature is still high are described as heat shortened, with subsequent negative effects on quality traits (Warner et al., 2014). The temperature at which the muscle enters rigour will impact on the degree of muscle shortening. Cold shortening occurs at temperatures below 15°C, and heat shortening occurs above 20°C (Devine et al., 1999), and each is known to influence the quality characteristics of meat, to varying degrees, particularly the tenderness (Warner et al., 2014).
However, the relationships between temperature and pH values are not easily established in the present study because the pH in Lt muscle was lower in DG than in CG bulls at 45 min, 3 and 24 h, but the temperature was similar between production systems at 45 min and 3 h and was lower in DG bulls at 24 h.
In contrast to carcass subcutaneous fat, the IMF content across muscles was not affected by the production system. The muscle IMF content may affect meat palatability, particularly flavour, juiciness and tenderness of cooked beef. Low amounts of IMF can decrease the eating experience for consumers (Hocquette et al., Reference Hocquette, Gondret, Baéza, Médale, Jurie and Pethick2010). In fact, marbling score has been reported as the carcass grade trait most highly, positively correlated with the beef palatability attributes (May et al., Reference May, Dolezal, Gill, Ray and Buchanan1992). In the present study, the negative correlations between IMF content and WBSF were limited to Tb muscle in DG group (Table 6). Unexpectedly, a positive correlation between those quality traits was observed for Ss and Gm muscles in the CG group, which were among the muscles with the highest IMF content.
Meat tenderness strongly influences the consumer’s re-purchase and choices for a particular meat cut and/or brand (Schönfeldt and Strydom, Reference Schönfeldt and Strydom2011; Costa et al., Reference Costa, Lemos, Lopes, Alfaia, Costa, Bessa and Prates2012). The two major factors determining meat tenderness are the ageing time and the quantity and characteristics of the intra-muscular collagen (Takahashi, Reference Takahashi1996; Chriki et al., Reference Chriki, Gardner, Jurie, Picard, Micol, Brun, Journaux and Hocquette2012). The influence of the production system on WBSF was muscle-dependent, which is in agreement with the findings from other authors (Hansen et al., Reference Hansen, Therkildsen and Byrne2006a). Interestingly, within muscles, the WBSF numeric values were greater in CG than in DG bulls. However, the differences were only statically significant (P<0.05) for Ss, Tb, St and Bf muscles.
The Ss, Tb, St and Bf muscles are those in which the connective tissue content gives a major contribution to tenderness (Koohmaraie et al., Reference Koohmaraie, Kent, Shackelford, Veiseth and Wheeler2002). In general, muscles with greater collagen content possess higher crosslink concentrations per unit of collagen than muscles with lower collagen content (Light et al., Reference Light, Champion, Voyle and Bailey1985). It is noteworthy that the WBSF, but not the MFI7 days values, were significantly affected by the production system for these four muscles (Table 5). This figure could be, in part, associated with the effects on collagen quality, particularly the SC content in Tb and St muscles. Newly synthesized collagen could dilute the pre-existing, heat-stable collagen, leading to increased collagen solubility. Positive correlations between WBSF and collagen content were previously reported (Oury et al., Reference Oury, Picard, Briand, Blanquet and Dumont2009) and were confirmed in the present study only for the St, Qf and Lt muscles within CG bulls (Table 6). These results suggest that collagen content has a different response to production systems depending on the muscle considered, which is in agreement with studies by Cassar-Malek et al. (Reference Cassar-Malek, Hocquette, Jurie, Listrat, Jailler, Bauchart, Briand and Picard2004). These authors stated that nutrition in cattle plays a significant role in the regulation of muscle characteristics, and this regulation is highly dependent on muscle type. Individual muscles respond differently to a compensatory growth path in terms of collagen solubility. However, the contribution of collagen to beef tenderness depends on ageing time, and comparisons with results from other studies should be carried out with caution when different ageing times are used.
Meat tenderness is associated with protein degradation, influenced by the postmortem activity of proteolytic enzymes. As these enzymes are also involved in protein turnover in the living muscles, it could be expected that feed-restriction, followed by re-alimentation, could have the potential to improve tenderness (Therkildsen, Reference Therkildsen2005). Rapid growth, as observed in the compensatory phase, increases protein turnover and the ratio between protein synthesis and degradation in connective tissue and myofibrils, making these younger and more liable to breakdown during conditioning and cooking. Generally, the structural changes in intra-muscular connective tissue caused by compensatory growth have a positive effect on SC content, reversing the negative effects of age on solubility (Gerrard et al., Reference Gerrard, Jones, Aberle, Lemenager, Diekman and Judge1987). This could explain the increased amount of SC observed in Tb, St and Qf muscles from older DG bulls. As quoted before, these differences in SC content between DG and CG bulls may have contributed to explain the lower WBSF values found in the group slaughtered at an older age.
Paradoxically, the MFI7 days value was not affected by the production system for any muscle. This contrasts with previous studies addressing the effects of feed restriction and compensatory growth in steers (Jones et al., Reference Jones, Starkey, Calkins and Crouse1990; Muir et al., Reference Muir, Smith, Dobbie, Smith and Bown2001), calves (Therkildsen et al., Reference Therkildsen, Larsen and Vestergaard2002) and bulls slaughtered before 13 months of age (Therkildsen, Reference Therkildsen2005, Hansen et al., Reference Hansen, Therkildsen and Byrne2006a). These authors reported that compensatory growth promotes postmortem myofibrillar protein degradation as a consequence of a greater protein turnover before slaughter. However, in opposition to studies by Hansen et al. (Reference Hansen, Therkildsen and Byrne2006a), Jones et al. (Reference Jones, Starkey, Calkins and Crouse1990) and Therkildsen (Reference Therkildsen2005) where the compensation period was short (⩽5 months), the DG had a long period (9 months) of re-feeding and the ADG peak occurred between 15 and 18 months of age. It is possible that, at 24 months of age, part of the effects on myofibrillar proteins were diluted and no longer observed. In addition, the lack of a production system effect on MFI7 days may be attributed to the inhibitory effects of testosterone on protein turnover, which is known to peak at around 15 months of age (Gerrard et al., Reference Gerrard, Jones, Aberle, Lemenager, Diekman and Judge1987), and to an enhanced calpastatin activity. Increased postmortem activity of calpastatin was reported to decrease the activity of μ-calpain, and therefore the amount of postmortem protein degradation and tenderization (Morton et al., Reference Morton, Bickerstaffe, Kent, Dransfield and Keeley1999). The inhibitory effect of testosterone on myofibrillar protein degradation was not extended to the connective tissue in the present study. This is consistent with the findings of Geesink et al. (Reference Geesink, Kuchay, Chishti and Koohmaraie2006), who reported that μ-calpain is the enzyme primarily responsible for postmortem degradation of myofibrillar proteins, acting on muscle contraction structure. Research has shown that μ-calpain action is temperature- and pH-dependent, as it is modulated by calpastatin binding, which in turn is influenced by both factors (Morton et al., Reference Morton, Bickerstaffe, Kent, Dransfield and Keeley1999). These authors found that the lower the pH the faster the decline in μ-calpain activity, and both were positively related to meant tenderness at 48 h postmortem. In the present study, the pH at 45 m, 3 h and 24 h evaluated in the Lt muscle was greater in CG when compared with the DG group (Table 4). However, no differences were found between groups neither for MFI7 days nor for WBSF values in Lt muscle. Furthermore, no significant correlations were found between MFI7 days and WBSF within CG and DG groups (Table 6), which re-inforce the lack of relationship between these two parameters in this study. Taking into account the differences in Lt pH between CG and DG groups and the role of pH in beef tenderness, it would have been useful to assess the levels of glucose, lactate, adrenaline and cortisol in blood in order to better understand the effect of growth path in muscle pH and WBSF. This remark should be considered in future studies about the effect of growth path on meat quality.
Meat colour is one of the most important characteristics according to which consumers make judgements on meat quality. It influences the consumer’s purchase decisions because it is perceived as a measure of freshness and quality (Mancini and Hunt, Reference Mancini and Hunt2005).
The ultimate pH is highly correlated to meat colour and lightness in particular (Mancini and Hunt, Reference Mancini and Hunt2005). Regarding the Lt muscle (Tables 4 and 5), if the pH at 24 h is considered as ultimate pH, the difference between CG and DG bulls (0.26 pH units, P=0.0011) was not sufficient to cause differences in colour. However, among the eight muscles studied, the Lt muscle was the only one where the production system did not affect the colour parameters. However, the ultimate pH is not the only factor responsible for differences in meat colour (Priolo et al., Reference Priolo, Micol and Agabriel2001). In a study by Hornick et al. (Reference Hornick, Van Eenaeme, Clinquart, Diez and Istasse1998), higher a* and b* values in the Lt muscle were found in groups that exhibited a more noticeable compensatory growth. The authors associated the higher colour values with the higher temperature found in Lt muscle after slaughter. In the present study, a relationship between colour parameters and carcass temperature (evaluated in the Lt muscle) was only observed in Ss, Qf and Sm muscles, where the CG bulls had the greater a* values and higher carcass temperatures at 24 h postmortem. The b* values did not follow the same pattern, and when compared with CG bulls, DG bulls had higher b* values in Tb and Qf and lower values in Ss, St and Bf muscles. In general, it was expected that colour variables would be higher in older animals (DG bulls), because muscle myoglobin increases ageing. However, other muscle-related factors including muscle allometry, chemical composition and fibre profile, all of which are known to be influenced by age and growth rate, could have contributed to the differences found in colour parameters.
Conclusions
Taking advantage of compensatory growth in bovine production could represent a relevant economic opportunity, which contributes to the environmental sustainability and biodiversity in Mediterranean areas. The compensatory growth production system produced slight negative effects on hot carcass weight, fatness and dressing percentage, but the proportions between fat, bone and muscle remained the same. In contrast, there was an overall positive impact of compensatory growth on muscle tenderness, overcoming the negative effects of age at slaughter. The reasons for such an improvement in meat tenderness are not clear because neither IMF nor myofibrillar protein degradation could explain the differences between production systems. Moreover, an association between meat tenderness and collagen properties was difficult to establish, possibly due to the short ageing time. Finally, our results indicate that compensatory growth has a muscle-dependent effect and a significant impact on several muscle and carcass characteristics.
Acknowledgements
This research was supported by the Fundação para a Ciência e a Tecnologia (FCT) through financial support from FCT grants (PTDC/CVT/65707/2006 and PTDC/CVT/111744/2009) and individual fellowships to Paulo Costa (SFRH/BPD/46135/2008) and to Ana S. H. Costa (SFRH/BD/61068/2009). We are grateful to António Sequeira for his decisive role in animal management during the trial. We are grateful to the EZN slaughterhouse staff, particularly to Paula Menezes for her help with carcass data and meat sample collection.